Plata’s Bond Debut: A Bet on Mexico’s Digital Banking BoomMexico’s digital banking industry is gaining momentum, and Plata, a fast-emerging fintech player, is making waves with its debut bond issuance. Targeting $120 million (with the potential to scale up to $200 million) marks a turning point for a company transitioning from a credit card issuer to a full-fledged digital bank. For us, it’s a chance to tap into the growth of financial inclusion in Latin America’s second-largest economy. But with high rewards come risks we must note, as usual. So, here’s what we need to know about Plata and its latest move.
From Credit Cards to Banking: Plata’s Evolution
Plata started in 2023 as a credit card issuer, focusing on Mexico’s underbanked population—a segment that makes up roughly 60% of the country’s 130 million people. By December 2024, Plata secured a banking license from Mexican regulators, a game-changer that allows it to issue loans directly from its balance sheet and, starting in 2026, accept deposits upon meeting specific conditions. The change has undoubtedly expanded the company's scope of activity and its revenue potential.
The company’s flagship product, the Plata Card, offers an average credit limit of $10,000 at interest rates exceeding 30%, targeting small loans averaging $200 per customer. With 1.5 million cardholders by mid-2025, Plata has built a diversified portfolio designed to be manageable for its target market. Backed by $450 million in equity financing, including a hefty 70% stake from Baring Fintech Private Equity Americas Fund, Plata also boasts a management team with roots from Tinkoff Bank—a fintech known for its innovative, customer-first approach. For a more convenient analogy, this business model is very similar to that used by the American bank Capital One NYSE:COF , allowing customers to manage their finances entirely through digital channels, from opening an account to investing, without visiting branches. Most services are digitally oriented.
The Bond Offering: Terms and Appeal
Plata’s bond issuance introduces a three-year, senior unsecured note featuring a callable structure, designed to stimulate its growth ambitions while offering investors a compelling opportunity. The offering begins at $120 million, with the flexibility to expand to $200 million, indicating confidence in its market reception. The bond carries a tenor of three years, with call options kicking in after 18 months at 106% of par value, gradually declining to 101% near maturity, signaling the issuer’s optimism about achieving early repayment as the business scales. Initially marketed with a 16% coupon rate, investor demand briefly pushed expectations toward 12%, though the final rate is anticipated to stabilize between 15% and 16%, paid semi-annually, which underlines the bond’s high yield potential, stemming from Mexico’s emerging market dynamics and Plata’s nascent stage. A put option further enhances its appeal, allowing bondholders to exit at 101% if a change of control occurs, providing a safety net against ownership uncertainties. While this structure attracts yield-hungry investors, liquidity poses a challenge, as the minimum trading lot of $125,000 and settlement through a Norwegian central securities depository—linked to Euroclear via Scandinavian banks—may restrict secondary market activity.
Financial Snapshot: Growth at a Cost
Plata’s financials reflect the classic fintech tradeoff: heavy upfront investment for long-term gains. The company has burned through $260 million of its $450 million equity raise over three years, a planned cash burn to fuel customer acquisition and technology development. Despite this, Plata’s loan portfolio yields a net contribution margin of around 2%, and it’s on track to break even by Q2 2028.
Credit quality is improving, too. In June 2023, 33% of new cardholders defaulted after their first payment—a steep learning curve. By 2025, sharper underwriting has slashed non-performing loans (NPLs) to 15%, a manageable level given the 70% gross yield on its products. With an equity ratio projected at 22%, Plata’s capital cushion looks robust for a growth-stage bank.
Mexico’s Underbanked Opportunity
Mexico’s banking sector is ripe for disruption. Traditional banks have been slow to serve the underbanked, leaving room for digital players like Plata to step in. Leveraging an app-only platform and rapid credit card delivery, Plata follows successful footsteps of Tinkoff’s or the more well-known Capital One model, adapted for Mexico’s unique market. The company’s IT backbone, partly based in Cyprus at the upscale Trinity building, underscores its tech-driven approach. The company’s IT backbone, partly based in Cyprus at the upscale Trinity building, underscores its tech-driven approach.
Competition is intensifying, with established banks and other fintechs vying for the same customers. Yet Plata’s early traction—1.5 million users in two years—and its focus on small, accessible loans give it an edge. If it can scale while keeping NPLs in check, Plata could capture a sizable slice of this underserved market.
Risks to Watch
The allure of high yields comes with significant uncertainties, given Plata’s short operational history and heavy reliance on rapid expansion. The company faces potential threats from Mexico’s economic volatility, where currency fluctuations and macroeconomic instability could erode profitability, alongside the risk of regulatory shifts in banking or fintech that might upend its business model. Credit risk remains a concern, as a surge in possible defaults could pressure its balance sheet despite recent improvements in loan performance, while the bond’s modest $120 million size and reliance on a Norwegian depository could deter some investors and limit liquidity in the secondary market. Nevertheless, Plata’s credibility is bolstered by its backers at Baring Fintech, a firm with a successful track record supporting companies like Kaspi NASDAQ:KSPI and Revolut, which lends a degree of reassurance. Additionally, the bond’s flexible structure, with call and put options, helps mitigate some of these risks, offering both the issuer and investors strategic adaptability in navigating this high-stakes venture.
The Verdict: A High-Yield Play with Caveats
Plata’s bond debut is a pretty well entry point into Mexico’s digital banking surge. A 15-16% yield is hard to ignore, especially with a clear path to profitability and strong equity support. For investors comfortable with emerging market risk, it’s an opportunity to support a fintech with it big digital potential in a market begging for innovation.
But look first, then leap as some say. Thin liquidity and credit uncertainties mean this isn’t a casual investment. Those considering it should weigh the upside—growth in an underbanked hotspot—against the downside of a young bank in a volatile region. For the right portfolio, Plata’s bonds could be a calculated win. Just don’t expect a smooth ride.
ETF market

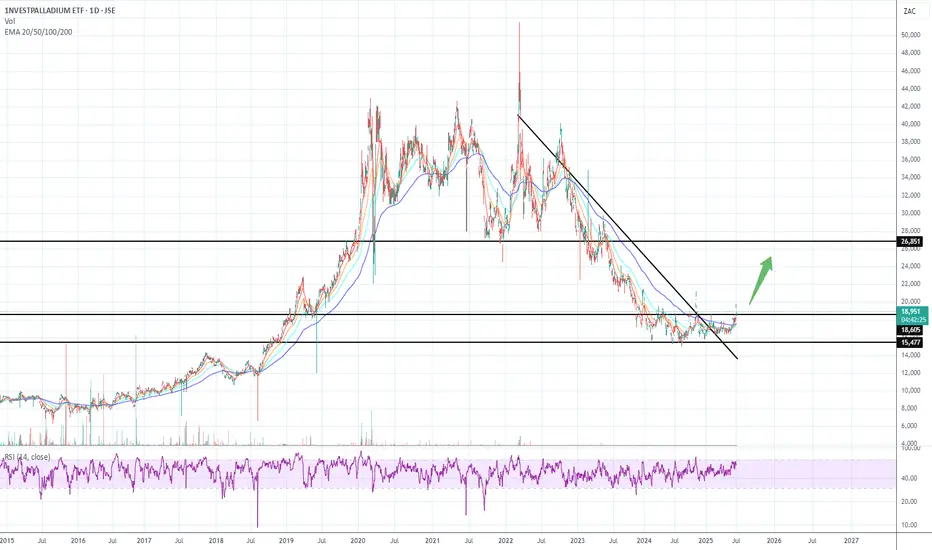
Palladium looking to rebound after consolidationPalladium has had a lengthy price consolidation after a deep retracement. Breakout underway, with attractive upside potential.
10 Small-Cap Biotechs with Key Catalysts for 2025 July List________________________________________
🔬 10 Small-Cap Biotechs with Key Catalysts for 2025 July List
________________________________________
1. Allogene Therapeutics (NASDAQ: ALLO)
• Catalyst: Phase 2 data for ALLO-501A (anti-CD19 CAR-T for large B-cell lymphoma) expected in H2 2025; potential pivotal data could lead to regulatory submission.
• Highlights: “Off-the-shelf” allogeneic CAR-T approach could transform cell therapy; watch for manufacturing/scalability updates.
________________________________________
2. Lixte Biotechnology (NASDAQ: LIXT)
• Catalyst: Phase 2 combo trial of LB-100 (PP2A inhibitor) + immunotherapy in solid tumors, with key data expected in late 2025.
• Highlights: If efficacy signals emerge, could prompt partnerships or additional trials.
________________________________________
3. Iovance Biotherapeutics (NASDAQ: IOVA)
• Catalyst: Commercial launch and sales uptake for AMTAGVI (lifileucel, first FDA-approved TIL therapy in advanced melanoma); upcoming label expansion studies in lung and cervical cancer.
• Highlights: Investor focus on launch ramp, real-world data, and new trial initiations in 2025.
________________________________________
4. RenBio (NASDAQ: RENB)
• Catalyst: Phase 1/2 data for RB-100 (bispecific antibody platform in solid tumors) expected mid-to-late 2025.
• Highlights: Pipeline progress and partnership announcements possible.
________________________________________
5. IGM Biosciences (NASDAQ: IGMS)
• Catalyst: Phase 2 data for IGM-2323 (CD20 x CD3 bispecific in non-Hodgkin lymphoma) expected early 2025; ongoing updates from IgM antibody platform.
• Highlights: Investor interest in clinical safety, efficacy, and potential for big pharma tie-ups.
________________________________________
6. Zura Bio (NASDAQ: ZURA)
• Catalyst: Phase 2b/3 trial start and topline data for tibulizumab (IL-7Ra mAb for autoimmune diseases) expected late 2025.
• Highlights: Focus on rare and orphan autoimmune indications.
________________________________________
7. INmune Bio (NASDAQ: INMB)
• Catalyst: Phase 2 Alzheimer’s data (XPro1595, targeting neuroinflammation) and oncology pipeline updates expected H1 2025.
• Highlights: Any signal in Alzheimer’s is high-impact; monitoring for FDA guidance.
________________________________________
8. Veru Inc (NASDAQ: VERU)
• Catalyst: Phase 3 trial results for enobosarm (oral SARM) in advanced breast cancer expected 2025; also, COVID/sepsis drug updates.
• Highlights: Regulatory clarity and partnership/M&A rumors are potential drivers.
________________________________________
9. Century Therapeutics (NASDAQ: IPSC)
• Catalyst: First-in-human data for iPSC-derived NK and CAR-T cell therapies, with updates expected at major meetings in 2025.
• Highlights: Platform validation and early efficacy/safety signals.
________________________________________
10. ProKidney (NASDAQ: PROK)
• Catalyst: Phase 3 pivotal data for REACT (cell therapy for chronic kidney disease/diabetes) due late 2025.
• Highlights: If positive, could become the first autologous cell therapy for kidney disease.
________________________________________
🔎 How to Monitor These Catalysts
• FDA submissions/meetings (ALLO, PROK, VERU)
• Clinical trial readouts (LIXT, RENB, IGMS, ZURA, INMB, IPSC)
• Commercial/launch data (IOVA)
• Partnership/M&A activity (IGMS, VERU, RENB)
________________________________________
📊 Summary Table
Ticker Company Upcoming Catalyst/Event Timeframe
ALLO Allogene Therapeutics Phase 2 LBCL CAR-T pivotal data H2 2025
LIXT Lixte Biotechnology LB-100 + immunotherapy Phase 2 data Late 2025
IOVA Iovance Biotherapeutics AMTAGVI launch data; label expansions Throughout 2025
RENB RenBio Bispecifics Phase 1/2 data Mid-to-late 2025
IGMS IGM Biosciences IGM-2323 Phase 2 data (lymphoma) Early 2025
ZURA Zura Bio Tibulizumab Phase 2b/3 topline data Late 2025
INMB INmune Bio Alzheimer’s/oncology trial updates H1 2025
VERU Veru Inc Enobosarm Phase 3 (breast cancer) 2025
IPSC Century Therapeutics First-in-human iPSC cell therapy data 2025
PROK ProKidney REACT Phase 3 (CKD) pivotal readout Late 2025
________________________________________
⚠️ Word of Caution
Small-cap biotech stocks can be extremely volatile, especially around catalyst events (trial data, FDA decisions). Sharp price swings—both up and down—are common. Always conduct your own research and be aware of the risks.

QQQ: Scaling Recursive PatternsSo far the closest recursive pattern that can mimic current growth would be shape of expansion after covid crash. In both cases the fall was sharp that caused it grow in distinctive way, so we can grab the cycle of the pattern. To keep it simple for this structure, crossing curve would be first sign that price breaks out of regular rhythm and might dive sooner. Added other related patterns:

Dow Jones LongsCouple long ideas,
Price action is sitting on big volume note
Sooner or later expect bullish price action
Conservative Position sizing is prudent in this market environment

SPY/QQQ Plan Your Trade For 7-1 : Post Market UpdateToday was a very powerful day for the Cycle Patterns - particularly for Gold and BTCUSD.
Gold rallied as the Cycle Pattern predicted a RALLY in TREND mode.
BTCUSD collapsed on a CRUSH Cycle Pattern.
The SPY Cycle Pattern predicted a Gap Reversal pattern. We did see the Gap today and a moderate reversal in price. But the SPY, as usual, continued to try to melt upward.
I highlighted a very interesting TWINNING pattern in Bitcoin in this video. Pay attention.
Get some.
#trading #research #investing #tradingalgos #tradingsignals #cycles #fibonacci #elliotwave #modelingsystems #stocks #bitcoin #btcusd #cryptos #spy #gold #nq #investing #trading #spytrading #spymarket #tradingmarket #stockmarket #silver

Nightly $SPY / $SPX Scenarios for July 2, 2025🔮 Nightly AMEX:SPY / SP:SPX Scenarios for July 2, 2025 🔮
🌍 Market-Moving News 🌍
🏭 U.S. Manufacturing Remains Under Pressure
The ISM Manufacturing PMI for June rose slightly to 49.0 from 48.5 in May—still in contraction territory. Tariff-induced uncertainty and rising input costs continue to weigh on factory activity, with new orders still weak and employment contracting
📈 Global Factory Rebound Led by India & Europe
While U.S. factories struggle, India hit a 14-month high in its manufacturing PMI at 58.4, and euro‑zone factory orders stabilized at 49.5—the first sign of recovery in over three years. Asia-Europe divergence may shift global capital flows .
🏦 Powell Says Tariffs Are Delaying Rate Cuts
Fed Chair Powell warned at the ECB forum in Sintra that elevated inflation—driven in part by Trump-era tariffs—has postponed the timeline for U.S. rate cuts. The Fed’s dot-plot now indicates only two cuts for 2025, with markets adjusting accordingly
💵 Dollar Nears 3½-Year Lows
The U.S. dollar weakened further, trading near a three-and-a-half-year low amid soft PMI data, a dovish Fed tilt, and renewed optimism over U.S.–Canada trade talks
📊 Key Data Releases & Events 📊
📅 Wednesday, July 2:
(No major scheduled U.S. economic data)
Market focus shifts to upcoming Nonfarm Payrolls on July 3, Powell's remarks, and trade-talk headlines.
⚠️ Disclaimer:
This information is for educational and informational purposes only and should not be construed as financial advice. Always consult a licensed financial advisor before making investment decisions.
📌 #trading #stockmarket #economy #manufacturing #Fed #inflation #charting #technicalanalysis

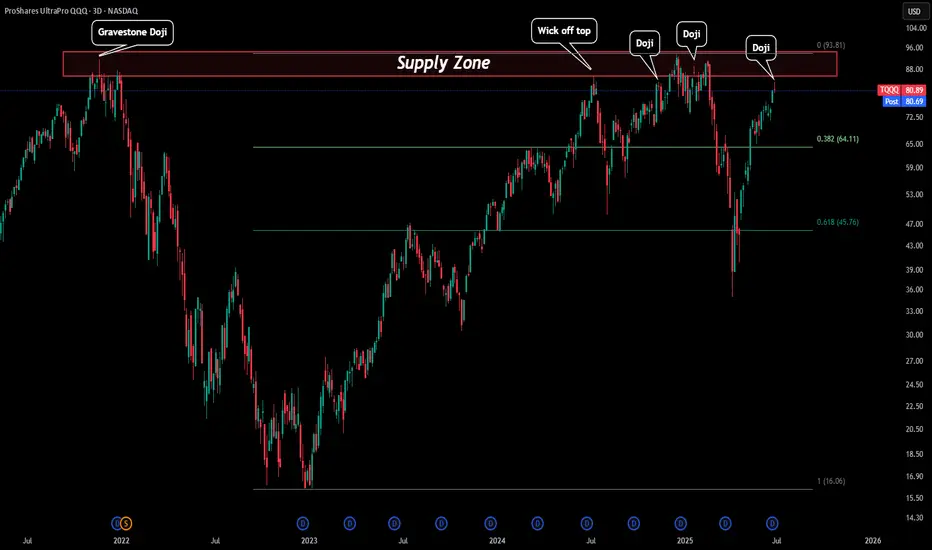
TQQQ - Red Days Ahead?TQQQ just created a 3D doji. The reason this is important is everytime we have seen reversal candles close to or in our red box (Supply zone) usually we see selloffs follow.
Price came very close to the red box and created a 3D reversal doji that could signal some downside price action. If this is to occur the first level to watch would be our 0.382 Fibonacci level around $65.
How I screen for long term investmentsIn this video, I’ll show you the exact stock screener I use to find long-term investment opportunities — the kind of stocks you can buy and hold for years.
I’ll walk you through the key metrics to look for, how to use free tools like TradingView screener, and what red flags to avoid. This strategy is perfect for beginner and experienced investors who want to build long-term wealth, not chase hype.
Whether you're looking for undervalued stocks, consistent compounders, or just trying to build your long-term portfolio, this screener can help.
Hope you enjoy!!

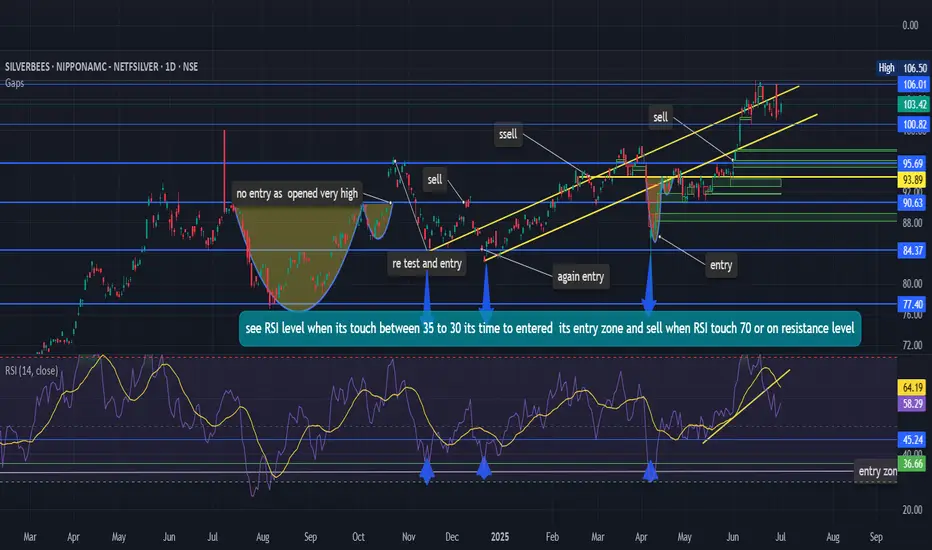
nifty siver bees chart Nifty Silver BeES – RSI Strategy & Quick Analysis
I wanted to share this Nifty Silver BeES chart with you all, purely for learning and discussion. By studying this chart, you might find some useful insights to sharpen your own analysis.
One of the key things here is the RSI (Relative Strength Index) — it plays a major role in identifying potential entry and exit zones:
✅ Entry Zone: Whenever the RSI drops into the 30–35 range, it often signals a good buying opportunity. Historically, we tend to see a decent upward move from this zone.
🚩 Exit Zone: When the RSI approaches 70 or higher — especially near resistance levels — that’s usually a signal to start selling or at least tightening stops.
That said, patience is absolutely crucial with this approach. Sometimes profit booking can take a while, and at other times, it could be as quick as “buy and get out.” It all depends on how the market behaves on that particular day.
If you find this chart interesting, do let me know. And if you spot any ways to improve this strategy or add more depth to the analysis, I’d love to hear your thoughts!
By the way, targeting a quick 2–4% profit often works quite well with this method, provided you stick to your plan and manage risk carefully.
Update on the markets 7-1-2025SPX still floating but IWM and DJT are both having strong rallies, which usually means SPX will go higher today or tomorrow. Gold is at resistance. NG is a support. OIl still looks like a bear flag. BTC is pulling back from 107k - again.

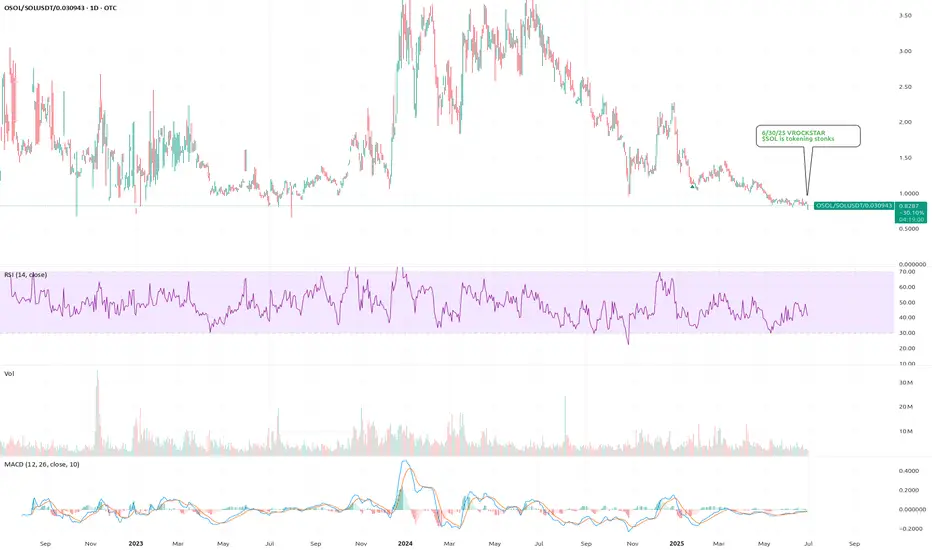
6/30/25 - $osol - $SOL is tokening stonks6/30/25 :: VROCKSTAR :: OTC:OSOL
CRYPTOCAP:SOL is tokening stonks
- so OTC:OSOL is osprey's SOL closed end fund
- similar to OTC:OBTC that i talk about, the chart you see below is vs. the NAV e.g. this is currently at 17% discount to spot
- and we know SOL will have an ETF this month
- we see stocks being now tokenized on chain and SOL is the chain that will see the most volume
- so if you like stable coins... you should like tokenized stocks even better
- closed end funds trade funny
V
QQQ A Fall Expected! SELL!
My dear subscribers,
This is my opinion on the QQQ next move:
The instrument tests an important psychological level 548.21
Bias - Bearish
Technical Indicators: Supper Trend gives a precise Bearish signal, while Pivot Point HL predicts price changes and potential reversals in the market.
Target - 535.27
About Used Indicators:
On the subsequent day, trading above the pivot point is thought to indicate ongoing bullish sentiment, while trading below the pivot point indicates bearish sentiment.
Disclosure: I am part of Trade Nation's Influencer program and receive a monthly fee for using their TradingView charts in my analysis.
———————————
WISH YOU ALL LUCK

QQQ 30/04/2025 ShortFailure to break back inside the ascending channel
IMO going down to form a double bottom 410$

$SPY Review of 6.30.25Yesterday’s price action was flat near previous ATH’s for the first part of the day and then the second part of the day we had some nice volatility that tapped the top of the implied move at 619 and then pulled back.

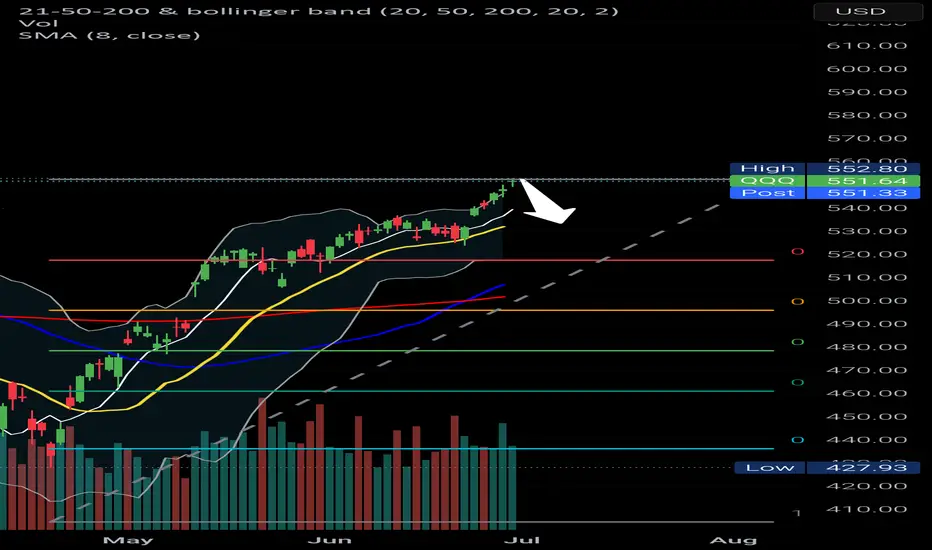
QQQ Nasdaq 100 Year-End Price Target and Technical Rebound SetupIf you haven`t bought the previous oversold area on QQQ:
Now the Nasdaq-100 ETF (QQQ), which tracks the performance of the largest non-financial companies in the Nasdaq, has recently entered oversold territory, suggesting that a technical rebound may be imminent. Similar to the Russell 2000, QQQ has experienced significant selling pressure, driving key technical indicators into oversold zones and creating favorable conditions for a bounce.
The Relative Strength Index (RSI) has dropped below 30, a level that typically signals oversold conditions and the potential for a reversal. Additionally, QQQ is trading near key support levels, with a large portion of its components underperforming their 50-day and 200-day moving averages — a classic setup for a mean reversion rally.
From a historical perspective, QQQ has shown a tendency to rebound strongly after similar oversold conditions, particularly when macroeconomic factors stabilize and buying pressure returns. Given the current technical setup, my price target for QQQ is $550 by the end of the year. This represents a recovery of approximately 8-10% from current levels, aligning with previous post-oversold rallies in the index.
While downside risks remain — including potential volatility around Federal Reserve policy and broader economic data — the technical backdrop suggests that QQQ is well-positioned for a recovery in the coming months.

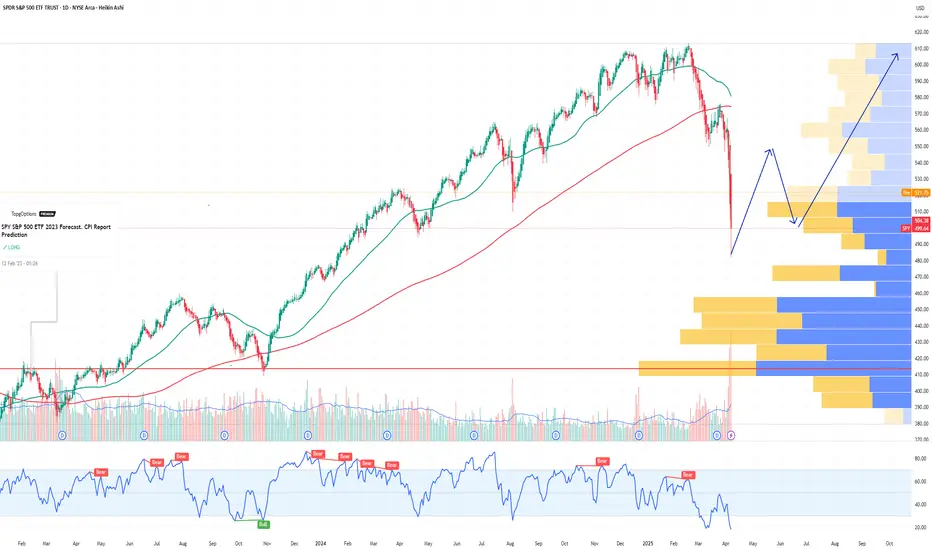
SPY S&P 500 ETF Potential W-Shaped Recovery Forming We may be witnessing the formation of a W-shaped recovery on the SPY (S&P 500 ETF) – a classic double-bottom structure that often signals a strong reversal after a period of correction or volatility. Let’s dive into the technicals and what this could mean in the sessions ahead.
🔍 The Technical Setup:
SPY recently tested key support around the $485-$500 zone, bouncing off that area twice in the past few weeks. This gives us the left leg of the W and the first bottom. After a modest relief rally to ~$520, we saw another pullback – but this second dip failed to break below the first bottom, a hallmark of the W-pattern.
As of today, SPY is starting to reclaim ground toward the $517-$520 resistance zone. If bulls can push through this neckline area, especially with volume confirmation, we could see a breakout that targets the $530-$535 area in the short term.
🔑 Key Levels to Watch:
Support: $490-$500 (double-bottom support zone)
Neckline/Resistance: $530
Breakout Target: $550 (previous highs)
Invalidation: A break below $490 with volume could invalidate the W-recovery idea and shift bias bearish.
📊 Momentum & Volume:
RSI is climbing back above the 50 level – bullish momentum building.
MACD shows a potential crossover forming, hinting at a shift in trend.
Watch for increasing buy volume as SPY approaches the neckline – that’s where the bulls will need to step up.
🧠 Macro & Earnings Angle:
Don’t forget – we’re entering a heavy earnings season and rate cut expectations are still a wildcard. A dovish tone from the Fed and strong corporate results could be the fuel that sends SPY higher to complete this W-shaped recovery.
🧭 Final Thoughts:
This is a high-probability setup if neckline resistance is broken cleanly. Wait for confirmation before going heavy – fakeouts are common in double-bottom scenarios. If we do get the breakout, we may be looking at a broader market rebound going into summer.
🔔 Set alerts near $525. A confirmed breakout could mean the bulls are back in charge.
Nightly $SPY / $SPX Scenarios for July 1, 2025 🔮 Nightly AMEX:SPY / SP:SPX Scenarios for July 1, 2025 🔮
🌍 Market-Moving News 🌍
📊 Core Inflation Edges Higher
May’s core inflation rose unexpectedly to 2.7% year-over-year, up from 2.6%, casting uncertainty over the Fed’s timeline for rate cuts. While headline CPI sits at 2.3%, the resilience in underlying prices complicates policymakers’ projections for later this year
💵 Weak Dollar, Rising Rate-Cut Bets
Markets are reacting to “summertime data”—like the core CPI uptick—with renewed optimism. Traders now see up to 75 bps in Fed rate cuts later this year, while the dollar remains near 3½-year lows on concerns about Powell’s independence and trade developments
🇨🇦 U.S.–Canada Trade Talks Resume
Trade talks between the U.S. and Canada restarted today, following Ottawa’s suspension of its digital-services tax. Progress toward a broader agreement could reduce tariff risk and offer further relief to risk assets
📊 Key Data Releases & Events 📊
📅 Tuesday, July 1:
All Day – U.S.–Canada Trade Talks
Markets will watch for updates on tariff resolution and broader trade deals. Any breakthrough could notably boost equities and improve trade sentiment.
10:00 AM ET – ISM Manufacturing PMI (June)
A below-50 reading again would reinforce the narrative of industrial weakness. A rebound could support equities and temper recession concerns
10:00 AM ET – JOLTS Job Openings (May)
Still at elevated levels (~7.39 million in April), this metric assesses labor-market resilience. A decline could shift rate-cut expectations.
⚠️ Disclaimer:
This is for educational and informational purposes only. It does not constitute financial advice. Consult a licensed financial advisor before investing.
📌 #trading #stockmarket #economy #news #trendtao #charting #technicalanalysis

Qqq short Qqq short 532
Bounce LH and another dump
No need to complicate things too much .
Good luck
I'm betting on the rise of the S\&P 500, therefore I'm betting oWe broke through the local level and are confidently moving toward the all-time high.
We are also above all moving averages, which gives us additional confidence in our trade.

XLV BreakoutThe XLV is breaking out after testing the $147-$148 area as resistance since late February. It finally broke out recently and came back down to retest the area as support yesterday, successfully. 1st Upside target is $157, followed by $162 for a secondary target. As markets are falling this week, healthcare typically does well in a bear market, so this breakout makes sense. Also, volume has gone up with the breakout, confirming price action

The Big Banks are in BIG TROUBLEAs you can see on this weekly chart, the XLF has been in this steady up trend since October 2023. It bounced off this upward slopping trendline 3 different times and then finally broke through it on the 4th hit, then came back up to test the underside of the trendline as resistance. It did get back above the trendline briefly last month, but it ended up being a bull trap as it fell back below the trendline and is now testing it as resistance once again and is currently being rejected. A Fibonacci retrace shows the 0.786 fib level also lines up with this area giving added confluence, as well as RSI divergence that I have highlighted. Massive Massive resistance in this area and so much room for potential downside. I see this trade as an extremely high probability of playing out. The options market agrees with me as well.

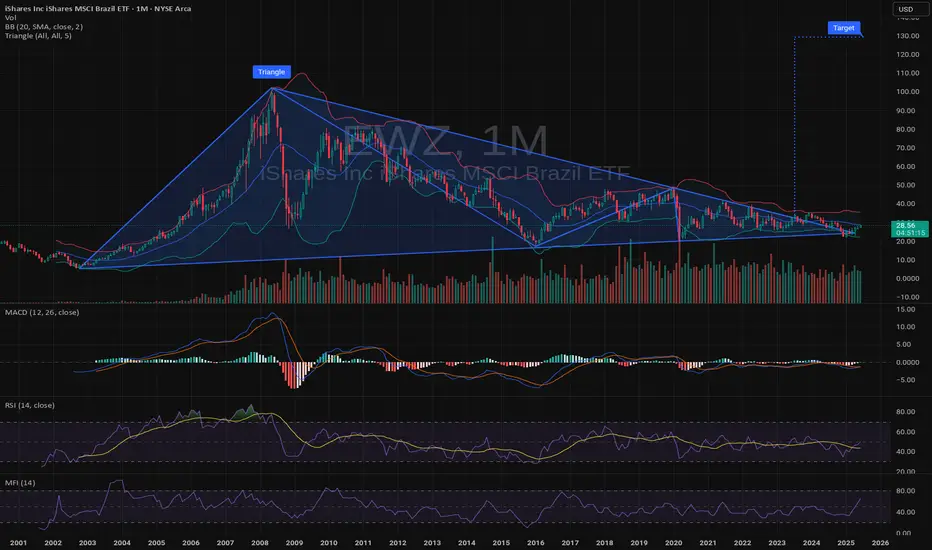
$EWZ LongAMEX:EWZ
I'm long on this. I'm long on international products in general.
I think their time is coming due.
NYSE:NU is a big component of $EWZ. So I get a bit of it as well as other parts.
Of course the charts are just Pictures and may or may not go in the direction as intended.
cheers