SPY: Bearish Continuation is Expected! Here is Why:
Looking at the chart of SPY right now we are seeing some interesting price action on the lower timeframes. Thus a local move down seems to be quite likely.
Disclosure: I am part of Trade Nation's Influencer program and receive a monthly fee for using their TradingView charts in my analysis.
❤️ Please, support our work with like & comment! ❤️
ETF market

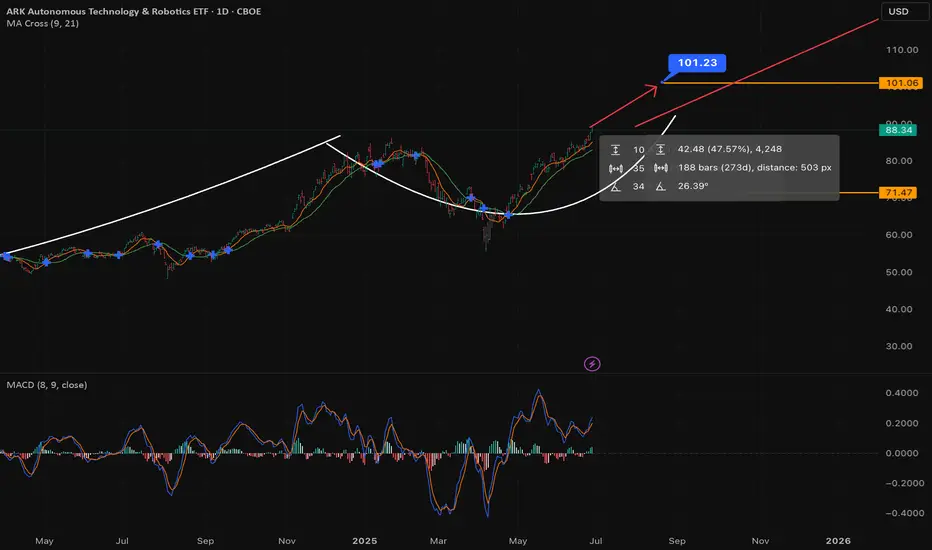
101 Next stop - ARKQ Cathy is HappyLet's analyze the ARK Autonomous Technology & Robotics ETF (ARKQ) with a focus on a "giant cup and handle" pattern and the MACD (8,13).
As of Friday, June 27, 2025, at 10:26:18 PM PDT, here's a breakdown of ARKQ:
**Current Price & Performance:**
* **Last Price:** $88.34 (as of 4:00 PM ET on June 27, 2025)
* **Today's Change:** Up $0.55 (0.63%)
* **Previous Close:** $87.79
* **Today's Range:** $87.59 - $89.15
* **52-Week Range:** $48.25 - $89.15 (Today's high is the 52-week high for ARKQ, indicating a strong recent upward movement.)
---
### **Giant Cup and Handle Forming**
A "Cup and Handle" is a bullish continuation pattern that typically forms over several months to over a year, making a "giant" one a long-term pattern.
* **The "Cup":** A "U" shaped formation where the price declines, bottoms out, and then rises back to approximately the original level. The ideal cup has a smooth, rounded bottom (not a sharp "V").
* **The "Handle":** A smaller, shorter consolidation pattern that forms on the right side of the cup, typically with a slight downward drift, often resembling a flag or pennant. It should generally form in the top half of the cup.
* **Breakout:** A decisive move above the resistance level created by the top of the cup and handle, on increased volume, confirms the pattern.
**ARKQ and the Giant Cup and Handle:**
ARKQ, like many growth and tech-focused ETFs, experienced a significant bull run into late 2021/early 2022, followed by a substantial pullback throughout 2022. It then began a recovery phase in late 2022/early 2023.
* **The "Cup":** This pattern would likely be formed by ARKQ's peak in late 2021/early 2022 (around $90-$100), the subsequent decline through 2022 to its lows (around $30-$40), and the long, sustained recovery back towards its previous highs. This entire multi-year U-shaped recovery would constitute the "giant cup." Its recent move to a 52-week high of $89.15 suggests it has almost completed the right side of this cup, nearing the "rim" or previous high.
* **The "Handle":** The "handle" would be a more recent, shorter consolidation that forms as ARKQ approaches that previous high. If ARKQ has been consolidating sideways or with a slight downward drift in the last few weeks or months (e.g., after hitting highs in the $80s and pulling back slightly before pushing higher again today), that could be the "handle" in formation.
**Confirmation:**
For this "giant cup and handle" to be confirmed, ARKQ would need to:
1. **Clearly form a handle:** A distinct period of consolidation (a few weeks to a few months) following the completion of the cup's right side, typically with decreasing volume.
2. **Breakout:** A decisive move above the "rim" of the cup (the previous high, which is also the 52-week high of $89.15, or even higher, if considering a very long-term cup from earlier all-time highs), on strong, increasing volume.
**Significance:** A giant cup and handle, when confirmed, is a powerful bullish continuation pattern. The price target is typically measured by the depth of the cup projected upwards from the breakout point. Given the depth of ARKQ's potential cup (from highs around $90-$100 to lows around $30-$40), the projected upside could be substantial, potentially indicating new all-time highs well beyond its current range.
---
### **MACD (Moving Average Convergence Divergence) (8,13)**
You've requested custom MACD settings (8,13). This makes the indicator more sensitive to recent price movements compared to the standard (12,26) settings.
* **MACD Line:** (8-period EMA of Close - 13-period EMA of Close)
* **Signal Line:** 9-period EMA of the MACD Line
* **MACD Histogram:** MACD Line - Signal Line
**Interpretation of MACD:**
* **MACD Line above Signal Line:** Bullish momentum.
* **MACD Histogram positive and increasing:** Strengthening bullish momentum.
* **MACD Line below Signal Line:** Bearish momentum.
* **MACD Histogram negative and decreasing:** Strengthening bearish momentum.
**Current ARKQ MACD (8,13) State:**
ARKQ has recently reached a new 52-week high, indicative of strong upward momentum.
* It's highly probable that the **MACD Line (8,13) is currently above its Signal Line**. This indicates **bullish momentum**.
* The **MACD Histogram is likely positive**, and given today's slight gain to a new 52-week high, it might still be increasing or holding strong, showing sustained buying pressure.
**Confluence:**
A strong, positive MACD (8,13) would provide bullish confirmation for the potential cup and handle pattern. If the MACD maintains its bullish stance as the handle forms (perhaps showing a slight cooling during the handle's drift but staying positive), and then accelerates again on a breakout, it would be a very strong signal.
---
### **Overall Outlook for ARKQ:**
ARKQ is showing compelling technical formations.
* The **"giant cup and handle" pattern** appears to be in an advanced stage, with the ETF having completed much of the "cup" by nearing its previous multi-year highs. The formation of the "handle" now becomes critical. If it forms constructively and leads to a breakout, it signals a significant bullish continuation with substantial upside potential.
* The **MACD (8,13)** is likely confirming the recent bullish momentum, with the MACD line above its signal line and a positive histogram. This supports the idea that buying pressure remains strong.
**Considerations:**
* **ETF Holdings:** ARKQ is an actively managed ETF. Its performance is tied to the performance of its underlying holdings in autonomous technology and robotics. Understanding the outlook for these sectors is crucial.
* **Volume:** As with any chart pattern, volume confirmation is key. Strong volume on a breakout from the "handle" would lend significant credibility to the pattern.
* **Risk:** While the cup and handle is bullish, no pattern is guaranteed. Monitor for potential failures of the pattern (e.g., breakdown below the handle's support).
This analysis is based on your provided pattern and indicator, combined with current market data. It is not financial advice. Always conduct your own thorough fundamental and technical research and consult with a qualified financial advisor before making any investment decisions.
SP500: Wave Estimation via FibsRegularities
Common angle
To estimate where it's heading to we use those recursive patterns and map them through fib scaling. Overall systematic wave expands in similar geometric narrative but with a compressed cycle.

Msty bullish trend starting to take shapeMsty has a monthy Dividend and takes a typical dip just after the dividend declaration (the yellow vertical line). A support area is forming and a big bullish engulfing (or gap up) candle would be the bullish sign to watch for. As this ETF follows the “MSTR” STOCK, both show similar structure with pre bull run clues.

Rhythm of the Great BearUndead Bear Captain's Log
April 27, 2025
Will make one final attempt to chart and navigate the murky waters of the Great Bear.
XLF may be a good candidate with still distinct waves, like XRT, XLRE and XHB.
All other sectors, especially SPY are skewed by tech, same-day options and basically unchartable.
I call this map the rhythm of the great bear. It is for my own use, as I like attuning to the waves of the great ocean, the beat of music or the rise and fall of civilizations.
XBI is the nascent child, XLK the moody teen, SPY the resilient adult and DJI the steady grandparent. In markets, I think it is the child that shows the way to growth and decline. XBI shows signs of the Great Bear, having stumbled through an initial decline in 2023 and crawled its way through 2 years of recovery, the so called running flat correction.
This market has thrived through over a decade of MMT, pummeled briefly by covid, only to receive the greatest injection of digital print since all of history. The little people are suffering the effects of inflation everywhere. Wages have barely budged since 20 years ago, yet housing prices have quadupled, automobiles and everything else Mom & Dad can think of have at least doubled. People are literally crumbling toward the lowest rung of Maslow's hierachy, able only to take care of basic needs.
Beneath the streets of folks struggling to survive, we can uncover that the housing market existing home sales is basically at its lowest point since the GFC and banks are still struggling to manage the bond sell-off over the last 5 years.
On top of this decade of MMT mess, the half sane President has declared cold war on basically the entire world. He points the finger of USA's problems at everyone exept USA and magically believes USA can somehow snap factories and skilled workers into existence out of thin air to make America great again without its friends, partners (and slaves). Yet 160 year East-West civilization cycles say otherwise. In fact it points to power eventually returning to the Eastern world.
The sudden viscious market decline followed by Trump backpedalling and market rebound are strong signs of an initial wave 1, wave 2. It can wake up the bear. It can thunder the quake. It can bring on the tsunami where 15-25 such waves can arrive at an unimaginable velocity.
When such waves arrive, what is any man, woman, child to do? Who can ride such waves without a chart? The waters will flip ships, smash hulls, rip entire masts off of galleons.
Yet, with a proper chart, one could ride it like a pirate and secure the ONE PIECE.
Arr, arr, I sail into the storm, full of courage, a wee bit of wit, and an insane amount of folly!!!
Arr, arr, this be the end of the captain's log.

Bullish Swing Trade - SOXLHey all -
Sharing my mid-term analysis of SOXL. We've reached buy levels on the daily, weekly, and monthly charts.
Ideal entry between $16.46 - $18.12.
With patience, swing up to the $25-31 dollar area. Specifically for options, I'd suggest an August expiry, with an ITM or ATM strike price.
Happy Trading!

We touched 15.30 and need to stay above itThis channel is not providing individualized trading or investment advice, nor is it a banking service, brokerage service, trading service, investment service or money management service

IBIT – Bull Flag + Trend-Based Fib Targets Lined Up🔍 Price Action Setup
IBIT is forming a tight bull flag just beneath key resistance at $64 after a strong impulsive move off the $42.75 base. Structure remains bullish with price holding above the 20 EMA, and volume compression setting the stage for a breakout.
📈 Trend-Based Fibonacci Extensions
If this flag breaks, here's how the upside unfolds based on the trend-based Fib extension:
1.27 – $82.50
1.382 – $85.75 (Measured Move Target)
1.50 – $89.50
1.618 – $93.00 (Full Extension)
These levels align with the prior flagpole projection and market structure above. If bulls step in on volume, $85.75 becomes the logical first destination.
🌊 ETF Inflows Confirm the Narrative
IBIT has pulled in roughly $3.3B in recent inflows, leading the pack during a 12-day net inflow streak across spot Bitcoin ETFs. Institutions are clearly still positioning, and that's reflected in the tape. Tuesday alone brought $436M+ into spot Bitcoin ETFs.
₿ BTC Leading the Way
Bitcoin is holding strong above prior resistance and pushing higher. IBIT looks like it’s just waiting on a breakout confirmation to follow.
📌 Key Trade Levels
Breakout Trigger: Close above $64
Target Zone: $85.75 first, then extended to $93.00
Invalidation: Break below $56 structure
—
🧠 This is not financial advice — just a look at structure and flow through the DC Trading lens.
📲 Follow the journey on IG: @dc_trading_journey

War is a Racket | DFEN | Long at $28.00The war machine keeps turning. Profits will reign. Direxion Aerospace and Defense 3x AMEX:DFEN never fully recovered from pandemic lows, but world peace is (unfortunately) far from reach. The uptrend in the chart has commenced. Personal entry point at $28.00.
Target #1 = $37.00
Target #2 = $50.00
Target #3 = $64.00

June 27th, 2025 - Morning BriefFriday, June 27, 2025. Markets are on the edge, and if you thought summer would bring calm, think again. Today’s script is pure adrenaline.
Overnight, the U.S. and China finally inked a trade deal that actually matters: tariffs are coming down, and rare earths are flowing again. Tech and manufacturing stocks are already celebrating, with SP:SPX and CME_MINI:NQ1! futures inching toward fresh record highs. NASDAQ:NVDA is still the market’s favorite lottery ticket, hitting another all-time high. Meanwhile, NYSE:NKE just spiked 10% premarket after beating earnings. Never mind the $1 billion tariff punch, they’ll “manage it.” Sure.
But the real show is the May PCE inflation data dropping this morning. The Fed’s favorite gauge is expected to tick up to 2.3% year-over-year, with core PCE at 2.6%. If the numbers surprise, brace for whiplash in rates and risk assets. GDP’s third estimate confirmed a -0.5% contraction in Q1, so the “soft landing” crowd is sweating. Jobless claims and new home sales hit at 10:00 AM ET. Expect every algo on the Street to be watching.
Trump is making noise about firing Powell before 2026, which has traders betting on earlier rate cuts. If you’re looking for stability, you’re in the wrong casino.
Here’s where things stand:
- OANDA:XAUUSD : $3,280–$3,334/oz (slipping as risk appetite returns)
- BLACKBULL:WTI : $65.64–$65.82/barrel (steady, but one headline away from chaos)
- BINANCE:BTCUSDT : $107,215–$107,477 (down, but still a six-figure fever dream)
- CME_MINI:ES1! : Hovering just below the 6,144 record
Today’s takeaway: The market’s running on hope, caffeine, and denial. Stay sharp, one bad print and the rally could turn into a stampede for the exits. Welcome to the volatility vortex.
Been building something for US swing traders — if you’re one, I’d really appreciate your feedback. Free to test, link in Bio

Nightly $SPY / $SPX Scenarios for June 27, 2025🔮 Nightly AMEX:SPY / SP:SPX Scenarios for June 27, 2025 🔮
🌍 Market-Moving News 🌍
📉 Global Markets Bet on Dovish Fed Pivot
Markets are pricing in more aggressive Federal Reserve rate cuts—approximately 125 bps by end-2026—due to speculation that President Trump may replace Chair Powell with a dovish successor. Investors caution excessive political influence could jeopardize Fed independence
🏦 Fed Governor Warns of Tariff Risks
Fed’s Michael Barr emphasized that tariffs could trigger inflation and unemployment, reinforcing the Fed’s wait‑and‑see approach. Expect modest rate cuts later this year, contingent on economic signals
📉 Q1 GDP Revised Sharply Lower
First-quarter U.S. GDP was downgraded to an annualized contraction of 0.5%, a deeper fall than previously reported. The revision underscores drag from weak consumer spending and trade disruptions
📃 Trade Deficit Widens in May
U.S. goods trade deficit expanded 11% to $96.6 billion, driven by a $9.7 billion drop in exports. Trade gap dynamics remain a headwind for growth projections
🐘 JPMorgan Sees Stagflation Risks
JPMorgan revised its U.S. GDP growth forecast down to 1.3%, warning that tariff-related “stagflationary impulse” is complicating growth and inflation outlooks—and making recession risks more real
📊 Key Data Releases 📊
📅 Friday, June 27:
8:30 AM ET – U. of Michigan Consumer Sentiment – June (Prelim.)
Expected to reflect growing economic caution. The index fell in May; traders will watch for further weakness.
10:00 AM ET – Fed Stress Test Results
Fed to release annual bank stress-test outcomes. Strong results support financial stability, while weak spots could unsettle markets
⚠️ Disclaimer:
This information is for educational and informational purposes only and should not be construed as financial advice. Always consult a licensed financial advisor before making investment decisions.
📌 #trading #stockmarket #economy #Fed #inflation #macro #charting #technicalanalysis

Chart Pattern Analysis Of MSTZ
From K1 to K3,
It is a bullish three soldiers advancing pattern,
But unfortunately, it still failed to close upon a nearest resistance.
K3 start with a bull gap and break up a downtrend line of a large scale consolidation range.
If the following candles break up the resistance or consolidate around it,
It will be a good place to buy it there.
On the other hand,
If the following candles successfully retest the downtrend line,
It is also a good place to buy it then.
Long-4.75/Stop-4.35/Target-10

SPY Prediction (with 10% conviction)Now that we are at ATH, whats going to happen next?
Superimposition of 2018 bear market over today's timeline shows we rally to $625 after which we get a correction to $573. Rally continues onwards until we get another plandemic🤞
In 2018 we had tariffs 1.0 in addition to FED QT. This time we have tariffs 2.0 (or do we?) and a confused FED which probably makes the case for the same level of FUD.
Economic and political environment changes but human behoviour does not change, altlest not like moores law.
Thank you for your attention to this matter!

Bear flag18 ema, looking to smash down ans invalidate a VIX breakout, if you bullish you want to see a bearish breakout from bear flag, if you bearish you want to see a vix breakout..
Stoch rsi showing overbought conditions with an apex around 330pm

Divergence FormingThe descending channel pattern is always my favorite. Mixed with RSI, channels aligning with gaps and volatility being at $20, its a good chemical mix.
AMEX:SOXS to $10 can happen quickly but I think the move will be sharp and quick. Long term bearish signals forming to.
Lets see where it goes!

SPYOf course when I get out of SPY it sky rockets... this has continuously happened to me while trying to build up my small account. I get in make about 5-10%, take profits, then it jumps in the direction I get into. Wild. Any suggestions?

SP500 short USD is losing its reserve currency status but I guess it is also loosing its measuring cup status as well.
While people are cheering for all time highs in USD, SP500 in CHF does not look good at all.


Triple Top on QQQAs I said some the same things for the S&P 500 . here we have QQQ . Repeating this pattern staying In this box for some time now. investment accounts , 401ks, real estate , etc etc. I see all accross the board people buying almost everything at very high prices. With no in dept look . lets try and make sense of this in market terms. The stock market is not in correlation with the economy say it with me 3 times please. now the level has been met since December 2024. and every single time we create a gap and fall from there now honestly I can see a wall of support is being built but after July please watch out from there. a lot of war money coming into the market

SPY . Market Corrections IncomingHey Guys it's been a long time but I'm going to be more consistent in publishing more. The S&P 500 has hit a level of resistance 4 times on the daily chart. which is very very telling. Yes I understand we have news and war being a major catalyst in the stock market rallying a lot lately but this is only temporary. This previous witching was last Friday if you weren't aware which also caused the small pull back. So for further bullishness to continue let's look at the earnings for the magnificent 7 and the rest of the tech sector. More war means more money for the market . we have the next witching in September . and so here are my projections. We take a step higher in July as we go into the peak of SOLAR Maximum . please do your research. and then after that by September we go into pull season . Happy trading

update on the Markets 6-26SPY may reverse today, I'm watching IWM for clues. Gold losing support as of now. Oil may come down more and then bounce again. NG is hard to read. BTC still holding below it's channel.

SPY soars to new all time highsThere has been a lot of speculation about where SPY is going next. I believe a significant correction will happen in the near future. However, today SPY is creeping back into the strong uptrend it once had. Looking at chart patterns, SPY is building momentum once more and will be hitting another yet another all time high.

What Is The Market Waiting For?Good Morning Trading Fam,
Our stock and crypto markets seem to have stalled. You may be wondering what they are waiting for. Quite simply, the S&P 500 has reached a double-top. That's all. There may be some more pause here for the next week or so. Barring any significant bearish geopolitical or other events, I expect us to move higher. Any FUD at all will send the market back down again. So yes, unfortunately, the next move(s) will be mostly predicated on news. Traders are rather fragile rn. Trade accordingly.
Best,
Stew
