$IWM Look at that moveThe bottom of the implied move today was 212, and look where we closed? 211.97. That was beautiful.
ETF market

Elliott Wave Insight: GDX Climbs Higher After Three Wave DeclineThe rally in the Gold Miners Junior ETF (GDX) from its December 30, 2024 low remains intact. This rally is unfolding as a five-wave impulse pattern, as observed on the 1-hour chart below. Wave (4) of this impulse concluded at $44.75, setting the stage for wave (5) higher. Wave (5) is currently progressing with its own impulsive subdivision. From the wave (4) low, wave ((i)) peaked at $46.70, followed by a pullback in wave ((ii)) to $45.19. The ETF then surged in wave ((iii)) to $54.62. Subsequent correction in wave ((iv)) ended at $51.12. The final leg, wave ((v)), completed at $54.73, marking the end of wave 1 in the higher degree.
Following this, GDX entered a corrective wave 2, characterized by a clear seven-swing corrective structure. From the wave 1 peak, wave ((w)) declined to $52.19. It was then followed by a recovery in wave ((x)) to $53.74. The subsequent wave ((y)) bottomed at $50.70, completing wave 2. The ETF has since bounced from the 100%–161.8% Fibonacci extension zone of $49.61–$51.18. Currently, GDX could either resume its rally to new highs or stage a three-wave bounce before a potential larger double correction. However, even if a deeper pullback occurs, the corrective nature of the decline from the wave 1 peak supports a bullish outlook, suggesting that any downturn is likely a temporary pause within an ongoing uptrend.

SP500 possible Turn Just a possibility - DJT and IWM have turned down, they often lead the moves. Gold at support and holding. Oil support is holding. Natural gas probably bounces here. BTC at channel resistance

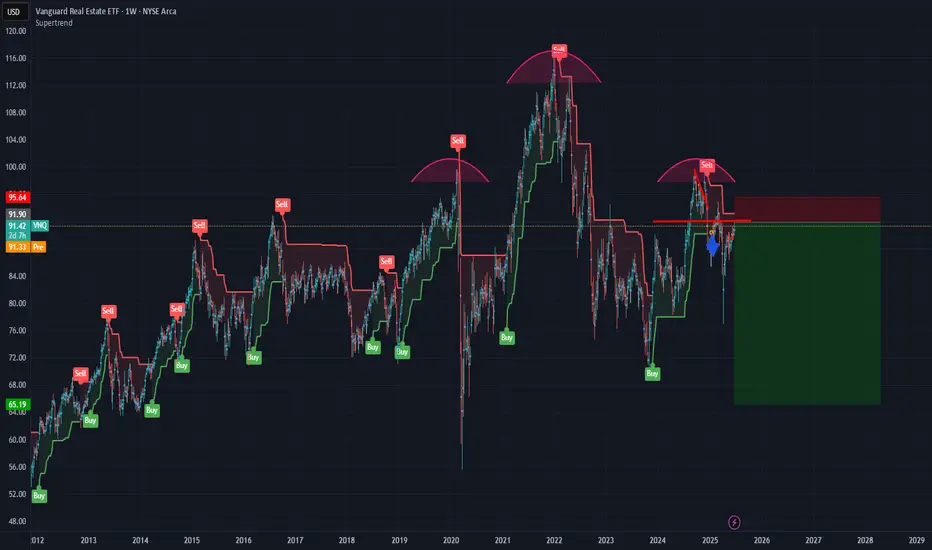
Adding DRV in this area. VNQ going downThe golden age is over. Actually I have no idea what I am doing other than throwing darts at the dart board. This trade may work, it may not.
RePOST - Weekly Technical Breakdown – Week of June 22, 2025
QQQ
Weekly Technical Breakdown – Week of June 22, 2025
After a strong rally earlier in June,
QQQ
printed a wide daily broadening formation on Friday with an outside day that expanded Thursday’s range. This pattern signals indecision and possible structural recalibration. The final minutes of trading saw significant volatility due to quad witching flows, as institutions unwound or rolled large options positions. Monday’s open will be critical to confirm whether bulls hold or if a breakdown unfolds. The short-term range is wide, with support at 525.89 and resistance near 533.66. A breakout above 533.66 opens the door to all-time highs around 536.78. On the downside, an unfilled fair value gap spans 522.70 to 520.69, which could attract price if weakness develops. Intraday traders should watch pivots at 525.89, 527.27, 528.61, and 530.45 for scalps and key reactions.
Technical Summary
• Structure: Outside day forming a wide daily broadening formation
• Friday Note: Quad witching flows in the final minutes caused order flow imbalances and aggressive re-hedging
• Daytrade Pivots: 525.89, 527.27, 528.61, and 530.45 remain active intraday reaction points
• Macro View: Clean daily close above 533.66 supports upside momentum and breakout potential
• Downside Risk: Unfilled fair value gap from 522.70 to 520.69; holding above 525.89 early week is critical
• Momentum Bias: Friday’s candle signals indecision; Monday likely to define near-term direction
Key Levels to Watch
🟢 Upside Resistance: 527.27 (reclaim level), 528.61 (mid-range pivot), 530.45 (resistance zone), 531.87 (continuation trigger), 533.66 (breakout confirmation), 536.78 (all-time high territory)
🔴 Downside Support: 525.89 (must hold early week), 524.02 (range low / breakdown trigger), 522.70 (FVG gap top), 520.69 (FVG gap bottom), 519.86 (trend support)
Trade Plan
• Hold above 525.89 to target 533+ early in the week
• Daily close above 533.66 signals potential breakout run
• Break below 524.02 shifts focus to gap fill 522.70–520.69
• Intraday scalps effective between 525.89 and 530.45
Decision Map
🟩 IF QQQ HOLDS ABOVE 525.89 → reclaim 527.27 / 528.61 → target 530.45 → 533.66 → breakout toward 536.78 (ATH)
🟥 IF QQQ BREAKS BELOW 525.89 → watch 524.02 (structure break) → target 522.70 → 520.69 (gap fill) → trend pivot 519.86
Primary Trade Zone: 525.89–530.45
Alert List for Key Levels
Set alerts above price: 527.27, 530.45, 533.66
Set alerts below price: 525.89, 524.02, 522.70, 520.69
This Week’s Key Catalysts for
QQQ
QQQ
’s price action this week will be influenced by a combination of major economic releases and Fed commentary, alongside ongoing macro and geopolitical factors impacting the tech sector.
• The most important catalyst is Fed Chair Jerome Powell’s testimony to the House Financial Services Committee on Tuesday, June 24. Powell’s remarks on the economic outlook and future rate policy could drive volatility and directional bias in
QQQ
, especially given market anticipation around possible rate cuts later this year.
• Additional Fed insights will come from Cleveland Fed President Beth Hammack’s speeches on Tuesday and Thursday, which could reinforce or add nuance to Powell’s tone.
• Inflation and economic data releases throughout the week—including durable goods orders, GDP revisions, consumer sentiment, and personal income/spending reports—will help shape market expectations for Fed policy, a major driver for growth stocks like those in $QQQ.
• The quad witching event last Friday increased short-term volatility and order flow imbalances, impacting the current technical setup.
• Longer-term geopolitical issues, including export restrictions on semiconductor technology and institutional buying trends, remain background factors but are less likely to move
QQQ
sharply this week absent new headlines.
Traders should monitor these catalysts closely and combine them with technical levels and price action to navigate the week effectively.

SPY/QQQ Plan Your Trade for 6-25 : Breakaway PatternToday's Breakaway pattern suggests the SPY/QQQ may attempt to move into another breakaway price move - very similar to yesterday's price move.
I will add that I believe the SPY cycle patterns have already moved through a breakaway phase with the ceasefire news early this week. I believe the gap and breakaway move yesterday may be the breakaway trend we are expecting today.
That would suggest the markets could pause and pullback a bit over the next few days.
Gold and Silver are trying to find a bottom after the brief selling that took place over the past few days. I really do believe Gold and Silver are poised to make a big move higher.
Bitcoin is on a terror to the upside. But be cautious of the downward cycle channel that may prompt a rollover in BTCUSD near the $107,500 level.
I spend a little time near the end of this video highlighting my work on the Tesla 3-6-9 price theory and going over a few examples for my new book on trading.
Enjoy the quick look at some of the more advanced techniques I'm working to unlock for all of you.
Get some.
#trading #research #investing #tradingalgos #tradingsignals #cycles #fibonacci #elliotwave #modelingsystems #stocks #bitcoin #btcusd #cryptos #spy #gold #nq #investing #trading #spytrading #spymarket #tradingmarket #stockmarket #silver

SOXL 1D — With a base like this, the ride’s worth itOn the daily chart of SOXL, since early March, a textbook inverse head and shoulders pattern has formed and is now in its activation phase. The left shoulder sits at $16.67, the head at $7.21, and the right shoulder at $15.11. The symmetry is classic, with volume stabilization and a narrowing range — all the elements are in place.
The key moment was the breakout through the descending daily trendline around $19.00. Price didn’t just pierce the level — it held above it, signaling a phase shift. There was an attempt to break through the 0.5 Fibonacci level at $19.60, which led to a pullback — not on heavy selling, but on decreasing volume. This wasn’t a rejection, it was a pause.
This pullback serves as a retest of the breakout zone and the 20-day moving average. The overall structure remains bullish: price stays above all key EMAs and MAs, RSI climbs past 60, and the candlestick structure is stable. Volume rises during up moves and fades during pullbacks — classic signs of reaccumulation.
The measured target from the pattern is $32.00, calculated from the head-to-neckline height projected from the breakout point. As long as price holds above $18.40, the setup remains intact. A break above $19.60 with confirmation would open the door to acceleration.
This isn’t a momentum play — it’s a setup months in the making. The structure is there, the confirmation is there, and most importantly — the price behavior makes sense. With a base like this, the ride ahead looks worth taking.

Nightly $SPY / $SPX Scenarios for June 25, 2025🔮 Nightly AMEX:SPY / SP:SPX Scenarios for June 25, 2025 🔮
🌍 Market-Moving News 🌍
💱 Dollar Slides on Middle East Ceasefire Optimism
A fragile ceasefire between Israel and Iran lifted risk sentiment across global markets. The U.S. dollar weakened, while the euro and British pound hovered near multi‑year highs
📈 Equities Near Record Highs
The S&P 500 and Nasdaq pushed toward all-time highs on June 25, supported by the Middle East truce and retreating energy prices. The S&P 500 rallied ~1.1%, with tech and discretionary sectors leading the charge
🛢 Oil & Treasuries Dip, Yield Cuts Anticipated
Oil plunged ~6% to ~$65/bbl as conflict fears eased. Softer prices plus weak consumer confidence spurred expectations of up to 60 bps in Fed rate cuts by December; Treasury yields pulled back accordingly
📉 Consumer Confidence Falls Again
The Conference Board’s index dropped to 93—the lowest level since May 2020—as concerns over tariffs and job availability weighed on households
📊 Key Data Releases 📊
📅 Wednesday, June 25:
(No major U.S. economic data scheduled)
Markets remain focused on geopolitical dynamics, Fed commentary, and next week’s PCE inflation release.
⚠️ Disclaimer:
This information is for educational and informational purposes only and should not be construed as financial advice. Always consult a licensed financial advisor before making investment decisions.
📌 #trading #stockmarket #economy #geopolitics #Fed #inflation #technicalanalysis
Nasdaq 100 (QQQ) Affirms Bullish Outlook with Five Wave RallyThe Nasdaq 100 ETF (QQQ) has continued its upward trajectory, confirming a five-wave Elliott Wave structure originating from the April 7, 2025 low. This development solidifies a bullish market outlook and eliminates the possibility of a double correction scenario. Starting from the April 7 low, wave (1) concluded at 443.14. Wave (2) pullback then followed which ended at 404.44. Subsequently, the ETF surged in wave (3) to 537.5, exhibiting an internal five-wave impulse structure. As depicted in the 1-hour chart, the wave (4) pullback unfolded as a double three Elliott Wave pattern.
From the wave (3) peak, wave W declined to 524.61, and wave X rebounded to 535.37. Last leg wave Y descended to 523.65, completing wave (4) at a higher degree. The ETF has since resumed its ascent in wave (5). From the wave (4) low, wave 1 of (5) is nearing completion, with a forthcoming wave 2 pullback expected to correct the cycle from the June 24, 2025 low before the rally resumes. This pullback should attract buyers at the 3, 7, or 11 swing levels, setting the stage for further upside potential. The bullish structure underscores confidence in continued upward momentum for QQQ.

XLE Setting Up For a Run? XLE is looking to create a new run? Possibly with that inverted hammer that we see where sellers failed. It just made a huge gap down that will need to be filled. I could see it testing the $83.41 support and resistance shelf and retracing back to the upside to close the gaps back through $86.41.
Looks like much of this can be completed in 3 months, provided the momentum trend and sentiment doesn't change. We have some cooling of the RSI and MACD along with a dividend payment that just came on June 23, 2025. So, now let's look for more upside momentum. My stop loss is around $83.41 and profit targets are $86.41 and $87.80.
As always, do your own research and due diligence. These are my views and not trading or investing advice.

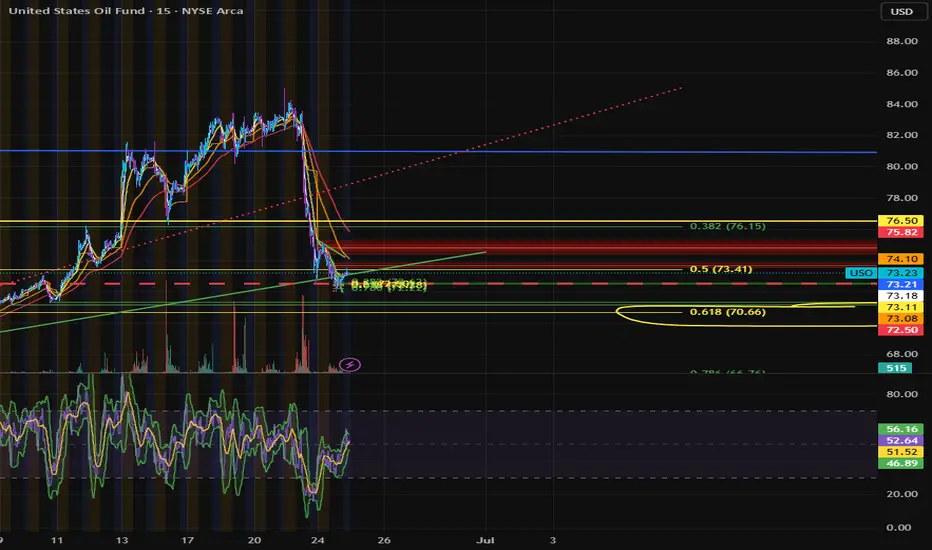
$USO Calls entered 6/24With our current geopolitical standing, the degree of the drop the 23rd-24th of June, and the direction. analysis of the SPX, I believe we have been presented with a very fruitful opportunity. We've seen a NASTY dip after what seems to be a 5 wave move up.
After drawing fib retracements, we closed the market with a small dip under the .5 retracement level. its HERE i added.
Should The indexes react to their potential "Abandoned Baby" setups, Oil should rebound.
6/24/25 - $SPY - punchbowl musings. moar upside into YE.6/24/25 :: VROCKSTAR :: pondering $SPY/M2
I'll attempt to keep this punchy.
- Moar upside into YE, but with a few bumps along the road. We're probably due for a small garden variety pullback sooner vs. later. And it should be bought, without flinching. Index options are easiest and lowest risk way to play this trend, unless u like single names like me :)
- I look at the above chart SPY/M2 (so S&P divided by M2) a lot
- The last time it grabbed my interest was earlier this yr before the market did it's lil dip, now it's grabbing my interest again since we've played out a bottom and a recovery
- I wonder... is px action going to follow '98 (door 1) or the trapdoors of '08/09 (door 2)/ '20 (door 3)/ '22 (door 4).
- I suspect it's closer to '98 (and btw had this thesis before seeing the recovery in the last two months, so it's played out)
- While any event can cause the market to reset another 20-30% from here, the problem is "we don't have this event". Clearly war (at least an escalating one, not a multi-week headline-driven one - sad as any war is) won't do it. Also the Fed is just about telling Trump to suck the long one... and even that rates might go higher, but the mkt also is either ignoring this/ or frankly- might acknowledge it and doesn't care. Also we have a consumer recession on the horizon - this is no surprise to many of us. Market still doesn't really care. So what kind of event is it?
- Well in door 2 we had a pretty gnarly set of defaults in US housing. Will this happen again? Probably not in housing, there will be pockets, yes. But these sorts of things typically don't repeat, esp with the money printer locked and loaded.
- Door 3 was a "pandemic" (quotes intended) which freaked everyone out. Well played Klaus. But doubtful that card can be re-played without also seeing the money bazooka locked and loaded.
- Door 4 was rates FINALLY seeing liftoff after over a decade. But now they're pretty restrictive. Can they get more restrictive? Sure. But will they go up another 2...3...4...%? Unlikely. Direction ultimately is probably lower *eventually*, even if there's a bit more economic pain on mainstreet.
- So door 1 is somewhat unique. The market doesn't remember that timeframe well. And it feels like tech is back in that sweetspot. Mag 7 (just use QQQ on it's IWM- small cap pair) so QQQ/IWM or even SPY/IWM (both contain similar mag 7 weightings) shows no brakes. Hard to see why I'd rather pay 15 or 20x for a small cap with mid singles growth and no margin or moat vs. say NVDA at a slight premium. You get the point. So I think we're back there.
- Does that mean we get a garden variety pullbacks here/there along the way as headlines hit? Probably. I see a lot of crazy 0dte'ing all over the place. The cheapest and probably most profitable way to play that would simply be sticking to index options, tbh. But alas, that's not a 10 or 20x ;)
- Could a consumer recession in 2H keep stonks flat or only +5-10% higher capped until we can see "beyond"? Maybe. But remember, the big leaders (most Mag 7) are B2B and AI-driven. So you can paint an earnings story (lower costs b/c of tech) even if the top-lines are challenged. Again, let's see.
- Alas people have been DM'ing me "WHY ARE YOU SHORT?"
- Simply put, I have conviction in a very few number of things right now on the long side. I do think the market will tend to see higher highs, and there's not an obvious reason why that ends, just yet. And the market needs a reason to go down, not up.
- However, a lot of ETFs I've found to short are offering me ATM exposure for 5-10x leverage for very very little premium (low IV) relative to picking and banging my head causing brain damage to keep identifying the single names. Most of these ETFs own "the same company" which all trade correlation 1... so in any garden variety pullback, they will all trade v similarly and so I'd rather just pay less for the hedge.
- Therefore I remain with high BTC exposure (vis a vis OTC:OBTC ) at nearly 50% of my book. I think this converts to ETF in the next 90 days, giving me another 10-12% pop (as it's 88-90% discount to spot). Therefore, I can pack just a 1.4% IBIT ATM short (vis a vis puts) for nearly half this exposure. If BTC runs, as I expect, but can't predict exactly (EVEN IF THE CONVERT DOESN'T HAPPEN), I lose the 1.4% but probably pick up a solid 10...15...20% on this OBTC exposure. Seems like a good hedge.
- Same thing for BUG, ROBT, UFO... IV is just low. These are all correlation 1 baskets. They let me offset my NXT and GAMB size. That's all. I'm not calling "SHORT IT ALL" but rather, if things keep running "yes" i'll make less... but I believe my long exposure OBTC/ NXT and GAMB will outrun these ETFs. And even if they are similar in px action... I'll just make less, but it will still be positive.
- Now if the market really does puke 10-15 or 20%... I'll take these shorts and just deploy across all the work on single names I like. V likely the usual suspects are the one's I've written about and I'd size these up. King among them will be BTC.
Hope that helps. I like looking at this chart. Perhaps you have one that catches your attention too... that allows us a glimpse around what inning we're in.
The TL;DR is I think we're in inning 7 of this multi-decade run. I'd guess a true top gets put in in the coming years. But unlikely this year. And I'd be surprised if we retest the Mar/ Apr lows. Dips of the 5-10% size should be bought aggressively, not feared.
Alas who knows. I don't have a crystal ball.
V

Give It The Gas
I've got a long Idea for the Henry Hub Natural Gas ETF, UNG.
After rising in late-2024/early-2025, UNG fell again (Mar-Jun), but recently (significantly) crossed above the trendline from that down move.
Time to look for a long position. But UNG is volatile - to reduce risk it's best to pick it up after a minor pullback. That seems to be happening now.
One thing I find useful when looking at an ETF backed by a commodity is to look at the chart for the underlying commodity future.
To be clear, I am NOT trading the future, only looking to it for (more) guidance.
In this case, for UNG, I chose the Aug Henry Hub Natural Gas contract (NGQ2025), which TradingView provides 10-minute delayed date for;
Here we see the trendline (light blue) is even stronger (i.e., more points of contact). In addition, the contract made a series of slightly higher lows (yellow line) before breaking through strong resistance at ~3.82 (a level which may now be providing support). Trendline breaks alone can be very flighty - they often don't work - so it helps to have other supporting factors (e.g., higher lows preceding, strong resistance breaks). And, not shown here but useful, UNG/NG is not overbought on the daily chart.
Now one could take a long position here, with a stop below the trendline, but I prefer my knives to at least slow down before I catch them.
Looking at the 4-hour chart for a reversal to enter;
A reversal and close above 3.92 would give a good entry point (using UNG), with a tighter stop at ~3.7 (or ~16.25 on UNG).
This is a "work in progress", so the actual trigger levels may change a bit. Or the whole setup could invalidate itself if the instrument(s) corrects back to at/below the trendline.
For targets, natural gas has resistance at 19.1 and again at 24.0 - best to trail a stop as UNG's price rises, bringing it up as each zone is hit.
For the long position, I anticipate an ITM option ~90 days out. I'm doing this in a taxable account, and for tax purposes UNG issues a K-1 to shareholders. I can do without the hassle. Option holders do not receive K-1's* (unless assigned), making tax reporting more routine.
Time to step on the gas?
*To the best of my knowledge - if any tax experts here know otherwise please drop a comment.
My ideas here on TradingView are for educational purposes only. It is NOT trading advice. I often lose money and you would be a fool to follow me blindly.

All That Glitters Is Not Gold (But Silver?)And another long Idea - this time in the Silver ETF, SLV.
Looking at the daily chart for SLV, a couple of things standout from a few days ago;
- The price just broke the all-time high at 31.80, along with significant resistance at ~31.50, and
- SLV gapped up, leaving tight stops a bit problematic.
As I've said before in this instance I do two things;
1. Wait for a pullback (which we're now seeing?), and
2. Switch to the commodity futures chart (emphasis - I'm not trading the future, just taking a look)
Using the July Silver contract on the CME;
We can see the breakout, and now the retest(s), of two critical highs from the last few months.
Switching down '1' interval, to the 4-hour chart;
We can see 3-4 retests of those old highs, which now may be acting as support. I've drawn in a short-term trendline and resistance. A cross of that trendline and a close above 36.260 should provide a good entry point.
A stop could then be placed at 35.00 (with a close below that on the 4-hour), just below this recent turmoil.
As for targets, this scenario has SLV making new all-time highs - best to just trail and let SLV tell you where to exit.
All that glitters..
My ideas here on TradingView are for educational purposes only. It is NOT trading advice. I often lose money and you would be a fool to follow me blindly.

Market has decidedI mentioned yesterday I thought it would be either a large break up or large breakdown, it was a large break up after all. All time highs are very close, so probably this week we will get there, unless something happens overnight or tomorrow. Gold looks bearish but is holding support as of now. Oil is at support. Nat Gas lost support. BTC is in a channel and looks more bullish now that it's over 105k.

Have you noticed Gold and Silver Miners lately?No doubt you are aware of the serious run Gold made so far in 2025, and you might also be aware that Silver is catching up fast lately. But have you thought to take a look at Gold and Silver mining stocks and the ETFs that track them? As Robin might have said (but never did), "Holy prospectors Batman, these stocks are flying higher!"
It is a real question whether this trend will continue, but if it does, GDX/J SIL/J are the ETFs to watch.

Learn how to trade EOD / FOD Professional StrategyEOD /FOD is an acronym for End of Day buy or sell short entry that holds overnight and the First of Day sell the ETF or stock at Market Open. This is a strategy for experienced to Elite aka Semi-Professional Traders. Beginners need to hone skills and practice in a simulator.
Professional Traders use this strategy all the time. They rarely intraday trade aka "day trading" unless they are Sell Side Institution floor traders who do intraday trading all daylong.
EOD /FOD is a very simple, easy to learn strategy for when Buy Side Giant Dark Pools have accumulated OR have Supported the Market and the Dark Pools foot print of a rectangle that is narrow with consistent highs and lows.
TWAP Dark Pool orders trigger at a low price or lower and usually move price minimally. When in Support the Market mode. The run up is a long white candle.
TWAPs are automated Time Weighted At Average Price. These orders ping at a specific time and buy in accumulation mode. If the stock price suddenly moves up beyond the high range of the TWAP, then the orders pause or halt.
Then pro traders do nudges and runs are instigated by either Gap Ups by HFTs, OR smaller funds VWAP ORDERS, or MEME's or other large groups of retail traders all trading and entering orders in sync or as close to sync as possible to create a flood of small lots that do move price upward OR downward rapidly.
Using the EOD /FOD requires understanding of how the Dark Pools, Pro Traders and other groups react to price and what, where and when orders are automated.
When ever you see a platform trend pattern such as we have on the QQQ yesterday at close and early this morning, then the entry would have been in the last 5 minutes of yesterday's market.

Technology ETF Flirts with New HighsTechnology stocks have been coming to life recently, and some traders may expect new highs soon.
The first pattern on today’s chart of the SPDR Select Sector Technology Fund is last July’s peak around $238. As the fund retreated from that level, it began a period of underperformance. (See ratio chart in the lower study.) The weakness continued through April, when it started to outpace the broader market again.
Second is $240.84, the final price on December 6 and the highest weekly closing price ever. XLK is on track to potentially surpass that level, which could confirm a breakout.
Third, the 50-day simple moving average (SMA) is nearing a potential “golden cross” above the 200-day SMA. Is the longer-term trend turning bullish again?
Finally, price action in this fund could be important for the broader market because technology represents almost one-third of the S&P 500 index.
Standardized Performances for the ETF mentioned above:
SPDR Select Sector Technology ETF (XLK)
1-year: +9.87 %
5-years: +135.69%
10-year: +432.42%
(As of May 30, 2025)
Exchange Traded Funds ("ETFs") are subject to management fees and other expenses. Before making investment decisions, investors should carefully read information found in the prospectus or summary prospectus, if available, including investment objectives, risks, charges, and expenses. Click here to find the prospectus.
Check out TradingView's The Leap competition sponsored by TradeStation.
TradeStation has, for decades, advanced the trading industry, providing access to stocks, options and futures. If you're born to trade, we could be for you. See our Overview for more.
Past performance, whether actual or indicated by historical tests of strategies, is no guarantee of future performance or success. There is a possibility that you may sustain a loss equal to or greater than your entire investment regardless of which asset class you trade (equities, options or futures); therefore, you should not invest or risk money that you cannot afford to lose. Online trading is not suitable for all investors. View the document titled Characteristics and Risks of Standardized Options at www.TradeStation.com . Before trading any asset class, customers must read the relevant risk disclosure statements on www.TradeStation.com . System access and trade placement and execution may be delayed or fail due to market volatility and volume, quote delays, system and software errors, Internet traffic, outages and other factors.
Securities and futures trading is offered to self-directed customers by TradeStation Securities, Inc., a broker-dealer registered with the Securities and Exchange Commission and a futures commission merchant licensed with the Commodity Futures Trading Commission). TradeStation Securities is a member of the Financial Industry Regulatory Authority, the National Futures Association, and a number of exchanges.
TradeStation Securities, Inc. and TradeStation Technologies, Inc. are each wholly owned subsidiaries of TradeStation Group, Inc., both operating, and providing products and services, under the TradeStation brand and trademark. When applying for, or purchasing, accounts, subscriptions, products and services, it is important that you know which company you will be dealing with. Visit www.TradeStation.com for further important information explaining what this means.

Nightly $SPY / $SPX Scenarios for June 24, 2025🔮 Nightly AMEX:SPY / SP:SPX Scenarios for June 24, 2025 🔮
🌍 Market-Moving News 🌍
🇺🇸 Markets Eye Powell Testimony & Consumer Confidence
Today brings a double dose of market-moving data: the June Consumer Confidence Index and Fed Chair Jerome Powell’s testimony before Congress. These will be key indicators of household sentiment and potential shifts in Fed rate guidance
🛢️ Oil Volatility Persists on Middle East Strain
Oil prices briefly spiked after U.S. strikes on Iran’s nuclear facilities, prompting fears of supply disruptions. However, prices have since dipped as ceasefire hopes emerge. Investors remain cautious on energy headwinds
💱 Dollar Retraces on Safe-Haven Rotation
The dollar softened after peaking as geopolitical tensions eased slightly. Still, it remains sensitive to Powell’s tone and confidence data, which could reintroduce volatility
📊 Key Data Releases & Events 📊
📅 Tuesday, June 24:
10:00 AM ET – Conference Board Consumer Confidence (June)
Monitors household optimism; a rebound could support consumer spending and equities.
10:00 AM ET – Fed Chair Powell Testimony Begins
Powell appears before the House Financial Services Committee. Market focus: inflation outlook, tariffs, and potential timing for rate cuts.
⚠️ Disclaimer:
This information is for educational and informational purposes only and should not be construed as financial advice. Always consult a licensed financial advisor before making investment decisions.
📌 #trading #stockmarket #economy #Fed #trade #energy #technicalanalysis

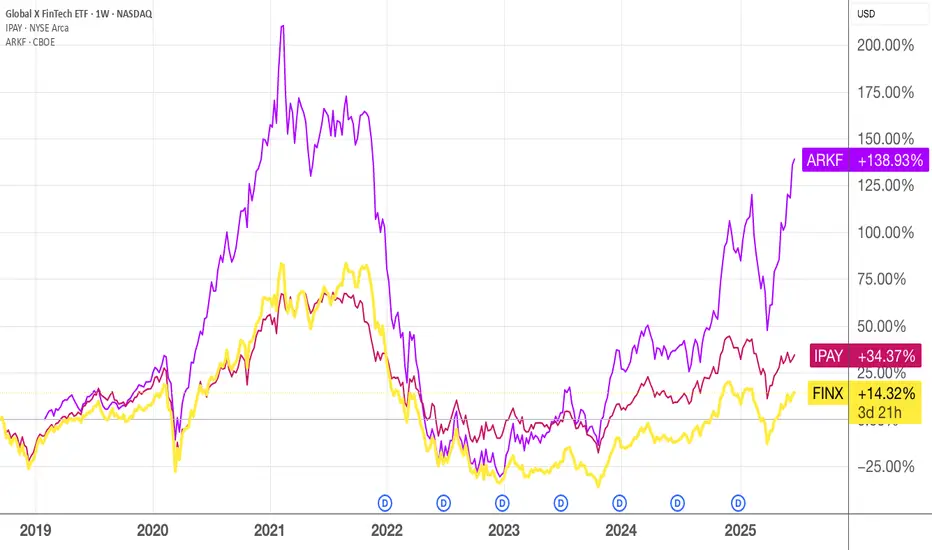
Global Paymasters - how many do you own in your portfolio?In many countries, you would have some payment processing companies with the global brand like Visa, Mastercard, Paypal dominating. In China, we have Tencent and Alibaba which I am invested in.
So, if you like the fundamentals and growth story of these payment companies, buying into the ETFs may be a good idea.
Here's three promising ETFs to consider.
SPY (S&P500 ETF) - Price Bouncing Up from Support after NewsSPY (S&P500 ETF) price has bounced up from the $593 support level after recent global news (de-escalation news).
Price action has slowed and consolidated in June 2025, and the S&P500 is still maintaining a price uptrend.
The 50EMA and 20EMA Golden Cross is still active and in progress (since May 2025).
The next stock market earnings season is not for another 3 months. Inflation, interest rate news, global events, government news, corporate news will continue to affect price volatility this summer.
Resistance Levels: $604, $610, $612, $619.
Support Levels: $600, $593, $586, $579.

SPY/QQQ Plan Your Trade For 6-23 : Afternoon UpdateWhat happened to the CRUSH pattern?
Everyone wants to know why the CRUSH pattern didn't show up today. Well, I keep telling all of you these SPY Cycle Patterns are based on GANN, Tesla and Fibonacci price structures. They do not take into consideration news, global events, or anything outside of PRICE.
They are predictive - meaning they attempt to predict potential price shapes/patterns weeks, months, and years in advance.
The markets, obviously, are seeking some normalcy after the Iran conflict. I thought the CRUSH pattern would have been a perfect fit for today - but obviously the markets didn't agree.
If you have been following my videos, you know I keep saying the US stock market is acting as a global hedge for risks. Traders are pouring capital into the US stock market as a way to avoid global risk factors.
Traders are also pouring capital into Gold/Silver. Demand for physical metals is through the roof right now.
Time will tell if my Excess Phase Peak pattern plays out as I expect or if we rally to new ATHs.
Obviously, this sideways rollover topping pattern could present a breakaway in either direction.
Again, my patterns are not correlated based on news or other events. They are strictly price-based.
Get some...
#trading #research #investing #tradingalgos #tradingsignals #cycles #fibonacci #elliotwave #modelingsystems #stocks #bitcoin #btcusd #cryptos #spy #gold #nq #investing #trading #spytrading #spymarket #tradingmarket #stockmarket #silver

Update into the closeSPY is at resistance. OIL looks like a C wave. My feeling is there could be a swift down move on SPX futures overnight. I'm wrong if we open above 602 on SPY tomorrow
