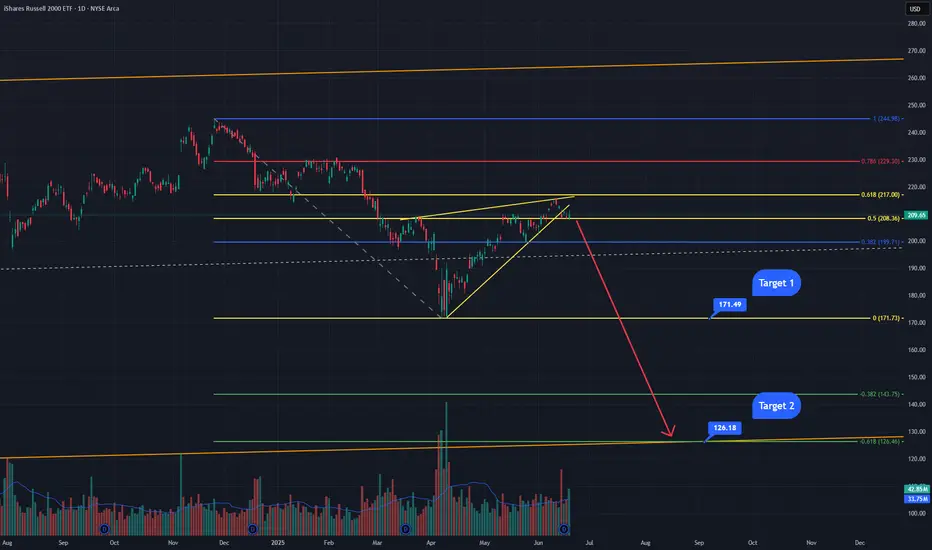
Small Caps about to get SlammedThe IWM has been trading inside this upward sloping wedge/bear flag for a few months. It just broke the bear flag this week and then tested the underside of it as resistance before getting rejected. This area also happens to be a golden pocket retracement zone from a Fibonacci I have drawn from the all-time highs made in November of last year to the lows made 2 months ago in April. The next probable move is back down to target 1 at the bottom of the Fibonacci retracement at $171. These golden pocket retracements have a very high probability of moving back down to the bottom of the retracement, sometimes breaking lower. This area at $171 has a lot of support but if it breaks, I expect it to come down to the orange line which is an upward sloping paralell channel that the IWM has been trading in since the financial crisis of 2008. The bottom of said channel connects the 2009 lows through the covid lows of 2020. This area also happens to be the -0.618 Fibonacci retracement area, it would be the 3rd hit of the bottom this major weekly channel and would very likely contain the lows for the current bear market.
ETF market
SPY/QQQ Plan Your Trade For 6-19: GAP Reversal Counter TrendToday's pattern is a GAP Reversal in Counter Trend mode. I believe this could represent a breakdown in the ES/NQ as the US stock market is closed for the Juneteenth holiday.
Obviously, after the Fed comments yesterday (stating "uncertainty") and with the continued Israel/Iran conflict playing out, it makes sense to me that the US markets would move into a pre-weekend consolidation phase.
Even though the US stock market will be closed, the futures market will likely stay open and will carry some general market sentiment and reactions to news.
Watching Gold/Silver and Bitcoin should be very interesting today. I suspect the markets will continue to consolidate downward today - leading to a potential breakdown seeking support day on Friday.
Buckle up. We'll likely have 3-5+ days of news related to the Israel/Iran conflict and other issues over this weekend. It could be very interesting to see how the global markets move through this news.
Get some.
Happy Juneteenth
#trading #research #investing #tradingalgos #tradingsignals #cycles #fibonacci #elliotwave #modelingsystems #stocks #bitcoin #btcusd #cryptos #spy #gold #nq #investing #trading #spytrading #spymarket #tradingmarket #stockmarket #silver

Semiconductors into MAJOR resistanceAs you can see from this weekly chart, the semiconductors have tried three different times to get above this trend line and have gotten rejected all three times. Could it go higher from here? Of course it could, but you have to ask yourself what are the probabilities that it will continue to go up through all this heavy resistance? Not very good is the answer. A close above last weeks candle would confirm a breakout, otherwise, bearish view remains intact.

QQQ Potential *Short Term Bearish SetupAfter studying the HTF here is what I am seeing as a potential setup forming.
We formed a HTF MSS on the 4H close to ATH leaving an epic equal high to come back to later. I am looking for a candle body closures *BELOW lows to confirm as we leave the MSS yellow zone and head to TP1 (-1). Once we approach TP2 (-2) we are entering another HTF BULLISH MSS. If this zone holds and we start seeing candle *BODY closures *ABOVE highs then my bias will no longer be bearish.

$SPY Call Credit Spread for 7/3 Expy IdeaAMEX:SPY Call Credit Spread
+1 $604 call 7/3
-1 $600 call 7/3
~$200 credit
1:1 risk:reward
Breakeven @ Expy = $602
We'll see...

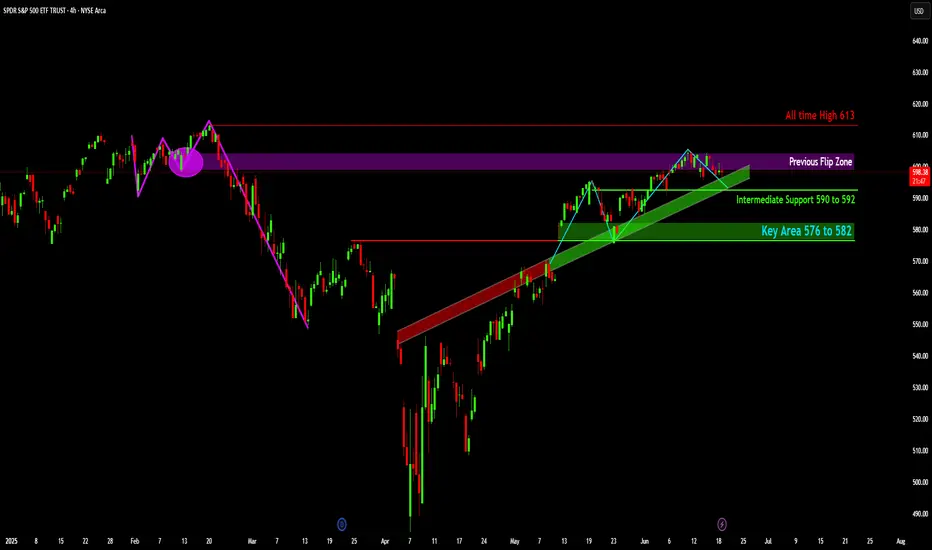
SPY: What's Next After the Resistance Retest?
The price action of SPY, shows a significant decline from early February highs, followed by a strong recovery and an established uptrend from mid-April.
Price is currently testing the "Previous Flip Zone" (indicated by the purple shaded area), a level that previously acted as support before the market's sharp decline and has since been retested as resistance.
The "All time High 613" is marked as a major overhead resistance level, representing the peak achieved before the February drawdown.
An "Intermediate Support" zone is identified between 590 and 592, coinciding with the upward-sloping green trendline that has supported the recent rally.
A "Key Area" of support is highlighted further down between 576 and 582, indicating a more substantial demand zone should the intermediate support be breached.
Disclaimer:
The information provided in this chart is for educational and informational purposes only and should not be considered as investment advice. Trading and investing involve substantial risk and are not suitable for every investor. You should carefully consider your financial situation and consult with a financial advisor before making any investment decisions. The creator of this chart does not guarantee any specific outcome or profit and is not responsible for any losses incurred as a result of using this information. Past performance is not indicative of future results. Use this information at your own risk. This chart has been created for my own improvement in Trading and Investment Analysis. Please do your own analysis before any investments.
QQQ: All-Time High Resistance vs. Strong Trendline Support• Approaching All-Time High Resistance: QQQ is currently trading directly beneath its all-time high of $541 and is encountering a robust overhead resistance zone, indicating a critical test for bullish momentum.
• Strong Ascending Trendline Support: The price action is consistently supported by a well-defined ascending trendline (green), which has successfully held on multiple tests, signaling an intact short-term bullish trend.
• Key Horizontal Support Levels: Below the current price, immediate support is identified at $522, with a more substantial "Key Area" of demand observed between $505 and $510, offering deeper potential support.
• Prior Trend Reversal Confirmed: Earlier in the chart, QQQ successfully broke above a significant descending resistance trendline (red), which had previously capped rallies, confirming a shift from a bearish to a more bullish market structure.
• Foundational Breakout Level: The $494 level, marked as a "Recent Breakout Level," now acts as a key historical resistance-turned-support, providing a foundational base for the current upward movement.
Disclaimer:
The information provided in this chart is for educational and informational purposes only and should not be considered as investment advice. Trading and investing involve substantial risk and are not suitable for every investor. You should carefully consider your financial situation and consult with a financial advisor before making any investment decisions. The creator of this chart does not guarantee any specific outcome or profit and is not responsible for any losses incurred as a result of using this information. Past performance is not indicative of future results. Use this information at your own risk. This chart has been created for my own improvement in Trading and Investment Analysis. Please do your own analysis before any investments.

QQQ Put level 513 The main reason it has been two regetetion on two levels it on a down trend for short term.
And with the wars that is Happening and the market are closed on thursday we dont know what is going to happend friday.

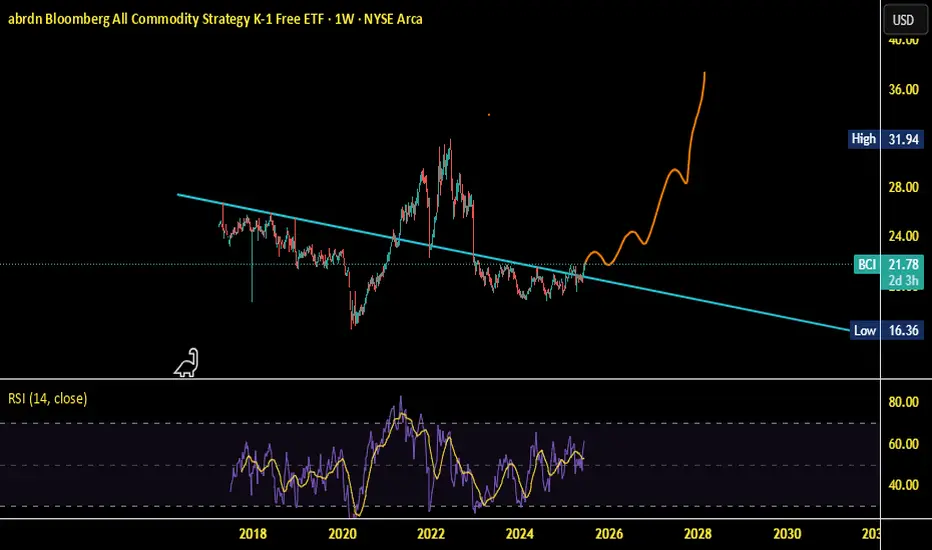
BCI Commodities Bull CycleThere is a strong supply line that is being broken by the chart, above this line there appears to be high volatility, which is also matching up with tensions in the Middle East in regards to Crude prices. Perhaps the move is equities to commodities soon.
At A Stand Still Until FOMCAll eyes on FOMC
holding 600 have to see what he says also 1st move wrong one so we want rally first

SPY/QQQ Plan Your Trade For 6-18 : GAP Potential PatternToday's GAP Potential pattern suggests the SPY/QQQ may GAP a bit higher at the open, then move into a melt-up phase, trying to identify resistance, then roll into a topping pattern and move downward.
I believe the recent "rollover" of the markets (initiating last Friday with the Israel/Iran conflict) is still dominating the markets and news related to the ongoing conflict could drive a moderate pullback in US assets.
Headed into the Juneteenth holiday (Thursday, June 19), I suggest traders prepare for the US markets to move into somewhat of a SETTLEMENT mode today - where traders don't want to hold too many open positions into Friday's trading.
Additionally, Gold and Silver could move into a very strong upward price move over the next 4-5+ days. So be prepared for metals to hedge risks when the US stock market is closed.
BTCUSD seems to be struggling into the FLAG APEX. I'm waiting to see if my FLAG count is correct and if we get the breakdown in BTCUSD as I expect.
Get some.
#trading #research #investing #tradingalgos #tradingsignals #cycles #fibonacci #elliotwave #modelingsystems #stocks #bitcoin #btcusd #cryptos #spy #gold #nq #investing #trading #spytrading #spymarket #tradingmarket #stockmarket #silver

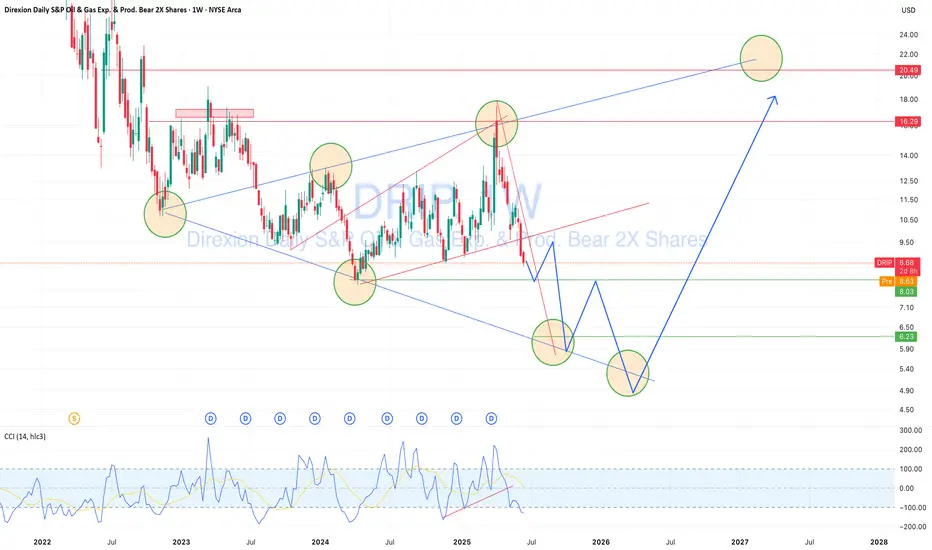
DRIP — Geopolitical Oil Risk Creates a Buying OpportunityDRIP (inverse 2x ETF on US oil & gas exploration/production) is approaching a key technical support zone.
While oil may continue rising short term due to geopolitical tensions — especially US-Iran risks and Middle East instability — this short-term pressure could push DRIP lower toward the $5.00–6.00 area. That zone aligns with strong historical reversal points and trend support. From there, a rebound toward $12.00–20.00 is technically and fundamentally possible, offering 30–50%+ profit potential. I’m planning staged entries in the marked range, managing risk with awareness of commodity market volatility and global uncertainty.
Rising Geopolitical Tension (Iran Conflict) Signals Market RiskMoving Partially to Cash (VEA, QQQ, TQQQ, SPY, TECL, SOXL)
The global market is entering a high-risk environment. Geopolitical escalation, particularly the growing threat of direct US involvement in a military conflict with Iran, is pushing global uncertainty to new highs. Tensions in the Middle East, rising oil and gold volatility, and increased friction between major world powers all point toward a potential market breakdown. On the chart, VEA ETF is showing signs of topping out within a rising wedge pattern. Meanwhile, institutional funds are starting to reduce exposure to high-risk assets. I'm taking partial profits and shifting to cash across VEA, QQQ, TQQQ, SPY, SOXL, and TECL to preserve gains. Buy-back zones are set around 53.00, 48.00, and 44.00. In an environment of global escalation and rapid risk-off sentiment, active portfolio defense is more important than passive hope.

Trading the VIX – Part 2Trading the VIX – Part 2: VIX ETPs and Strategic Applications
In Part 1 of this series, we explored the structure of VIX Futures, focusing on the roll-down effect in a contango VIX futures curve—common in calm market conditions.
In Part 2, we turn our attention to VIX-related Exchange-Traded Products (ETPs)—specifically, the popular and liquid:
• VXX – unleveraged long VIX ETP
• UVXY – leveraged long VIX ETP
• SVXY – inverse VIX ETP
Each of these products is based on a specific VIX futures strategy, the “S&P500 VIX Short Term Futures Index” , which is maintained by S&P, Dow Jones (the “SPDJ-Index”). The Fact Sheet and Methodology can be obtained from the S&P Global website.
What is the SPDJ Index that these ETPs track?
The SPDJ-Index is a strategy index that maintains a rolling long position in the first- and second-month VIX futures to maintain a constant 30-day weighted average maturity.
Key Features of the SPDJ Index:
• Starts with 100% exposure to VX1 (the front-month future) when it’s 30 days from expiration.
• Gradually it rolls from VX1 to VX2 (next-month future) each day to maintain a 30-day average expiration.
• At all times, the index is long either one or both VX1 and VX2, with exposure shifting daily from VX1 to VX2.
• This roll mechanism causes value erosion in contango (normal markets) and gains in backwardation (during volatility spikes).
• Since contango is the dominant market state, the index loses value over time—with occasional short-lived gains during sharp volatility increases.
Importantly, the SPDJ Index does not represent the VIX or any other volatility level, it simply reflects the value of this futures-based rolling strategy.
________________________________________
Breakdown of the ETPs: VXX, UVXY, and SVXY
VXX – Long SPDJ Index (1x)
• Tracks the SPDJ Index directly
• Suffers from the roll-down drag in contango environments.
• Useful only for short-term exposure during expected volatility spikes.
• Timing for long positions is critical
UVXY – Leveraged Long (Currently +1.5x)
• Replicates a strategy that maintains a constant leverage of 1.5 to the SPDJ Index.
• Formerly +2x leverage; reduced in April 2024.
• Highly sensitive to VIX moves; underperforms long term due to both roll-down drag and leverage decay (see below). Timing for long positions is even more important than for the VXX.
SVXY – Inverse (-0.5x)
• Replicates a strategy that maintains a constant exposure of -0.5 to the SPDJ Index.
• Benefits from falling VIX levels as well as from contango in the front part of the VIX futures curve.
• Formerly -1x before the Feb 2018 volatility spike triggered massive losses (XIV, a competing ETP, collapsed at that time).
• Performs well in calm conditions but is vulnerable to sharp volatility spikes.
Leveraged & Inverse ETPs – Important Notes affecting the UVXY and SVXY (without going into details):
• Daily resetting for the replicating strategies to maintain constant exposure factors (different from 1x) are pro-cyclical and can cause compounding errors, specifically in turbulent markets (e.g. Feb 2018).
• The real volatility of the VIX futures itself acts as a drag on returns, independent of the index’s direction.
• Risk management is essential—especially with inverse products like SVXY.
All three of these ETPs track a VIX futures strategy, they are not levered or unlevered versions of the original VIX index. Each of these ETPs benefits from liquid option markets, enhancing the toolkit for volatility trading.
Trading Strategies Using VIX ETPs
Here are several practical approaches to trading these products:
VXX and UVXY
• Best used for short-term trades aiming to capture volatility spikes.
• Options strategies such as zero-cost collars, vertical and calendar spreads can help mitigate the challenge of precise timing.
• Avoid long-term holds due to erosion from roll-down and leverage decay (see historical performance!).
SVXY – The Carry Trade Proxy
• Ideal for profiting from prolonged calm periods and the contango structure.
• Acts like a carry trade, offering a positive drift—but must be paired with robust stop-loss rules or exit strategy to guard against sharp spikes in volatility.
Switching Strategies
• Tactically rotate in/out of SVXY based on short-term volatility indicators.
• One common signal: VIX9D crossing above or below VIX, i.e. long SVXY if VIX9D crosses under VIX, staying long while VIX9D < VIX, closing long SVXY position when VIX9D crosses over VIX. Some traders also use crossovers with VIX3M or the individual expirations of the VIX futures curve to manage entries.
• Switching between SVXY and VXX based on crossover triggers through the VIX futures curve is often advertised, but very hard to get working in practice due to the importance of timing the VXX entry and exit – signals from the VIX curve may not signal VXX entries and exits timely enough.
Term Structure-Based Combinations
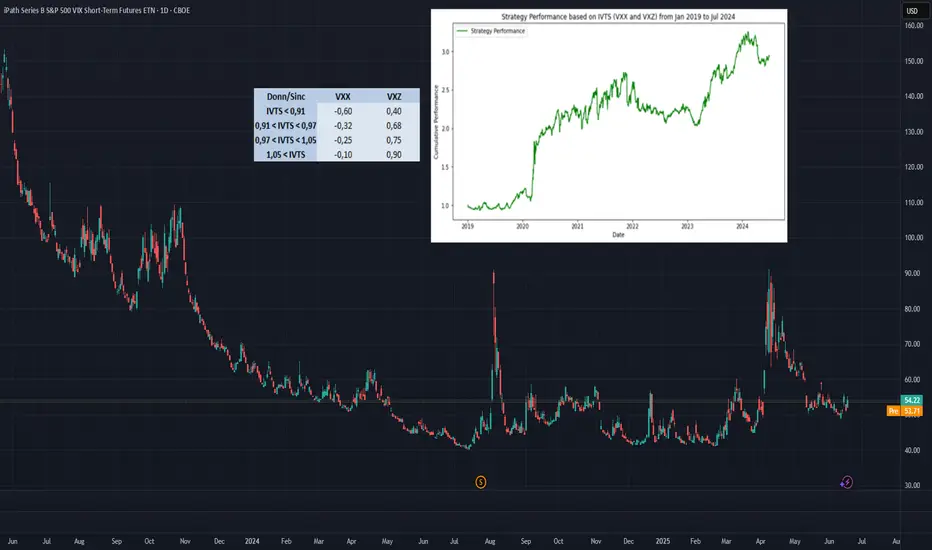
• Combine short VXX with long VXZ (an ETP tracking longer-dated VIX futures, balancing the 4th to 7th VIX contracts to achieve a constant expiration of 60days).
• Weighting is determined by the Implied Volatility Term Structure (IVTS), calculated as VIX / VIX3M. This approach adjusts positions based on the shape of the VIX futures curve, indicated by the IVTS. For instance, when the VIX futures curve shifts from contango (where near-term futures are cheaper than longer-term ones) to backwardation (where near-term futures are more expensive), it involves reducing short positions in VXX and increasing long positions in VXZ.
• This approach mimics the spirit of a calendar spread strategy in VIX futures and reflects the “S&P 500 Dynamic VIX Futures Index” , with weightings backed by research from Donninger (2011) and Sinclair (2013) - see performance chart and weighting-matrix enclosed in the introductory chart).
________________________________________
VIX Curves as Market Indicators
Beyond trading, VIX instruments and their term structure are widely used as market sentiment gauges. For instance:
Signs of Market Calm:
• VIX9D < VIX
• VIX < VIX3M
• VIX < VX1
• VX1 < VX2
These relationships imply that short-term volatility is lower than longer-term expectations, indicating near-term calmness in markets, occasionally leading to market complacency.
Traders and institutions use these signals to:
• Adjust positioning in broad market indices
• Determine hedging requirements
• Evaluate suitability of selling naked options
________________________________________
Final Thoughts
VIX ETPs offer a powerful toolkit for traders seeking to profit from or hedge against volatility. But they come with structural decay, leverage dynamics, and curve risk. Timing, strategy, and risk control are key.
Buy Silver ETF @91Buy SILVER in all dips
Can be Multibagger!!
Target1 - 101
Target2 - 118
Target3 - 150
Disclaimer :-
I am not SEBI registered. The information provided here is for education purposes only.
I will not be responsible for any of your profit/loss with this channel suggestions.
Consult your financial advisor before taking any decisions

BITx - Weekly Volatility Snapshot Good Morning -- Happy Father's day to any dad's out there!
Let's took a weekly look at CBOE:BITX -- our 2x leveraged BITSTAMP:BTCUSD fund.
Last week, we saw a beautiful gap up to the upper HV63 implied ranges were profit was taken and accelerated selling begin. Our bi-weekly trending values have increased due to the increasing volatility. The weekly candle ended with some body to it, but was mostly flat due to the gap closing with a big wick up.
Our IV (85.47%) entering the week is trending within 4% of the sliding yearly lows and seemingly increasing as it tracks near-term trending markets -- HV10 (70.04%) has increased from the movement last week +7.35% and is now +22.17% off sliding yearly lows. As the spring is uncoiling, and bi-weekly regresses towards quarterly means our premium capture erodes and our range expands. I love trading volatility and ranges.
The 'strength of IV' here for HV10 is 82% -- so you have to account when positioning that the trending near-term volatility IS INCREASING but IS WEAKER than what is predicted. The 'strength of IV' here for HV63 is 101% -- showing that what is predicted is fairly valued to me on a regression scale.
Please -- Pull my chart onto your layout and use my implied ranges and data, follow along through the week on your own screen as we track and measure the volatility -- let's get this conversation started!
CHEERS

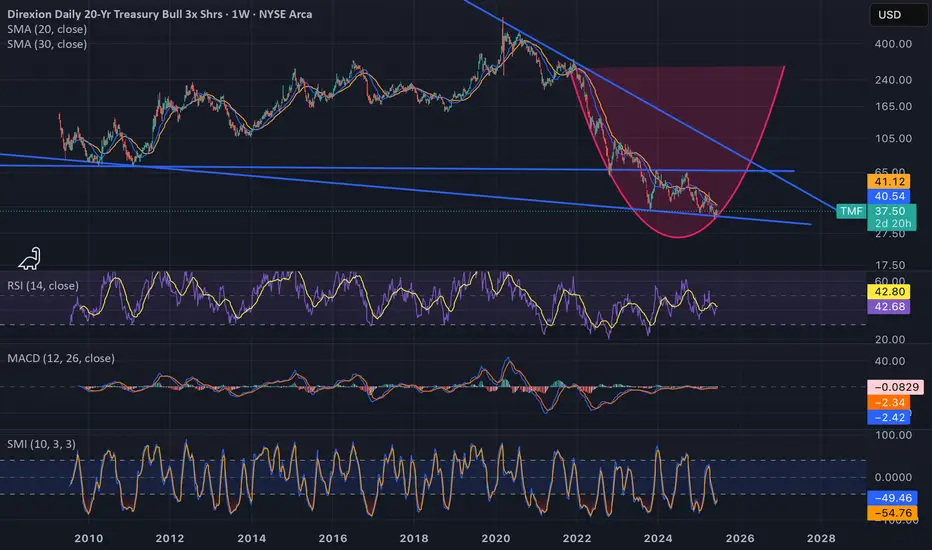
$TMF means Too Much FunIf it wasnt for politics, we would have already had a rate cut. The cut will come and when it comes, it might not be 25 bps. It may be much more because we need to catch up and the economy will be in the gutter. Enjoy the melt up but this thing will go parabolic in the next 2 years.
SPY repeating patternsSo just look at patterns that coincide with the RSI. Just keep an eye on the levels & channels & paly it smart

Bullish pattern morphing into existence for OilWhat a beautifully bullish pattern morphing into existence for crude oil !!!
With price being contained for over 3 years below that continuation breakout line, the 12 quarter moving average is squeezing, putting upwards pressure.
Oh boy, this could explode anytime soon ;-)

SMH BREAKOUT: Semiconductor ETF Explodes Higher After 13-Month VanEck Semiconductor ETF (SMH) - 1Y Chart Analysis
THE SETUP:
After 13 months of sideways chop between $180-$240, SMH has finally broken out with real conviction. This lengthy accumulation phase built a massive foundation for what could be the next major leg higher.
KEY LEVELS:
Breakout Level: $240 (now critical support)
Current Price: $261.59 (+1.79%)
Next Target: $300 (major psychological level)
Stop Loss: Below $240 breakout
WHAT HAPPENED:
Semis have been coiling throughout 2024, basically going nowhere while digesting the previous run. The break above $240 on solid volume tells me buyers are finally stepping in with size.
MY TAKE:
This looks like the real deal. 13 months is a long time to build a base, and when these sector ETFs finally break out of extended ranges, they tend to move fast. $300 is the obvious target - round numbers always matter in this game.
TRADE SETUP:
Long SMH with targets at $280 and $300. Stop below $240. The risk/reward here looks solid for swing traders who can handle the volatility.
Anyone else playing this breakout or waiting for a pullback? The semiconductor space has been dead money for over a year, so this could be the start of something bigger.
This is not financial advice. Trade at your own risk and size accordingly.

Nightly $SPY / $SPX Scenarios for June 18, 2025🔮 Nightly AMEX:SPY / SP:SPX Scenarios for June 18, 2025 🔮
🌍 Market-Moving News 🌍
💼 Business Inventories Flat in April
U.S. business inventories held steady in April, indicating stable consumer and wholesale demand. That suggests production won't need to cut sharply in the near term, supporting GDP outlook
🏭 Industrial Production Slips
Industrial output declined 0.2% in May, signaling ongoing weakness in factory activity amid less favorable global trade conditions .
🌐 Geopolitical Pressures Persist
Heightened tension in the Middle East continues to pressure risk assets. Investors remain focused on safe-haven flows into gold, Treasuries, and defensive equities, with analysts noting the risk backdrop remains tilted to the downside
📊 Key Data Releases 📊
📅 Wednesday, June 18:
8:30 AM ET – Housing Starts & Building Permits (May)
Measures new residential construction — leading indication of housing sector health.
8:30 AM ET – Initial Jobless Claims
Tracks the weekly count of new unemployment filings — useful for spotting early labor-market weakening.
2:00 PM ET – FOMC Interest Rate Decision
The Federal Reserve is expected to hold steady. Market focus will be on any commentary that hints at future tightening or easing plans.
2:30 PM ET – Fed Chair Powell Press Conference
Investors will parse Powell’s remarks for guidance on rate paths, inflation trends, and economic risks.
⚠️ Disclaimer:
This is for educational/informational purposes only and does not constitute financial advice. Consult a licensed advisor before making investment decisions.
📌 #trading #stockmarket #economy #housing #Fed #geo_risk #charting #technicalanalysis

(No) IdeaWhy the handle of "The Uncertain Trader"? Let's check the daily SPY (S&P 500 ETF) chart just after the close of 17 Jun 2025;
I've got no idea where this thing is going.
Thus the handle.
No one has any idea where this is going. If they insist they do they are selling you something. In the words of Brad Hamilton, "Learn it. Know it. Live it".
However, one must form a hypothesis to trade from, right or wrong. And TradingView has excellent tools to do so AND a FREE social network to share such theories.
Back to SPY, I have my suspicions;
SPY closed at 597.53, below it's all-time high of 611.39 (gray line and box) from Feb 19 and above it's 200 day simple moving average of 577.41 (purple line and box). Besides some support at 595.48 (arrow), which is way too close to be useful, and maybe resistance at Wed's high (also too close), there's really no other obvious support or resistance. So, it's ~14 points to the solid resistance at that significant high and ~20 points to support. If one goes long it's 20 points to be proven wrong, 14 points to the good and where the trade will likely stall - not a good reward to risk. Going short is a little better, with 20 points to support with 14 points of risk, but still a rather meager reward to risk.
And now factor in an FOMC meeting tomorrow (Wed 18th). SPY could easily hit one of those marks (2.3% up, 3.4% down), or both, tomorrow afternoon.
The (safer) play is to hold off, stay neutral, and let SPY resolve this, up or down. Let it test/hold it's all-time high or it's 200-day.
Again, I have no idea where this is going - just my theory.
And please, read the following and, again, "Learn it. Know it. Live it";
My ideas here on TradingView are for educational purposes only. It is NOT trading advice. I often lose money and you would be a fool to follow me blindly.

I'm in this trade $GME $GMEUThought process is that we see a mean reversion from here.
$6B in cash.
4710 BTC.
Profitable company.
Ryan Cohen is a financial engineer.
YOLO.
