QQQ On The Rise! BUY!
My dear friends,
My technical analysis for QQQ is below:
The market is trading on 526.92 pivot level.
Bias - Bullish
Technical Indicators: Both Super Trend & Pivot HL indicate a highly probable Bullish continuation.
Target - 530.98
About Used Indicators:
A pivot point is a technical analysis indicator, or calculations, used to determine the overall trend of the market over different time frames.
Disclosure: I am part of Trade Nation's Influencer program and receive a monthly fee for using their TradingView charts in my analysis.
———————————
WISH YOU ALL LUCK
ETF market

SPY/QQQ Plan Your Trade For 6-16 : Up-Down-Up PatternToday's Up-Down-Up Pattern suggests the markets will transition into a moderate upward trending price bar - which is quite interesting in the world we have today.
War and a big weekend of events, protests and other new items could drive market trends over the next few days.
Still, the SPY Cycle Pattern for today is an Up-Down-Up - which suggests last Thursday was an Up bar, last Friday was a Down bar, and today should be an Up bar.
The Gold/Silver pattern is a POP pattern in Counter-trend.
I believe the US markets are benefiting as a safe-haven for capital as the global turmoil drives global investors to seek safety and security for their capital.
That means as long as the world continues to spin out of control, the US markets and the US-Dollar will act as a moderate safe-haven for capital.
Gold and Silver should also benefit from this global chaos.
Bitcoin is benefiting from the strength of the US markets (and the technology sector) as well.
Let's see how this week start to play out. I'm waiting for some more news.
Could be very interesting this week.
Get some.
#trading #research #investing #tradingalgos #tradingsignals #cycles #fibonacci #elliotwave #modelingsystems #stocks #bitcoin #btcusd #cryptos #spy #gold #nq #investing #trading #spytrading #spymarket #tradingmarket #stockmarket #silver

XLP Long XLP is building liquidity below $80.76. A stop-hunt below that level, followed by a reclaim and bounce into resistance, fits a classic technical reversal pattern.
Backed by defensive fund sentiment and sector rotation news, this trade setup combines both technical edge and macro strength.
Trade Thesis: Liquidity Grab Below $80.76
Liquidity build: XLP is consolidating just below the key support level at $80.76, where stop orders likely cluster.
Hunt pattern: We expect a sharp move slightly below that level—hunting stops—followed by a quick bounce.
Post-stop recovery: After triggering the stops, XLP should reclaim $80.76, rallying into the nearby resistance zone around $82.50–$83.20.
📈 Technical Setup
Support structure:
Green zone between $79.80–$80.76 — a well-defined demand area. Prior rebounds from here signal buyers waiting to pounce.
Resistance zone:
Red area between $82.05–$82.84 — a supply zone with overhead resistance, target for profit-taking.
Expectations:
A dip below $80.76 triggers stop-loss liquidity.
A swift bounce back above $80.76 confirms reversal.
First target: mid-resistance ~ $82.05; full move towards high end (~$82.84).
🔎 Professional Observation
The chart shows classic liquidity sweep behavior: small dip, then strong reversal.
Using stop-hunt logic increases odds—institutions often design moves like this to trigger stops before reversing.

Weekly $SPY / $SPX Scenarios for June 16–20, 2025 🔮 Weekly AMEX:SPY / SP:SPX Scenarios for June 16–20, 2025 🔮
🌍 Market-Moving News 🌍
🏦 Fed Holds Rates, Powell Expresses Caution
The Federal Reserve is widely expected to keep rates at 4.25–4.50%, though Chair Powell likely won’t provide fresh guidance. Markets see limited upside without stronger inflation or growth cues
💱 Dollar Strengthens on Geopolitical Risk
The U.S. dollar rose slightly as investors flocked to safe assets amid global tensions with Iran. Treasury yields eased slightly on risk-off flows
🛢️ Oil Near Multi-Week Highs on Mideast & OPEC Dynamics
Oil held near seven-week highs (~$67–70/barrel), buoyed by Iran-Israel tensions and OPEC+ output hikes (411K bpd added from May–July), offset by demand concerns .
⚠️ G7 Summit Faces Heightened Stakes
G7 finance ministers meet in Canada under pressure from Middle East escalation. Watch for policy coordination and commentary on trade, inflation, and global economic risks .
📊 Key Data Releases & Events 📊
📅 Monday, June 16
Regular markets open after Juneteenth holiday
Quiet day; oil & geopolitical headlines dominate
📅 Tuesday, June 17
8:30 AM ET – Retail Sales (May): Signals consumer spending strength/duration
8:30 AM ET – CPI (May): Confirms inflation trend post-CPI cooler reading
10:00 AM ET – Housing Starts & Building Permits (May): Gauges housing market demand
Unexpected Tesla Robotaxi Demo (Austin): Watch for surprise developments this week
📅 Wednesday, June 18
Global Central Bank Day: FOMC, BoE, BoJ policy updates; U.S. Fed will most likely hold steady
📅 Thursday, June 19 – Juneteenth Holiday – U.S. markets closed
📅 Friday, June 20
8:30 AM ET – Existing Home Sales (May): Measures U.S. housing activity
10:00 AM ET – Leading Economic Indicators (May): Early snapshot of economic momentum
⚠️ Disclaimer:
This information is for educational and informational purposes only and should not be construed as financial advice. Always consult a licensed financial advisor before making investment decisions.
📌 #trading #stockmarket #economy #news #trendtao #charting #technicalanalysis

S&P 500 OutlookS&P closed below the 9-EMA, showing there is weakness going into next week. Starting to build my watchlist when we get the bounce. If it closes back above the 9-EMA, then I'll start to look for entries.

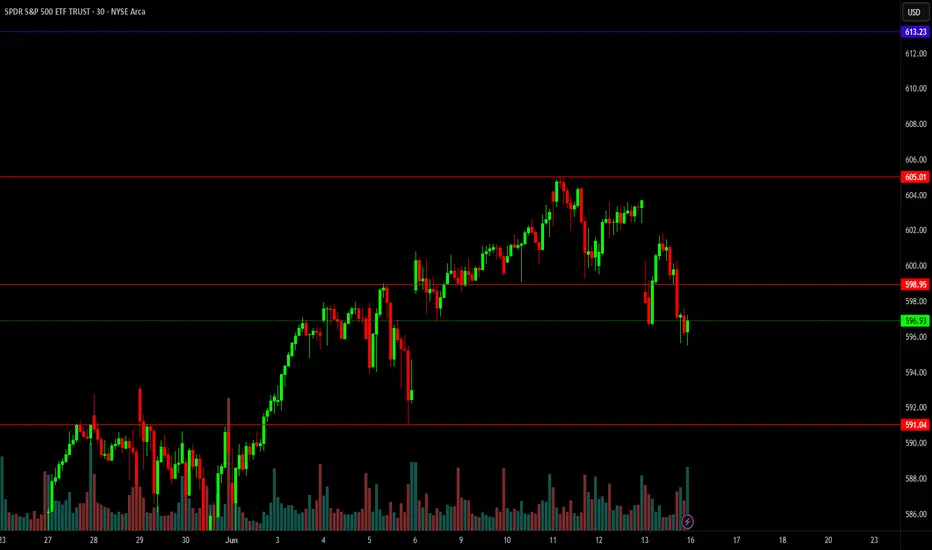
$SPY Watchlist Plan: Week of 6/17Watchlist Plan: Week of 6/17
Stock Near All-Time High
Approaching ATH at 613.23 — key pivot zone
Break and hold above: Look for calls targeting momentum continuation (e.g., 620, 630 psychological levels)
Rejection off ATH: Look for puts targeting a retracement toward 599, then 568
Retracement and Support Zones
599: Micro support on smaller timeframes (15m/1h). Watch for intraday bounce or breakdown.
568: Key downside target if rejection at ATH confirms and 599 fails. Consider swing puts toward this level.
Also monitor the 585–590 range for potential consolidation or minor support.
Game Plan Triggers
Bullish confirmation:
Clean break and hold above 613.23 with strong volume
Market-wide risk-on tone (SPY, QQQ green)
Bearish setup:
Strong rejection at or below ATH
Market-wide pullback or macro weakness (especially in tech or consumer sectors)
Catalysts
June 17 (Monday): Retail Sales Report — gauge of consumer strength
June 18 (Tuesday): Unemployment Claims — snapshot of labor market health
Strong data may fuel market optimism
Weak data could tilt market bearish
Additional Notes
Watch for volume divergence near ATH — breakout with low volume can trap longs
Use pre-market action to frame bias: gap up with follow-through = strength; gap up followed by fade = weakness
Keep an eye on VIX and bond yields for macro pressure indicators
$SPY – Bearish Momentum Meets Spiral Timing🌀 AMEX:SPY – Spiral Timing, Macro Tension, and Bearish Momentum Brewing
Not financial advice. Short-term sentiment shifted bearish.
I’ve been tracking AMEX:SPY using both Fibonacci retracements and Fib spirals across the daily and weekly timeframes, and we’re now at a critical inflection zone. My sentiment has shifted more cautiously bearish in the short term, while acknowledging upside remains intact on the longer timeframes.
🔍 Macro Backdrop: Pressure Building
CPI Data (May) came in at 2.4%, slightly higher than April’s 2.3%, but still below forecast — showing inflation is sticky but not accelerating.
Geopolitical tensions between Israel and Iran flared again over the weekend, adding risk-off pressure to already fragile sentiment.
Market volatility remains high, with trillions of dollars swinging across a narrow window — validating shorter Fib cycles and accelerated price exhaustion.
🧭 Daily Chart Analysis: December 2024 High → April 2025 Low
I used a bearish Fib retracement from the December 2024 highs to the April 2025 lows.
SPY has now retraced nearly 100% of that drop, currently hovering between the 0.786 and 0.886 retracement levels — which often act as exhaustion zones in corrective rallies.
The Fib spiral from the April low shows we’ve lost the initial vertical trendline that marked the recovery leg — a shift in momentum tone.
MACD has remained flat for 16 sessions, with a bearish divergence confirmed on Friday (6/13/25).
Momentum, which briefly turned positive on Thursday, flipped sharply back negative by week’s end.
📆 Weekly Chart Structure: March 2020 → Feb 2025
The weekly spiral, drawn from the March 2020 low to the February 2025 high, reflects a similar pattern:
→ Price is moving beyond the arc and approaching the vertical time marker, a zone where reversals or expansions often occur.
Long-term trend remains bullish, but short-term action suggests compression ahead of a possible pullback.
🔥 Spiral Interpretation Reminder:
The Fib spiral doesn’t predict direction — it identifies time-based pressure points.
When price crosses the arc or vertical band, volatility often follows.
🎯 Key Trade Levels:
Breakdown Watch:
→ Close below $595, then $587 could trigger downside toward $560 (0.618) and $545 (0.5) levels from the retracement
Breakout Watch:
→ A confirmed breakout above $609 (full retrace from the Fib) would invalidate the short-term bear thesis and resume bullish continuation
🤔 Positioning Outlook:
I’m tactically bearish here. The technicals show:
Momentum divergence
Fib exhaustion
Spiral confluence
Macro pressure mounting
I don’t think the long-term trend is broken — but we’re entering a time window for volatility, and that often brings opportunity on both sides. Short setups may offer better risk/reward right now if we see confirmation.
Would love to hear your bias here — bear trap brewing or topping process?

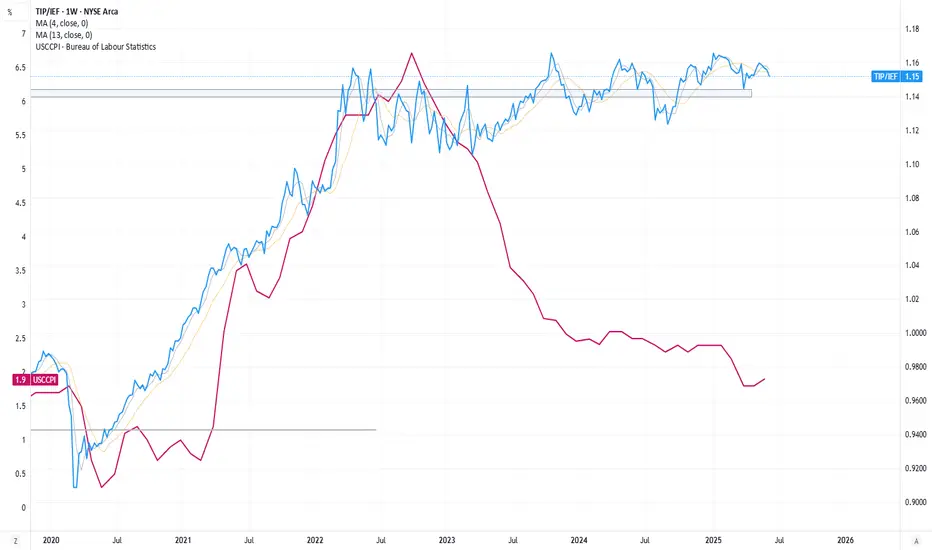
Bond Market - giving a warning sign?Typically, we would expect the TIP/IEF ratio to correlate with inflation. But that is NOT what we are seeing today. CPI is declining, but this ratio chart is implying that TLT is taking the brunt of it when compared to TIPS. This may be a warning signal that the bond market is discounting the of attractiveness of NASDAQ:TLT , whether due to expected issuance or underlying uneasiness of inflation rebounding. Worth monitoring here.
Top 10 Small-Cap Biotechs with Upcoming Catalysts for 2025Here are 10 small cap biotech stocks with notable upcoming catalysts in 2025—ranging from trial readouts and FDA decisions to pivotal data and corporate milestones:
________________________________________
🔬 Top 10 Small-Cap Biotechs with Upcoming Catalysts for 2025
1. Crinetics Pharmaceuticals (NASDAQ: CRNX)
• Catalyst: FDA PDUFA deadline for paltusotine (oral acromegaly treatment) expected by September 25, 2025.
• Focused on endocrine diseases and advancing pipeline beyond acromegaly (en.wikipedia.org).
Stock market information for Crinetics Pharmaceuticals Inc (CRNX)
• Crinetics Pharmaceuticals Inc is a equity in the USA market.
• The price is 32.33 USD currently with a change of -0.73 USD (-0.02%) from previous close.
• The latest open price was 33.1 USD and the intraday volume is 420639.
• The intraday high is 33.34 USD and the intraday low is 32.32 USD.
• The latest trade time is Wednesday, June 11, 23:45:00 +0300.
________________________________________
2. Viking Therapeutics
• Catalyst: Late-stage trial start for injectable weight-loss drug (GLP 1/GIP); mid-stage data readout for oral candidate due in 2025 (barrons.com).
• Strong analyst sentiment: Jefferies forecasts ~223% upside
________________________________________
3. Insmed (NASDAQ: INSM)
• Catalyst: Phase III/inhalable powder treprostinil palmitil for pulmonary arterial hypertension; recent results exceeded expectations; full Phase III data due in 2025
________________________________________
4. Kymera Therapeutics
• Catalyst: Phase I for KT 621 (oral STAT6 degrader for dermatitis/asthma); next-stage readouts expected late 2025–early 2026
• Shares rose ~50% on initial results; further trials underway
________________________________________
5. Arcutis Biotherapeutics (NASDAQ: ARQT)
• Catalyst: Technical breakout potential near $17.75; continued quarterly readouts with rising sales (33% last quarter)
• Upcoming investor calls/publication strategies may accelerate momentum.
________________________________________
6. Rhythm Pharmaceuticals (NASDAQ: RYTM)
• Catalyst: With FDA-approved Imcivree for genetic obesity, further label expansion or mid-to-late-stage trial results anticipated in 2025
• Institutional buying trends and revenue growth support upcoming readouts .
________________________________________
7. BeOne Medicines (Ticker: ONC)
• Catalyst: Early human data in solid tumor oncology; multiple upcoming trials in 2025 .
• Q1 2025 marked first profit; strong institutional support
________________________________________
8. Mesoblast Ltd & Capricor Therapeutics
• Catalyst: Stem-cell therapies targeting GvHD, heart failure, Duchenne muscular dystrophy—key FDA decisions expected in H2 2025
• Maxim Group flags pivotal year for approvals and stock catalysts (marketwatch.com).
________________________________________
9. Acelyrin (NASDAQ: SLRN)
• Catalyst: Phase III results for lonigutamab in thyroid eye disease; shareholder vote on Alumis merger around May 2025
• Merger closing and clinical readouts may drive volatility .
________________________________________
10. ADC Therapeutics & Foghorn Therapeutics & Pyxis Oncology
• Catalysts: Multiple preclinical/early clinical updates presented at AACR (April 2025)
o ADC Therapeutics (ADCT): Readouts on 6 ADC programs (Claudin 6, NaPi2b, etc.).
o Foghorn (FHTX): Preclinical updates on EP300, FHD609, FHD909.
o Pyxis Oncology (PYXS): Phase I ADC and Siglec 15 antibody data.
________________________________________
🔎 How to Monitor These Catalysts
• FDA PDUFA dates (Crinetics, Mesoblast/Capricor, Viking)
• Trial readouts/ASC presentations (Kymera, Insmed, ADC Therapeutics, Foghorn, Pyxis)
• M&A/news events (BeOne, Acelyrin merger)
________________________________________
📊 Summary Table
Ticker Company Upcoming Catalyst Timeframe
CRNX Crinetics PDUFA paltusotine NDA Sep 25, 2025
Viking Viking Therapeutics Injectable Phase III, oral Phase II data From mid-2025
INSM Insmed PAH inhalable Phase III readout Mid-to-late 2025
Kymera Kymera Therapeutics Dermatitis/asthma Phase I → Phase II Late 2025 – 2026
ARQT Arcutis Biotherapeutics Continued quarterly updates Throughout 2025
RYTM Rhythm Pharmaceuticals Label expansion/trial updates 2025
ONC BeOne Medicines Solid tumor trial data 2025
Mesoblast/Capricor Stem-cell stocks FDA decisions H2 2025
SLRN Acelyrin EMA/merger vote + Phase III readout May–Q3 2025
ADCT/FHTX/PYXS AACR presenters Academic readouts on multiple programs April 2025
________________________________________
⚠️ A Word of Caution
Small-cap biotech involves high volatility—catalyst events often drive sharp price swings, both up and down. Thorough due diligence is essential.

Stock Market Forecast | TSLA NVDA AAPL AMZN META MSFTStock Market Forecast | CME_MINI:NQ1! CME_MINI:ES1! SPY QQQ
Mag 7 Forecast | NASDAQ:TSLA NVDA AAPL AMZN META MSFT GOOG


QQQ - Weekly Volatility PotentialGood Morning --
Last week we reviewed the potential of the S&P 500, this week let us take a look at the potential perspective of NASDAQ:QQQ .
IV (17.97%) entering the week is trending 31% IVp on the year and has been gradually lowering as price action grinds higher and out of corrective territory -- This is +2.61% more volatile than near-term trending values of HV10 (15.36%) and only -0.57% under HV21 (18.54%), our monthly trending values.
Looking towards next week, I expect the CBOE:VIX to continually soften IV values as the broader markets push towards all-time highs this week. NASDAQ:QQQ historical values are coiling to where we will soon need a volatility spike, but not just yet -- my weekly price target here is simple (HV10 upper implied range) $539.44 with wicking potential above to monthly trends (HV21 upper implied ranges) at $541.42.
Only time will tell, we can't control the markets but we sure can manage our own risk within them. Remember to always be hedged and come back to join me next weekend as we review the charts for what happened VS our expectation!
CHEERS

BITx - Weekly Volatility PotentialGood Morning!
Here is my weekly perspective for CBOE:BITX --
From when we reviewed last weekend, IV (84.60%) has lowered -2.39% and is entering the week with a 2% IVp. We have been in this pattern of rotating IV and Bi-Weekly volatility trends back and forth as HV10 (62.69%) entering the week has increased +2.47% from it's respective level entering last week. The prediction of what is to happen is contracting as what is actually happening in the short-term is trending up.
Bi-Weekly and Monthly volatility values after being 100% coiled and both putting in new yearly lows a month ago are starting to unwind as they create distance from those exact lows.
Could long-term trending means be on the horizon with quarterly values? Bi-weekly will eventually find it's way back there, question is when. Our best advantage, is to continue to track the data and ebb and flow with the markets and macro news.
Looking towards this next week, Our HV10 (62.69%) trending values are still contracting under our monthly HV21 (68.45%) trends, but IV (84.60%) although lowering, is reflecting expansion.
There is a premium capture past stated IV if we can find means regression back to HV63 (99.07%), as what is happening will expand past what is predicted to happen. As of now this value is 14.97% and equates to a premium capture $8.24 or $88.24 per lot or contract.
Again, when IV contracts chasing HV10, but it expands to HV63, we look to collect the premium value difference with the move.
Only time will tell, I think we will see another volume push into this week -- Remember to always be hedged and come back to join me next weekend as we review the charts for what happened VS our expectation!
CHEERS

Trend Reversal on the YENThe breakout of the wedge pattern in the chart formed a beautiful inverse head and shoulders pattern. The right shoulder is currently showing a bull pennant pattern to activate the head and shoulders. The measured move lines up nicely with next resistance. AMEX:FXY

$spyyieahh
Retest of mid line parallel.
Let's see how thos one works out, by 28 July we should see that touch of mid line and then boom or bust ?

SPY: Expecting Bullish Movement! Here is Why:
The analysis of the SPY chart clearly shows us that the pair is finally about to go up due to the rising pressure from the buyers.
Disclosure: I am part of Trade Nation's Influencer program and receive a monthly fee for using their TradingView charts in my analysis.
❤️ Please, support our work with like & comment! ❤️

Bearish Trend Starting SP500 SP:SPX AMEX:SPY Cannot Across 605 with MACD crossdown & RSI top lower
Last Support 593 If Breakthrough That Signal Confirm Complete Down Trend

$LITlong term play
no brainer buy here
easy 3x in my opinion lets see if i hold on for longer or compound mid way
recon one last dip with the ris curling downwards take liquidty . possibly do a 3 tap then teleport .
simples .

SPY (S&P500) - Price Testing Support Trendline - Daily ChartSPY (S&P500 ETF) price has just closed below $600 and is currently under a support trendline.
If price cannot breakout above the $600 and $605 resistance level this month, a pullback could occur down to the support zone.
SPY price could potentially pullback to various levels of support due to:
-USA domestic conflict
-International military conflicts
-Technical chart bearish divergence
-USA federal reserve interest rate news
-Government and corporate news
Support Levels: $595, $590, $585, $580.
Resistance Levels: $600, $605, $610, $615.
The 50EMA/200EMA Golden Cross is still on-going, and support prices of $580 and $568 have yet to be tested significantly.

Israel VS Iran War: Oil Spike!Tensions between Israel and Iran have escalated dramatically, with both nations engaging in direct military strikes. Israel launched Operation Rising Lion, targeting Iran’s nuclear infrastructure, missile factories, and military personnel. In response, Iran retaliated with missile attacks on Israel, hitting Tel Aviv and wounding civilians
The conflict stems from long-standing hostilities, particularly over Iran’s nuclear program, which Israel views as an existential threat. The situation has drawn international attention, with the United States distancing itself from Israel’s actions while maintaining strategic interests in the region.
The escalation has raised concerns about a wider regional war, with analysts warning of unintended consequences and further retaliation. The global markets have also reacted, with oil prices surging amid uncertainty.

Bears Intensify... $QQQ - Pullback LikelyBears Intensify... NASDAQ:QQQ
🐻 Falling Wedge Breakdown
🐻 Hammer Candle
🐻 Bearish Wr%
🐻 H5 Flow Increasing

Update into the closeAnd I cover other charts as well. I expect lower on SPX next weel. Higher on Gold and OIL. Likely higher on Nat Gas, lower on BTC
