XLV Stock Chart Fibonacci Analysis 061025Trading Idea
1) Find a FIBO slingshot
2) Check FIBO 61.80% level
3) Entry Point > 136/61.80%
Chart time frame:D
A) 15 min(1W-3M)
B) 1 hr(3M-6M)
C) 4 hr(6M-1year)
D) 1 day(1-3years)
Stock progress:B
A) Keep rising over 61.80% resistance
B) 61.80% resistance
C) 61.80% support
D) Hit the bottom
E) Hit the top
Stocks rise as they rise from support and fall from resistance. Our goal is to find a low support point and enter. It can be referred to as buying at the pullback point. The pullback point can be found with a Fibonacci extension of 61.80%. This is a step to find entry level. 1) Find a triangle (Fibonacci Speed Fan Line) that connects the high (resistance) and low (support) points of the stock in progress, where it is continuously expressed as a Slingshot, 2) and create a Fibonacci extension level for the first rising wave from the start point of slingshot pattern.
When the current price goes over 61.80% level , that can be a good entry point, especially if the SMA 100 and 200 curves are gathered together at 61.80%, it is a very good entry point.
As a great help, tradingview provides these Fibonacci speed fan lines and extension levels with ease. So if you use the Fibonacci fan line, the extension level, and the SMA 100/200 curve well, you can find an entry point for the stock market. At least you have to enter at this low point to avoid trading failure, and if you are skilled at entering this low point, with fibonacci6180 technique, your reading skill to chart will be greatly improved.
If you want to do day trading, please set the time frame to 5 minutes or 15 minutes, and you will see many of the low point of rising stocks.
If want to prefer long term range trading, you can set the time frame to 1 hr or 1 day.
ETF market


$DIA // June 10 2025 // Analysis & Targets for Day Traders
DIA sticking to that resistance from last Thursday here ahead of Inflation Data!!

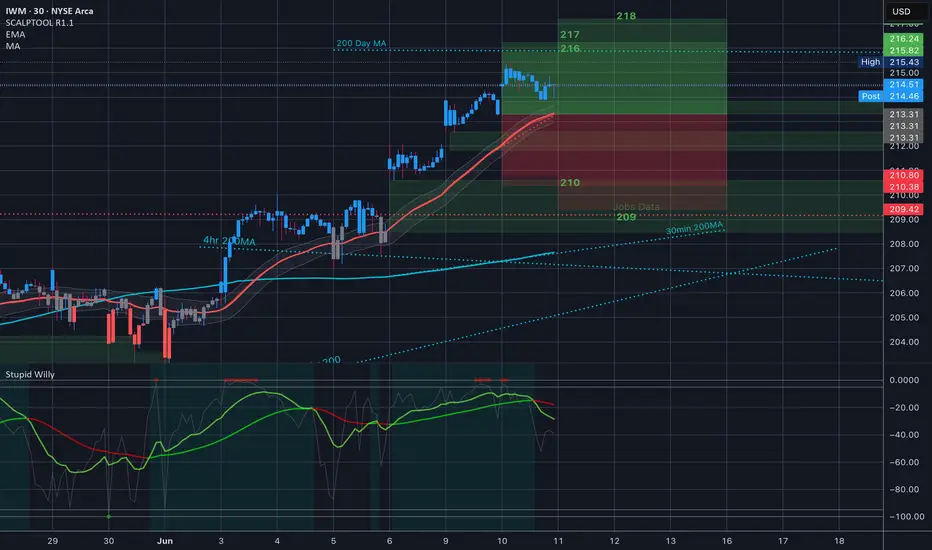
$IWM // June 10 2025 // Analysis & Targets for Day Traders
IWM gapped up for the third trading session in a row. That 200Day Moving average is clearly the target.
$QQQ // June 10 2025 // Analysis & Targets for Day Traders
QQQ really made use of today’s setup. Green signal line, above the 35EMA - making a run to the top of the implied move to close within it!!

$SPY // June 10 2025 // Analysis & Targets for Day TradersWow!!! What a day!! This is the chart from premarket, and you can see that 35EMA catching us all day. The setup was there. Good Game!!

Late afternoon updateSPX is about as stretched as an ending diagonal should get. On Spy the pattern looks clear. If we are going to drop, it should be from this level. We'll see if that is correct soon enough.
USOIL found resistance at 66. Gold found resistance at 3350. Both need to get over their resistance to continue the uptrend. BTC pulled back and I think it goes lower. NG should go lower as well.

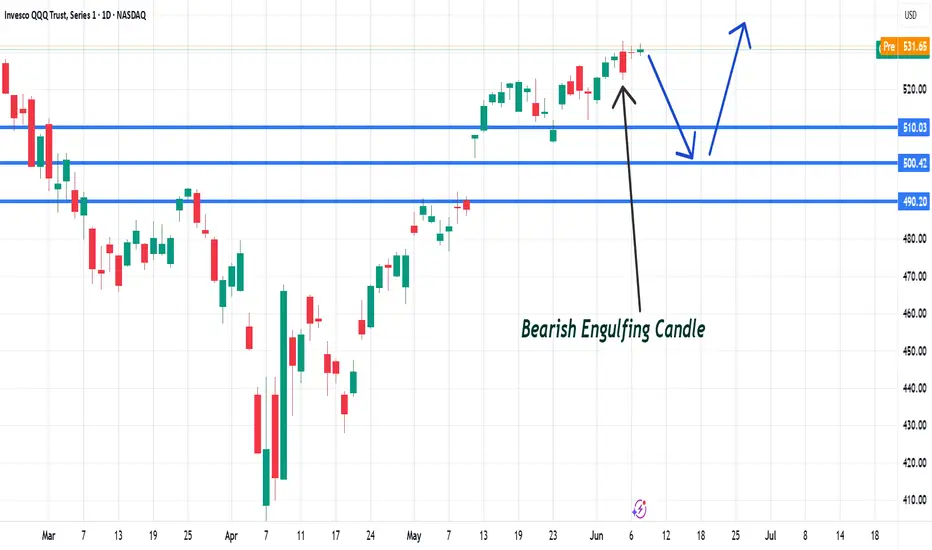
QQQ at the critical area.#QQQ
A Bearish Engulfing pattern has appeared after a strong uptrend, which is typically a reversal signal.
$490.00 – Major support zone
$500.00 – Mid-level support
$510.00 – Closest support turned into potential resistance.
The Bearish Engulfing Candle will be considered invalid if a daily candle closes above its high at $533.05.
Banking Sector Recovery : XLF IndexI think the markets love Joe Biden. After he won the elections the market just made nice recoveries. On this XLF index I am looking at $32.00 price target before the end of 2020.

Nightly $SPY / $SPX Scenarios for June 10, 2025🔮 Nightly AMEX:SPY / SP:SPX Scenarios for June 10, 2025 🔮
🌍 Market-Moving News 🌍
📱 Apple Disappoints at WWDC Keynote
Apple ( NASDAQ:AAPL ) faced criticism after a lackluster WWDC keynote. Major AI and Siri upgrades were delayed, prompting a 1–1.5% drop in Apple shares—the weakest move during today's presentation
🎮 GameStop to Report Q1, Crypto Pivot in Focus
GameStop ( NYSE:GME ) is scheduled to announce Q1 earnings after market close. Investors will be watching for updates on its $500M Bitcoin allocation and potential crypto-related strategies
📈 Small-Business Optimism Rises
The NFIB Small Business Optimism Index for May came in at 95.9—above the 94.9 consensus—showing modest improvement in sentiment among small firms
📊 Key Data Releases & Events 📊
📅 Tuesday, June 10:
6:00 AM ET – NFIB Small Business Optimism (May):
A reading above expectations could boost risk market sentiment by showing stronger Main Street confidence.
⚠️ Disclaimer:
This is for educational/informational purposes only and does not constitute financial advice. Please consult a licensed professional before making investment decisions.
📌 #trading #stockmarket #economy #news #trendtao #charting #technicalanalysis

Are The Markets Running Out Of Steam? SPY just cant seemed to hold above the 600 psychological level.
Are big players unloading into this positive market strength?
Are we due for a larger pullback?
There's a lot of mixed price action and we just cant seem to make a true breakout.
Some names are underperforming and other names are outperforming.
We remain tactically bullish while trimming keys positions into strength.
Being nimble in this market us key as were seeing large intra day swings.
Short term there is some risk of lower price so we have hedged in some individual names while still remaining bullish.

Trade Long on TLT: Opportunities Amid Weakness in Treasuries
Targets:
- T1 = $86.50
- T2 = $88.00
Stop Levels:
- S1 = $84.00
- S2 = $83.00
**Wisdom of Professional Traders:**
This analysis synthesizes insights from thousands of professional traders and market experts, leveraging collective intelligence to identify high-probability trade setups. The wisdom of crowds principle suggests that aggregated market perspectives from experienced professionals often outperform individual forecasts, reducing cognitive biases and highlighting consensus opportunities in TLT.
**Key Insights:**
TLT, which represents long-term U.S. Treasury bonds, is currently trading at discounted levels following recent declines. This weakness stems from macroeconomic concerns and tightening monetary policies. Traders are paying close attention to the Federal Reserve's stance on interest rates, as hawkish behavior continues to suppress bond prices. However, current oversold conditions paired with strong technical levels around $85.00 suggest a potential reversal. A move higher could be catalyzed by dovish signals from policymakers or slowing inflation data, which may ease investor fears about prolonged rate hikes.
Treasuries often act as safe havens during volatile market conditions, and seasoned investors see value in entering positions during times of weakness. Traders should also monitor global economic indicators, as international risk events could fuel additional demand for long-term U.S. bonds.
**Recent Performance:**
Over the past week, TLT has experienced bearish pressure, losing nearly $1.50 in value. The asset's decline mirrors broader fixed-income struggles, with junk bonds (JNK) showing parallel weakness. However, late-stage declines and deceleration in momentum suggest stabilization might soon occur. TLT has maintained its position near the critical $85.00 support zone, hinting at limited further downside, especially as bond yields stabilize.
**Expert Analysis:**
Technical analysts highlight that TLT's Relative Strength Index (RSI) is approaching oversold territory, reinforcing the likelihood of bullish momentum. Historical price action indicates that dips below $85.00 historically see swift recoveries, driven by renewed buying interest from institutional players. Additionally, macroeconomists suggest that reduced bond issuance paired with moderating inflation could support TLT prices in the medium term.
The current price range provides a favorable risk-to-reward ratio for those with an intermediate to long-term outlook. Tactical entries at these levels could yield gains if market dynamics shift in favor of easing rate pressures or economic uncertainties drive bond demand.
**News Impact:**
Recent news highlights sustained investor caution as markets digest hawkish rhetoric from the Federal Reserve and await key economic data such as CPI and employment figures. While TLT remains under pressure from elevated bond yields, geopolitical tensions and emerging-market volatility could bolster demand for U.S. Treasury bonds as a safe-haven play. Events such as unexpectedly weak inflation data or dovish commentary from policymakers could further aid TLT's recovery.
**Trading Recommendation:**
Based on the analysis, TLT presents a favorable long opportunity for traders looking to capitalize on oversold conditions and technical support around $85.00. The proposed targets of $86.50 and $88.00 provide attainable high-probability price points, while stop-loss levels at $84.00 and $83.00 ensure minimal risk exposure. Monitoring macroeconomic indicators and policy announcements will be crucial in confirming the bullish outlook. Entering long positions at current levels provides a compelling risk-to-reward setup, aligning with professional trader consensus.

QQQ NOTICE TREND LINE SUPPORT I have now started to position for the transition in the markets I have moved out of all calls again for the 4 time in 4 days each of the trades made $$ . but today is day 39 TD of the rally . And I am looking for a TOP in day 40 TD I have now moved to 40 today then 75% MOC in spy and qqq 5550 555 560 QQQ puts 2026 time zone and 650 in spy . The trendline has held rather nice to help make some nice $$ and we if bullish should now be in early wave 3 of 5 of 5 of 5 .So why buy puts NOW simple answer is It could still be wave c up for wave B or wave D. and That today is day TD39 I have posted a possible Major top due on td 40 and The spiral hold up into june 6th to 9th .I know my risks and am willing to start taking the same stand and positions as I did 11/29 12/6 and feb 18th based on the wave structure and PUT /CALL model . I am willing to This is not for all traders . But I am turning down in NYSI and the NYMO is showing buying is running out but bullish call buying is nearing the two last TOPS . I have 25 % cash and will wait for two things One put call drops to 60 on 5 day or 10 day at 65 second daily RSI is no confirmation . 3rd the qqq reaches 531/534 knowing it could extend to 541/555 and similar in sp cash or the DJI prints a .786 this is a lot but it is part of the game plan best of trades WAVETIMER

Hydrogenif we look at the chart structure of Bloom Energy, and you can see my charts, it looks really promising for an inverse right leg extension into new all-time highs. Should be a fun ride. There's been positive news for FCEL, and PLUG, and the charts have responded well, but being burned once or twice already in Hydrogen, I'm shy to jump back in. It's probably the time to do so in select tickers.
A review of the three main ETF in show breakouts from their all-time bearish Fibonacci channels, so it's worth paying attention to. Yes, we've had this same scenario in the past and got burned, but the future is now. Tickers like Fcel, if they get any volume behind them, can pump back up to $30USD, on it's way to $200. I can show you my chart, but many of you have already seen it.

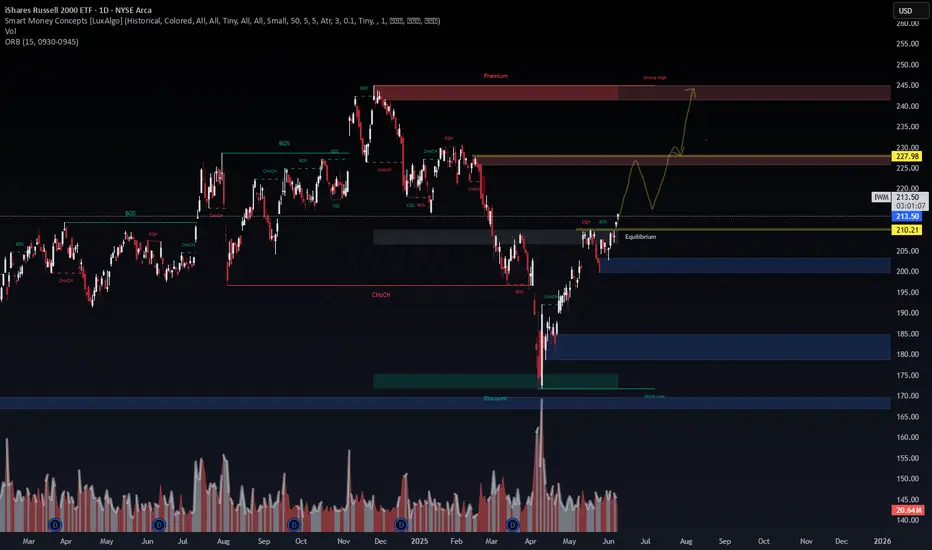
IWM Technical Outlook: Small Caps Poised for Ascent?📅 1D Chart | SMC | BOS/CHoCH | FVG Zones | ORB (0930–0945)
Price: $213.50 | Volume: 20.64M
The Russell 2000 ETF (IWM) is pushing into the equilibrium zone after a clean Break of Structure (BOS) from the mid-May lows. This rally signals regained bullish intent, but macro and liquidity overhead remain the key challenges.
🔍 Technical Breakdown:
🟩 Current Zone: Sitting at $213.50 near equilibrium
🟨 First Supply Zone (Reaction Expected): ~$227.98–$230
🟥 Strong High/Final Target Zone: $243–$250 (Premium)
Key Confluence:
CHoCH into BOS confirms structure shift
Volume decreasing slightly—awaiting re-accumulation before next leg
🧠 Probabilistic Positioning:
📈 Bullish Continuation (65%):
Pullback toward $210–213 zone (equilibrium) before reclaiming higher resistance. Strong move likely if macro sentiment aligns (Fed pause, rate-cut optimism).
📉 Bearish Rejection (35%):
Failure to hold $210 leads to re-tests of:
$200 zone (OB/FVG)
Extended: $186–$175
🌐 Macro Context:
Small-caps are interest rate-sensitive. With markets pricing fewer hikes and potential cuts into late 2025, capital rotation into risk assets may continue.
GDP revision and ISM Services softness support risk-on flows. However, real yields remain sticky, capping aggressive upside.
🎯 Trade Setup:
Entry Zone: $210–213.50
Target 1: $227.98
Target 2: $243+
Invalidation: Close below $210 (re-enter lower OBs)
🔒 Risk-to-Reward: ~1:3 on breakout retest scenario
📌 Conclusion:
IWM is climbing the risk ladder with structure and volume backing it. Watch for reaction at the mid-supply zone ($228–230). A clean break above could validate a move toward the premium zone.
#IWM #Russell2000 #SmartMoneyConcepts #TechnicalAnalysis #VolumeProfile #FVG #MarketStructure #TradingView #MacroOutlook #BOS #SMC #Equilibrium #RiskReward
Not much of an idea and probably gonna be wrong put predictionAt this point im just waffling but this is what im looking for (unlikely but my system sees a possibility)

Gold - Falling VolatilityI've been selling option premium as momentum has fallen. Money is leaving gold and moving into silver.
As price reaches lower band, I'll be adding delta in anticipation of moves to much higher levels. Gold appears to be at the bottom on a long-term, rising channel and is providing positive long term opportunities.

SPY/QQQ Plan Your Trade For 6-9: Inside BreakawayToday's pattern suggests the SPY/QQQ will attempt to make a breakaway type of price move - away from Friday's open-close range.
Given the fairly tight opening price level this morning, I would stay cautious in early trading today and try to let the first 60 minutes play out - looking for that breakaway trend/momentum.
Overall, the markets are still in a Bullish price phase - trying to push higher.
But, as I continue to warn, I believe the markets could rollover and break downward at any time.
BTCUSD moved substantially higher overnight. This could be the beginning of a bigger advance higher. But, it could also be an exhaustion move higher.
Gold and Silver are still melting upward. This move in metals recently certainly shows the markets are still fearful of any potential downside price activity.
Again, I urge traders to stay cautious as we continue to struggle within the sideways price range.
Price will show us what it wants to do and I believe this move higher in BTCUSD could be a false type of breakout move to the upside.
Get some.
#trading #research #investing #tradingalgos #tradingsignals #cycles #fibonacci #elliotwave #modelingsystems #stocks #bitcoin #btcusd #cryptos #spy #gold #nq #investing #trading #spytrading #spymarket #tradingmarket #stockmarket #silver

AIQ eyes on $37: Double Fib resistance to Break or Reject AIQ recovering nicely after AI demand show to continue.
Currently testing a double fib resistance at $36.99-37.01
Looking for a Brean-n-Retest or if dips to $35.20-35.24

IWM - 3 months HEAD & SHOULDERS══════════════════════════════
Since 2014, my markets approach is to spot
trading opportunities based solely on the
development of
CLASSICAL CHART PATTERNS
🤝Let’s learn and grow together 🤝
══════════════════════════════
Hello Traders ✌
After a careful consideration I came to the conclusion that:
- it is crucial to be quick in alerting you with all the opportunities I spot and often I don't post a good pattern because I don't have the opportunity to write down a proper didactical comment;
- since my parameters to identify a Classical Pattern and its scenario are very well defined, many of my comments were and would be redundant;
- the information that I think is important is very simple and can easily be understood just by looking at charts;
For these reasons and hoping to give you a better help, I decided to write comments only when something very specific or interesting shows up, otherwise all the information is shown on the chart.
Thank you all for your support
🔎🔎🔎 ALWAYS REMEMBER
"A pattern IS NOT a Pattern until the breakout is completed. Before that moment it is just a bunch of colorful candlesticks on a chart of your watchlist"
═════════════════════════════
⚠ DISCLAIMER ⚠
Breakout Area, Target, Levels, each line drawn on this chart and any other content represent just The Art Of Charting’s personal opinion and it is posted purely for educational purposes. Therefore it must not be taken as a direct or indirect investing recommendations or advices. Entry Point, Initial Stop Loss and Targets depend on your personal and unique Trading Plan Tactics and Money Management rules, Any action taken upon these information is at your own risk.
═════════════════════════════

Swing Trading OutlookThe Bulls are still in control but showing some weakness based on Friday's Doji. We are still above the 9SMA, so will continue to look for some short-term swing trades. Meanwhile keep an eye on the possible negative divergences forming. Cheers!

Weekly $SPY / $SPX Scenarios for June 9–13, 2025 🔮 Weekly AMEX:SPY / SP:SPX Scenarios for June 9–13, 2025 🔮
🌍 Market-Moving News 🌍
📱 Apple WWDC & Tech Momentum
Apple’s annual Worldwide Developers Conference kicks off Monday with CEO Tim Cook set to discuss new products, services, and likely AI initiatives—tracks should watch include impacts on NASDAQ:AAPL and AI-related stocks
🧨 GameStop Eyed for Crypto Pivot
GameStop (a meme-stock darling) reports earnings Tuesday. Markets are watching for updates on its $500M bitcoin investment and potential pivot toward crypto-driven revenue streams
🇨🇳 U.S.–China Trade Talks in London
High-level trade dialogue begins Monday between U.S. and Chinese representatives in London, offering possible relief to trade tensions and providing a lift to risk assets
📉 Key Inflation Data Midweek
Wednesday brings the May CPI release—crucial for assessing tariff-driven inflation trends and likely to influence Fed policy outlook ahead of next month’s meeting
💹 Oil Markets React to Trade Uncertainty
Oil prices are stable to slightly up ahead of trade talks, as Brent holds around $66/barrel—reflecting balanced supply concerns and hopes for easing global tensions
🌐 G7 Summit and Global Policy Risks
G7 finance ministers convene in Canada (50th anniversary), tackling trade strains, Russia–Ukraine, and inflation. Global macrospoilers could trigger renewed volatility
📊 Key Data Releases & Events 📊
📅 Monday, June 9
Apple WWDC begins (CEO keynote)
U.S.–China trade talks start in London
📅 Tuesday, June 10
GameStop Q2 earnings (+ bitcoin update)
NFIB Small Business Index (6:00 AM ET)
📅 Wednesday, June 11
8:30 AM ET – Consumer Price Index (May)
Watch for inflation signal from tariffs.
8:30 AM ET – Core CPI (May)
Core inflation trend under scrutiny.
📅 Thursday, June 12
8:30 AM ET – Producer Price Index (May)
Early check on wholesale inflation
8:30 AM ET – Initial & Continuing Jobless Claims
📅 Friday, June 13
10:00 AM ET – University of Michigan Consumer Sentiment (June, preliminary)
Consumer mood and tariff impact insights
⚠️ Disclaimer:
This is for informational/educational purposes only. Not financial advice. See a licensed advisor before making investing decisions.
📌 #trading #stockmarket #economy #news #trendtao #charting #technicalanalysis
