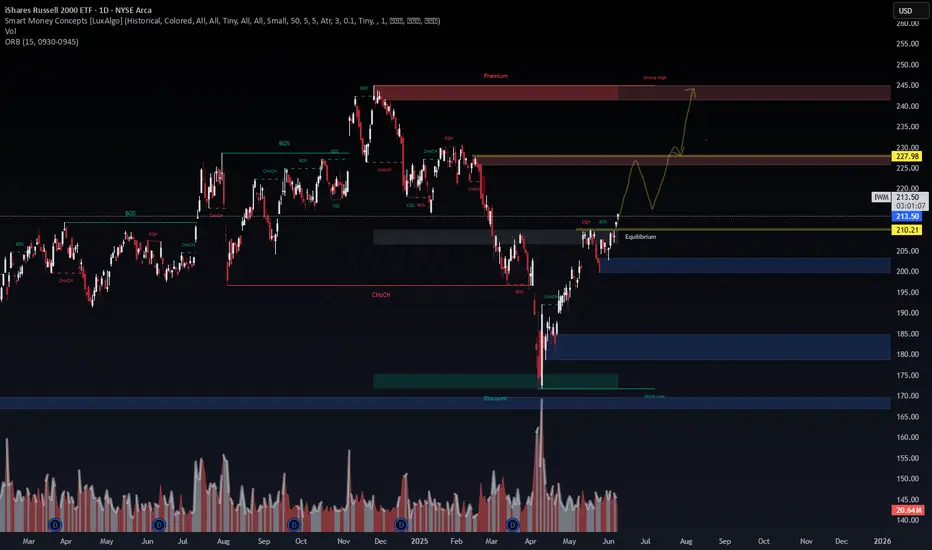
IWM Technical Outlook: Small Caps Poised for Ascent?📅 1D Chart | SMC | BOS/CHoCH | FVG Zones | ORB (0930–0945)
Price: $213.50 | Volume: 20.64M
The Russell 2000 ETF (IWM) is pushing into the equilibrium zone after a clean Break of Structure (BOS) from the mid-May lows. This rally signals regained bullish intent, but macro and liquidity overhead remain the key challenges.
🔍 Technical Breakdown:
🟩 Current Zone: Sitting at $213.50 near equilibrium
🟨 First Supply Zone (Reaction Expected): ~$227.98–$230
🟥 Strong High/Final Target Zone: $243–$250 (Premium)
Key Confluence:
CHoCH into BOS confirms structure shift
Volume decreasing slightly—awaiting re-accumulation before next leg
🧠 Probabilistic Positioning:
📈 Bullish Continuation (65%):
Pullback toward $210–213 zone (equilibrium) before reclaiming higher resistance. Strong move likely if macro sentiment aligns (Fed pause, rate-cut optimism).
📉 Bearish Rejection (35%):
Failure to hold $210 leads to re-tests of:
$200 zone (OB/FVG)
Extended: $186–$175
🌐 Macro Context:
Small-caps are interest rate-sensitive. With markets pricing fewer hikes and potential cuts into late 2025, capital rotation into risk assets may continue.
GDP revision and ISM Services softness support risk-on flows. However, real yields remain sticky, capping aggressive upside.
🎯 Trade Setup:
Entry Zone: $210–213.50
Target 1: $227.98
Target 2: $243+
Invalidation: Close below $210 (re-enter lower OBs)
🔒 Risk-to-Reward: ~1:3 on breakout retest scenario
📌 Conclusion:
IWM is climbing the risk ladder with structure and volume backing it. Watch for reaction at the mid-supply zone ($228–230). A clean break above could validate a move toward the premium zone.
#IWM #Russell2000 #SmartMoneyConcepts #TechnicalAnalysis #VolumeProfile #FVG #MarketStructure #TradingView #MacroOutlook #BOS #SMC #Equilibrium #RiskReward
ETF market
Not much of an idea and probably gonna be wrong put predictionAt this point im just waffling but this is what im looking for (unlikely but my system sees a possibility)

Gold - Falling VolatilityI've been selling option premium as momentum has fallen. Money is leaving gold and moving into silver.
As price reaches lower band, I'll be adding delta in anticipation of moves to much higher levels. Gold appears to be at the bottom on a long-term, rising channel and is providing positive long term opportunities.

SPY/QQQ Plan Your Trade For 6-9: Inside BreakawayToday's pattern suggests the SPY/QQQ will attempt to make a breakaway type of price move - away from Friday's open-close range.
Given the fairly tight opening price level this morning, I would stay cautious in early trading today and try to let the first 60 minutes play out - looking for that breakaway trend/momentum.
Overall, the markets are still in a Bullish price phase - trying to push higher.
But, as I continue to warn, I believe the markets could rollover and break downward at any time.
BTCUSD moved substantially higher overnight. This could be the beginning of a bigger advance higher. But, it could also be an exhaustion move higher.
Gold and Silver are still melting upward. This move in metals recently certainly shows the markets are still fearful of any potential downside price activity.
Again, I urge traders to stay cautious as we continue to struggle within the sideways price range.
Price will show us what it wants to do and I believe this move higher in BTCUSD could be a false type of breakout move to the upside.
Get some.
#trading #research #investing #tradingalgos #tradingsignals #cycles #fibonacci #elliotwave #modelingsystems #stocks #bitcoin #btcusd #cryptos #spy #gold #nq #investing #trading #spytrading #spymarket #tradingmarket #stockmarket #silver

AIQ eyes on $37: Double Fib resistance to Break or Reject AIQ recovering nicely after AI demand show to continue.
Currently testing a double fib resistance at $36.99-37.01
Looking for a Brean-n-Retest or if dips to $35.20-35.24

IWM - 3 months HEAD & SHOULDERS══════════════════════════════
Since 2014, my markets approach is to spot
trading opportunities based solely on the
development of
CLASSICAL CHART PATTERNS
🤝Let’s learn and grow together 🤝
══════════════════════════════
Hello Traders ✌
After a careful consideration I came to the conclusion that:
- it is crucial to be quick in alerting you with all the opportunities I spot and often I don't post a good pattern because I don't have the opportunity to write down a proper didactical comment;
- since my parameters to identify a Classical Pattern and its scenario are very well defined, many of my comments were and would be redundant;
- the information that I think is important is very simple and can easily be understood just by looking at charts;
For these reasons and hoping to give you a better help, I decided to write comments only when something very specific or interesting shows up, otherwise all the information is shown on the chart.
Thank you all for your support
🔎🔎🔎 ALWAYS REMEMBER
"A pattern IS NOT a Pattern until the breakout is completed. Before that moment it is just a bunch of colorful candlesticks on a chart of your watchlist"
═════════════════════════════
⚠ DISCLAIMER ⚠
Breakout Area, Target, Levels, each line drawn on this chart and any other content represent just The Art Of Charting’s personal opinion and it is posted purely for educational purposes. Therefore it must not be taken as a direct or indirect investing recommendations or advices. Entry Point, Initial Stop Loss and Targets depend on your personal and unique Trading Plan Tactics and Money Management rules, Any action taken upon these information is at your own risk.
═════════════════════════════

Swing Trading OutlookThe Bulls are still in control but showing some weakness based on Friday's Doji. We are still above the 9SMA, so will continue to look for some short-term swing trades. Meanwhile keep an eye on the possible negative divergences forming. Cheers!

Weekly $SPY / $SPX Scenarios for June 9–13, 2025 🔮 Weekly AMEX:SPY / SP:SPX Scenarios for June 9–13, 2025 🔮
🌍 Market-Moving News 🌍
📱 Apple WWDC & Tech Momentum
Apple’s annual Worldwide Developers Conference kicks off Monday with CEO Tim Cook set to discuss new products, services, and likely AI initiatives—tracks should watch include impacts on NASDAQ:AAPL and AI-related stocks
🧨 GameStop Eyed for Crypto Pivot
GameStop (a meme-stock darling) reports earnings Tuesday. Markets are watching for updates on its $500M bitcoin investment and potential pivot toward crypto-driven revenue streams
🇨🇳 U.S.–China Trade Talks in London
High-level trade dialogue begins Monday between U.S. and Chinese representatives in London, offering possible relief to trade tensions and providing a lift to risk assets
📉 Key Inflation Data Midweek
Wednesday brings the May CPI release—crucial for assessing tariff-driven inflation trends and likely to influence Fed policy outlook ahead of next month’s meeting
💹 Oil Markets React to Trade Uncertainty
Oil prices are stable to slightly up ahead of trade talks, as Brent holds around $66/barrel—reflecting balanced supply concerns and hopes for easing global tensions
🌐 G7 Summit and Global Policy Risks
G7 finance ministers convene in Canada (50th anniversary), tackling trade strains, Russia–Ukraine, and inflation. Global macrospoilers could trigger renewed volatility
📊 Key Data Releases & Events 📊
📅 Monday, June 9
Apple WWDC begins (CEO keynote)
U.S.–China trade talks start in London
📅 Tuesday, June 10
GameStop Q2 earnings (+ bitcoin update)
NFIB Small Business Index (6:00 AM ET)
📅 Wednesday, June 11
8:30 AM ET – Consumer Price Index (May)
Watch for inflation signal from tariffs.
8:30 AM ET – Core CPI (May)
Core inflation trend under scrutiny.
📅 Thursday, June 12
8:30 AM ET – Producer Price Index (May)
Early check on wholesale inflation
8:30 AM ET – Initial & Continuing Jobless Claims
📅 Friday, June 13
10:00 AM ET – University of Michigan Consumer Sentiment (June, preliminary)
Consumer mood and tariff impact insights
⚠️ Disclaimer:
This is for informational/educational purposes only. Not financial advice. See a licensed advisor before making investing decisions.
📌 #trading #stockmarket #economy #news #trendtao #charting #technicalanalysis

SPY (S&P500 ETF) - Price Attempting Breakout Above ResistanceSPY (S&P500 ETF) price is attempting to breakout above Daily resistance levels of $594 and $597.
SPY ETF has been in an uptrend since May 2025. A Golden Cross also occured on May 19th 2025, signaling that a potential longer term bullish rally could occur.
Friday's candle closed as a Doji signaling some potential indecision after recent price volatility.
SPY price is not at any extreme level on the Daily chart.
If SPY price ever gaps up and rallies up to the $612 to $620 resistance zone, price could sell off stronger (short-term).
In June 2025, trade deal and inflation news will most likely be the catalyst for further volatility, in addition to government news announcements.

IS SPY & QQQ READY TO MAKE THE NEXT LEG HIGHER?In this video, I cover the weekly chart of AMEX:SPY and NASDAQ:QQQ to answer the question: are the markets getting ready to make their next leg higher and according to the charts on our weekly timeframe it seems to be the case... watch this video to find out more!

SPY Week of June 9thHey everyone,
Keeping this idea quick and focusing on the monthly levels as they have more going on.
Safe trades, remember not advice and take care!

SMH/SPY | Bullish Breakout | Tech Rotation | (June 8, 2025)SMH/SPY | Bullish Breakout | Tech Rotation Signal | (June 8, 2025)
1️⃣ Insight Summary:
The SMH (Semiconductor ETF) vs. SPY (S&P 500 ETF) ratio is breaking out of a key parallel channel, signaling strong capital rotation into semiconductors. This often precedes broader tech strength — and it’s happening now.
2️⃣ Trade Parameters (Indicator View):
Bias: Bullish for SMH (and leading semis like NVDA, AVGO, TSM, AMD)
Entry Zone: Current breakout level on SMH/SPY ratio
TP1 (First Take Profit Area): Watch for continuation upside in SMH outperforming SPY
❌ No Stop Loss: This is a market strength indicator, not a direct trade setup
3️⃣ Key Notes:
✅ Breakout Context: The breakout from the parallel channel suggests relative strength in semiconductors. Historically, this precedes runs in NVDA, Broadcom, and TSM — all major SMH components.
📈 Macro Implication: When SMH outperforms SPY, it typically means one of two things is happening:
— Semiconductors are gaining strength (bullish for tech)
— The S&P 500 is weakening (capital flows into more resilient sectors)
Either way, semis benefit.
🧠 Investor Psychology: With market volatility rising (VIX 37+), investors often move into tech leaders, gold, USD, and now even BTC. SMH is a top contender in this rotation.
❌ Invalidation: If the SMH/SPY ratio falls back inside the channel, it would invalidate the breakout thesis — a sign to stay cautious.
4️⃣ Follow-Up:
I'll continue monitoring this indicator — it’s not a direct trade but a macro signal for strength in leading tech names. If it holds above the channel, the upside potential remains strong.
Please LIKE 👍, FOLLOW ✅, SHARE 🙌 and COMMENT ✍ if you enjoy this idea! Also share your ideas and charts in the comments section below! This is best way to keep it relevant, support us, keep the content here free and allow the idea to reach as many people as possible.
Disclaimer: This is not financial advice. Always conduct your own research. This content may include enhancements made using AI.


SPY Trading Opportunity! SELL!
My dear followers,
I analysed this chart on SPY and concluded the following:
The market is trading on 599.04 pivot level.
Bias - Bearish
Technical Indicators: Both Super Trend & Pivot HL indicate a highly probable Bearish continuation.
Target - 570.83
Safe Stop Loss - 616.43
About Used Indicators:
A super-trend indicator is plotted on either above or below the closing price to signal a buy or sell. The indicator changes color, based on whether or not you should be buying. If the super-trend indicator moves below the closing price, the indicator turns green, and it signals an entry point or points to buy.
Disclosure: I am part of Trade Nation's Influencer program and receive a monthly fee for using their TradingView charts in my analysis.
———————————
WISH YOU ALL LUCK

IWM Long Term TargetIWM Weekly chart is very bullish IMNO. Confirmation of the INV H&S. Measured target posted

QQQ: Expecting Bearish Continuation! Here is Why:
Looking at the chart of QQQ right now we are seeing some interesting price action on the lower timeframes. Thus a local move down seems to be quite likely.
Disclosure: I am part of Trade Nation's Influencer program and receive a monthly fee for using their TradingView charts in my analysis.
❤️ Please, support our work with like & comment! ❤️

iBIT - Weekly Volatility PotentialGood Morning!
Here is my weekly perspective for NASDAQ:IBIT
From when we reviewed last weekend, IV (41.19%) has lowered -2.23% and is entering the week with a 0% IVp. We have been in this pattern of rotating IV and Bi-Weekly volatility trends back and forth as HV10 (29.73%) entering the week has increased +1.49% from it's respective level entering last week. The prediction of what is to happen is contracting as what is actually happening in the short-term is trending up.
Bi-Weekly and Monthly volatility values after being 100% coiled and both putting in new yearly lows a month ago are starting to unwind as they create distance from those exact lows.
Could long-term trending means be on the horizon with quarterly values?
Bi-weekly trends will eventually find it's way back there with monthly not far behind, question is when. Our best advantage is to continue to track the data and ebb and flow with the markets and macro news as it is released.
Looking towards this next week, Our HV10 (29.73%) trending values are still contracting under our monthly HV21 (33.37%) trends, but IV (41.19%) although lowering beyond yearly lows, is reflecting future expansion.
Only time will tell, I think we will see another volume push into this week -- Remember to always be hedged and come back to join me next weekend as we review the charts for what happened VS our expectation!
CHEERS


SPY Double Rising WedgeWatch the trendlines of both rising wedges and plan your trades accordingly. I will post the Monday Key trading levels in the next post

SPY CHANNEL JUNSPY ( AMEX:SPY ) – Multi-Timeframe Volatility Channel Analysis
SPY remains inside a well-defined ascending volatility channel across all key timeframes (2h, 4h, Daily, Weekly), confirming a strong bullish structure with clear institutional control.
🔸 Short-Term (2h – 4h):
Consolidating between 590 and 605, with recent rejection from upper bounds.
Multiple PUT positions triggered near 599 and 603, suggesting institutional hedging.
Key support: 590. Below that, watch for downside toward 586 or 576.
🔸 Mid-Term (Daily):
Bullish channel still intact.
As long as price holds above EMA20 at 585.77, the trend remains bullish.
Breakout above 608 opens targets toward 611 (gap) and then 617–620.
🔸 Long-Term (Weekly):
Weekly channel projects targets up to 635 if structure holds.
Strong institutional resistance zone between 607 and 611.

SnP forming right shoulderSupported by bullish indicators such as the Zweig Breadth Thrust and if May closes green, it means 1 year from now the market will have double digit returns every single time.

SPY JUNSPY – June Update
SPY continues to trade within a well-defined ascending channel, with bullish momentum intact.
Price is currently approaching a major resistance at 608, while holding above the key support at 590.
Immediate upside target: 608, followed by potential extension toward the gap fill near 611.
If price fails to hold above 590, downside pressure could lead to a retest of the gaps at 550 and 530, which act as major support zones.
As long as SPY remains above the channel midpoint and above EMA20 (585.77), the bullish structure remains valid.
#SPY #SP500 #Stocks #TechnicalAnalysis #OptionsFlow #Momentum #Support #Resistance
#globaltrade #investment #investing #stockmarket #wealth #realestate #markets #economy #finance #money #forex #trading #price #business #currency #blockchain #crypto #cryptocurrency #airdrop #btc #ethereum #ico #altcoin #cryptonews #Bitcoin #ipo

How to read market sentiment like a pro?
1️⃣ What Is Consumer Sentiment?
Consumer sentiment reflects how optimistic or pessimistic people feel about their financial situation and the overall economy. It’s a measure of people’s willingness to spend money. When confidence is high, consumers tend to spend more. When it's low, they hold back.
✅ It helps anticipate shifts in market behavior
✅ Used as a macroeconomic signal for traders and investors
✅ Often treated like a leading indicator for the S&P 500 and other indices
2️⃣ Why Is Consumer Sentiment Important?
The economy is largely driven by consumer spending. When people feel good about the economy, they:
- Buy more products
- Take on more debt
- Invest in assets
This behavior fuels business growth and market momentum. When sentiment drops, the opposite happens.
Sentiment is not always perfect or predictive, but it increases the probability of price moves — and in trading, we always aim for higher probabilities, not certainties.
3️⃣ Types of Sentiment Indicators
There are several forms of sentiment tracking:
✔️ Consumer Sentiment Index (e.g. University of Michigan)
✔️ News Sentiment (based on headline tone)
✔️ Market Sentiment Indicators (e.g. VIX, bond spreads)
✔️ Social/Headline Aggregators (e.g. AI-driven data that tracks public mood)
✔️ XLY/XLP what we have here
Each has strengths and limitations. For example, consumer sentiment is slower to change but more reliable long-term. News sentiment can be noisy and volatile but responsive.
4️⃣ How to Use Consumer Sentiment
Treat sentiment like a range or zone:
- High sentiment = potential market tops (overconfidence)
- Low sentiment = potential bottoms (fear and contraction)
Look for divergences:
- When sentiment is improving but markets are falling 👉 could signal a reversal
- When sentiment is declining while markets are rising 👉 could suggest caution
🧠 Think in probabilities, not possibilities. Just because sentiment is high doesn’t guarantee a rally but it does increase the odds, especially when combined with other data.
5️⃣ Example Ratios: XLY vs XLP
To break down consumer sentiment further, traders sometimes compare two:
XLY (Consumer Discretionary): Companies people spend money on when they feel confident (e.g. Amazon, Tesla)
XLP (Consumer Staples): Essential goods people buy regardless of economy (e.g. Walmart, Procter & Gamble)
If XLY/XLP is rising: consumer confidence is likely improving
If XLY/XLP is falling: sentiment is likely weakening
This ratio helps gauge spending behavior and risk appetite in a more visual, trackable way.
6️⃣ Limitations of Consumer Sentiment
⚠️ Not always aligned with price action in short-term
⚠️ Lagging data depending on source
⚠️ Can be influenced by temporary events (e.g. political shifts, news headlines)
⚠️ Doesn’t work well alone should be used with technical and fundamental analysis
7️⃣ Final Thoughts
Consumer sentiment is one of the most powerful but often overlooked indicators. It doesn’t tell you exactly what will happen, but it gives important context:
✅ Where we are in the economic cycle
✅ How confident people are in spending
✅ When the market may be out of sync with the real world
Use sentiment tools to build a higher-probability picture of what’s next. Combine them with price action, macro analysis, and volume-based tools for a more complete view.
