QQQ – Watching for Continuation Above 529Markets are whispering strength.
After reclaiming key structure levels, QQQ is attempting a clean breakout. If momentum persists above this consolidation range, we may be stepping into a measured expansion phase.
Not a call to action—just something worth watching 👀
Levels above remain untapped.
📍 Keep your chart open. The tape might speak soon.
#QQQ #BreakoutWatch #LiquidityZones #PriceAction #MarketInternals #WaverVanir #SmartMoneyConcepts #VolumeAnalysis #TradingView
ETF market

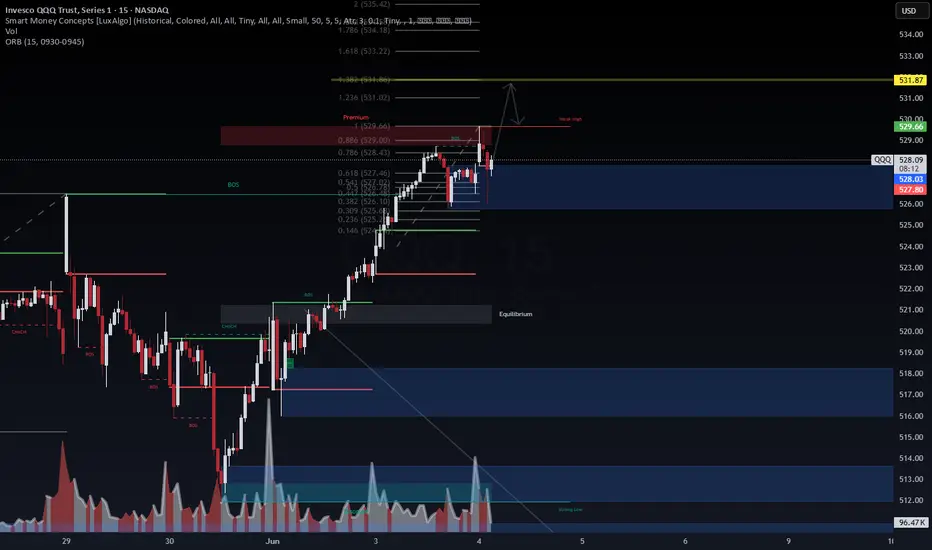
QQQ 15-min – Eyes on Key Liquidity ZonesWe’ve seen strong bullish structure with multiple BOS confirmations. Price is currently consolidating above the 0.618 retracement and reclaiming a previous FVG zone. Volume has cooled off, but key levels around 528.40–529.00 could be revisited soon.
If we reclaim the weak high with momentum, the path toward the 1.382–1.618 extensions (531.80–533.20) may open up. Until then, watching how price behaves around 527.50–526.10 for potential reaction.
🕵️♂️ No need to chase — the setup is developing. Sometimes patience is alpha.
📌 Levels to watch:
Liquidity: 529.00–529.66
Target zone: 531.87–533.22
Demand: 526.10–527.00
#QQQ #SMC #Fibonacci #Liquidity #TechStocks #WaverVanir #PriceAction #SmartMoney
SPY/QQQ Plan Your Trade For 6-3 : Carryover in Carryover modeToday's pattern suggests we may see more upward price consolidation/trending.
As many of you already know, I've been tracking the Excess Phase Peak pattern all the way up this incredible rally from the $480 lows on the SPY. In my opinion, we have moved into the "island" topping phase where price is struggling to break either upward or downward right now.
Currently, price seems to be attempting to break to the upside after yesterday's meltup. Today should be interesting because we could see solid REJECTION of yesterday's move with a big breakdown move. We'll see how things play out.
The SPY trend is still BULLISH based on my research. Thus, until and IF we get a breakdown, traders should continue to expect a MELT UP type of trend in the SPY/QQQ.
Hedging trades is a good idea right now.
Gold and Silver had a big move early this week and have not stalled into a sideways FLAGGING trend. By my estimates, the APEX of the flag will come near 1900-2100 today (Wednesday 6-3). That is when I think Gold/Silver will attempt to move into extreme volatility and attempt to make another big move.
I hope it is to continue the upside price trend, as this breakout move needs to push higher (breaking recent highs) for metals to move into a new dominant upward price trend.
BTCUSD is trading sideways - possibly setting up that DOUBLE-TOP pattern I suggested was going to take place on 5-20-25. Now, with Bitcoin leading the US markets by about 3-5 days (on average), we'll see if BTCUSD can attempt to move into another rally phase or if BTCUSD breaks below the $103k level and moves into a new downward price phase.
In my opinion, look out below.
Get some.
#trading #research #investing #tradingalgos #tradingsignals #cycles #fibonacci #elliotwave #modelingsystems #stocks #bitcoin #btcusd #cryptos #spy #gold #nq #investing #trading #spytrading #spymarket #tradingmarket #stockmarket #silver

IBIT — Ishares Bitcoin Trust. Under Bearish PressureThe iShares Bitcoin Trust ETF (IBIT) has been a mixed performer year to date, with its price up and down around 20 percent this year and currently tracking for low double-digit returns in 2025.
The ETF currently trades around $59.36–$60.40, with assets under management of around $68 billion and a 0.1 percent premium to net asset value (NAV).
1-Hour Technical Outlook
On the 1-hour time frame, technical indicators are mixed but generally bearish:
Moving Averages: Short-term moving averages (e.g. 200-hour SMA/EMA) are currently signaling a Sell signal as the price moved below these averages in late May.
Support and resistance: The ETF faces resistance around $61, corresponding to the broken 200-hour SMA, and support around $54, with stronger volume-based support around $47, corresponding to the beginning of the April rally.
RSI indicator: Over the last 20 days, the RSI(55) indicator has already been briefly noted below the baseline of 50, highlighting the need for more active risk management, since, as we can see from the chart, the indicator has again moved into the risk zone in late May and early June (where it currently remains), accordingly, for a longer term.
Volatility: During the recovery period in April-May 2025, the ETF demonstrated moderate intraday volatility (with half the 200-hour sigma value (σ) of about 3.5 percent), while the 20-hour decline on May 22-23, which exceeded this value, has provided at that time clear arguments for more active risk management.
To summarize, we can say that NASDAQ:IBIT is experiencing a pullback, technical indicators point to local persistence of bearish sentiment, following the classic, empirically proven adage of the financial market "Sell in May - and Go away."
--
Best wishes,
@PandorraResearch Team

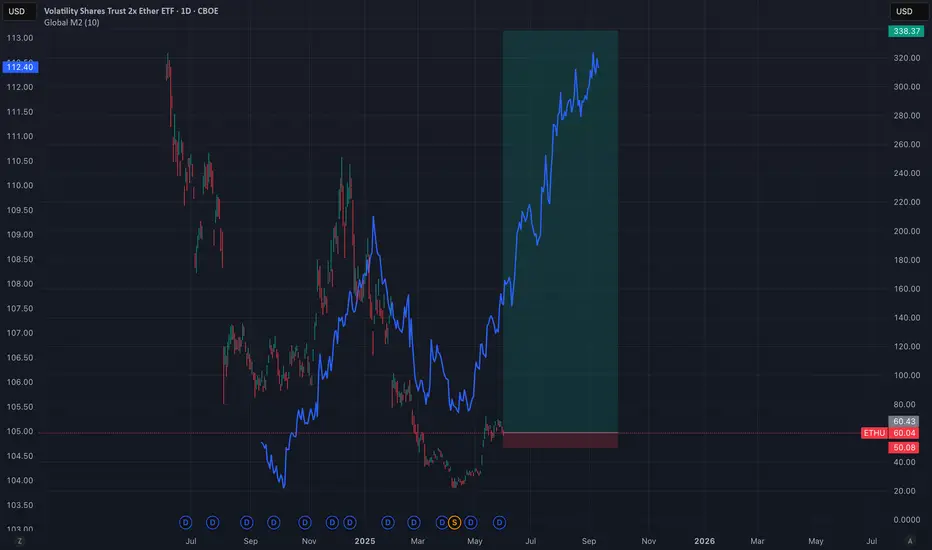
Great time to get into UVIXHorrible jobs numbers = "sh&t economy." Further validation that the last few days that S&P spiked were full of hot air. The economy is not doing well, and these are just lagging indicators, which means that actual problem is bigger. Default rates are higher than 2008, weakening dollar (9% since start of the year), high # of bankruptcies....the only thing keeping this afloat is QE and people's 401k chasing ETFs that will most all fall down since the correlation is weaker today than 5 years ago.
Best of luck and always do your own due diligence!

The MSCI World index sets a new all-time record!The MSCI World stock market index set a new all-time record during the trading session of Monday June 2, wiping out the entire stock market shock of February/March, which saw the global equity market lose 20%. This technical signal still needs to be confirmed at the end of the week at the next weekly technical close. If this bullish technical break were to be confirmed, then this would be a very positive signal for the global equity market, which is still hoping that trade diplomacy will lead to solid trade agreements between the USA and its main trading partners (China and the EU).
The chart below shows the weekly Japanese candlesticks of the MSCI World index.
1) Composition and calculation of the MSCI World index
The MSCI World Index (Morgan Stanley Capital International World Index) is a benchmark stock market index that measures the performance of large- and mid-cap equities in developed countries. Here are the main elements of its composition:
The MSCI World Index is a benchmark global stock market index that measures the performance of large- and mid-cap equities in 23 developed countries. Created by Morgan Stanley Capital International, it offers a global view of the equity markets in the most advanced economies. Among the countries included are the United States, Japan, the United Kingdom, France, Germany, Canada and Australia. The index comprises some 1,600 companies, with a strong dominance of the USA, which accounts for almost 70% of its total weighting. The most represented sectors are information technology, healthcare, financial services and consumer discretionary.
The MSCI World is calculated using a weighting method based on free-float market capitalization, i.e. taking into account only those stocks actually available for purchase on the markets. This means that companies with a higher market value and a larger free float have a greater influence on the index's performance. The MSCI World is updated regularly to reflect market developments and the entry or exit of companies.
Although it offers broad geographic diversification, it does not include emerging countries; these are covered by the MSCI ACWI index, which is also close to setting a new all-time record and is 13% composed of emerging countries (China, India, etc.).
2) Trade diplomacy and the FED's monetary policy outlook are key to keeping the global equity market bullish in the months ahead.
Trade diplomacy and the FED's monetary policy outlook are closely linked fundamental factors which have a direct impact on global equity market trends.
While the US inflation rate continues to trend towards the FED's 2% target, the FED is waiting for trade agreements to be signed to ensure that the risk of a second wave of inflation is averted, so that it can resume cutting the US federal funds rate.
These two fundamental conditions are essential if the global equity market is to confirm its new record highs over the coming months.
DISCLAIMER:
This content is intended for individuals who are familiar with financial markets and instruments and is for information purposes only. The presented idea (including market commentary, market data and observations) is not a work product of any research department of Swissquote or its affiliates. This material is intended to highlight market action and does not constitute investment, legal or tax advice. If you are a retail investor or lack experience in trading complex financial products, it is advisable to seek professional advice from licensed advisor before making any financial decisions.
This content is not intended to manipulate the market or encourage any specific financial behavior.
Swissquote makes no representation or warranty as to the quality, completeness, accuracy, comprehensiveness or non-infringement of such content. The views expressed are those of the consultant and are provided for educational purposes only. Any information provided relating to a product or market should not be construed as recommending an investment strategy or transaction. Past performance is not a guarantee of future results.
Swissquote and its employees and representatives shall in no event be held liable for any damages or losses arising directly or indirectly from decisions made on the basis of this content.
The use of any third-party brands or trademarks is for information only and does not imply endorsement by Swissquote, or that the trademark owner has authorised Swissquote to promote its products or services.
Swissquote is the marketing brand for the activities of Swissquote Bank Ltd (Switzerland) regulated by FINMA, Swissquote Capital Markets Limited regulated by CySEC (Cyprus), Swissquote Bank Europe SA (Luxembourg) regulated by the CSSF, Swissquote Ltd (UK) regulated by the FCA, Swissquote Financial Services (Malta) Ltd regulated by the Malta Financial Services Authority, Swissquote MEA Ltd. (UAE) regulated by the Dubai Financial Services Authority, Swissquote Pte Ltd (Singapore) regulated by the Monetary Authority of Singapore, Swissquote Asia Limited (Hong Kong) licensed by the Hong Kong Securities and Futures Commission (SFC) and Swissquote South Africa (Pty) Ltd supervised by the FSCA.
Products and services of Swissquote are only intended for those permitted to receive them under local law.
All investments carry a degree of risk. The risk of loss in trading or holding financial instruments can be substantial. The value of financial instruments, including but not limited to stocks, bonds, cryptocurrencies, and other assets, can fluctuate both upwards and downwards. There is a significant risk of financial loss when buying, selling, holding, staking, or investing in these instruments. SQBE makes no recommendations regarding any specific investment, transaction, or the use of any particular investment strategy.
CFDs are complex instruments and come with a high risk of losing money rapidly due to leverage. The vast majority of retail client accounts suffer capital losses when trading in CFDs. You should consider whether you understand how CFDs work and whether you can afford to take the high risk of losing your money.
Digital Assets are unregulated in most countries and consumer protection rules may not apply. As highly volatile speculative investments, Digital Assets are not suitable for investors without a high-risk tolerance. Make sure you understand each Digital Asset before you trade.
Cryptocurrencies are not considered legal tender in some jurisdictions and are subject to regulatory uncertainties.
The use of Internet-based systems can involve high risks, including, but not limited to, fraud, cyber-attacks, network and communication failures, as well as identity theft and phishing attacks related to crypto-assets.

QQQ Calls 6/3 527Retest Previous week high with a Hammer candle stick in premarket
Breaks Above Mondays high
Entry at market open for $527 calls
Target Previous week demand (527)
Got out because I though price was going to reverse back after it passed 524. I need to have confidence on my Trade and really wait it out for my SL and/or TP.

Nightly $SPY / $SPX Scenarios for June 4, 2025🔮 Nightly AMEX:SPY / SP:SPX Scenarios for June 4, 2025 🔮
🌍 Market-Moving News 🌍
🌐 Markets Rally on Chinese PMI Surprise
China’s Caixin Manufacturing PMI unexpectedly climbed to 50.8 in May, signaling expansion in smaller export-focused factories. Asian markets jumped, lifting U.S. equity futures as investors recalibrated global growth expectations .
📉 U.S. Factory Orders Remain Soft
April’s U.S. Factory Orders fell 0.4%, underscoring persistent weakness in industrial demand amid elevated input costs and trade uncertainty. Declines in durable-goods orders weighed on industrial stocks .
🏦 Fed’s Bowman to Speak on Economic Outlook
Fed Governor Michelle Bowman is scheduled to deliver remarks at 2:00 PM ET, likely emphasizing caution on future rate moves given mixed data. Markets will watch for any shifts in tone regarding inflation risks and labor-market resilience .
🛢️ Oil Prices Slip on Rising U.S. Inventories
U.S. crude inventories rose by 3.8 million barrels last week, according to API data, pressuring oil prices lower and dragging energy shares down as supply concerns outweighed strong demand signals .
📊 Key Data Releases 📊
📅 Wednesday, June 4:
2:00 PM ET – Fed Governor Michelle Bowman Speaks
Remarks on economic outlook and monetary policy, watched for any hints on the Fed’s next moves.
⚠️ Disclaimer:
This information is for educational and informational purposes only and should not be construed as financial advice. Always consult a licensed financial advisor before making investment decisions.
📌 #trading #stockmarket #economy #news #trendtao #charting #technicalanalysis

FREE STOCK ANALYSIS! Make Your Requests Below! $$The stock market is setting up for fireworks as we head into June! With sector rotations, breakout setups, and institutional volume quietly reappearing, it's time to dissect the charts and uncover the most asymmetric opportunities in equities right now.
Will June mark the start of a sustained bull run across growth names, or are we still trapped in a range of fakeouts and liquidity grabs? Let’s break it down with clean technical analysis, sharp macro context, and a disciplined eye.
🔹 Which stocks should I analyze?
🔹 Are we seeing real institutional accumulation or another bull trap?
🔹 Key price levels, trend shifts, demand zones, and risk-reward setups
Drop your favorite stock tickers in the comments , and I’ll provide a detailed fundamental analysis with technical insights — all grounded in current market conditions.
📅 Submission Deadline: JUNE 6th, 2025
🔹 Request Guidelines:
✅ Each member may submit one stock
✅ Use the format: AAPL, NVDA, TSLA, etc.
✅ U.S.-listed equities preferred (NASDAQ/NYSE)
Even in choppy environments, clarity creates confidence. The goal is to deliver at least 30 high quality stock analyses to help this community trade smarter, manage risk better, and stay positioned for what’s next.
⚠ Important Reminder:
All shared analyses are for educational purposes only and do not constitute financial advice. Always do your own research and risk assessment before acting on any ideas.
💡 When others hesitate, the sharpest traders position themselves. Let’s dissect this market, find the hidden gems, and capitalize on the setups others are too distracted to notice. 🔍📈
⚙️ Want these breakdowns delivered by AI that thinks like a hedge fund analyst?
Imagine if Warren Buffett had an AI assistant. That’s what I built. Try WallStreet Alchemist AI for completely free. Link in bio
In case you missed the latest analysis I published on NASDAQ:NVDA yesterday just before it exploded LIKE A BAZUKA today 🚀🚀🚀🚀, here it is
Let the analysis games begin!

SPY in Wave 5This week I am expecting a final rally to 608 to finish wave 5. SPY broke above 595.50 resistance today, but with RSI at incredibly high levels on the 1HR chart I am anticipating a minor pullback tomorrow and the final push up to occur Thursday and Friday. Jobless claims are released Thursday and unemployment rate released on Friday. These are the two major data points coming out this week that will likely drive the market upward to finish this final wave up. For the remainder of the month, I am looking for major selling to begin and will likely lead us down to the 530 gap fill.
Cheers

SPY Inverse Head & Shoulders Played Out Clean – Bounce from Buy Just wanted to follow up on the AMEX:SPY idea I published yesterday — this played out exactly as expected 👇🏾
We got that clean pullback right into the 588.50–589.90 buy zone, which aligned perfectly with high-volume support. From there, price reversed and gave us that upside move back toward 593+.
Even more validating: the pattern that formed was a textbook inverse head and shoulders
🔹 Left Shoulder → formed near 586
🔹 Head → at the deeper 585 level
🔹 Right Shoulder → bounced cleanly off the buy zone
🔹 Neckline Break → confirmed the move above 591.12
This is why I always say: have your levels ready and wait for confirmation. No chasing, just execution.
🔑 Buy zone held
📊 Volume-backed support
📈 Continuation in progress
Will continue monitoring for follow-through above 593.46. If bulls hold control, next resistance is near 596–597.

SPY Major Confluence ZoneSPY has a major upside confluence zone around 625
Looking for a test of this area in the coming weeks.
The level is about 5% away.
Let the melt up begin.

SPY New All Time Highs IncomingThe #SPY weekly chart is so bullish but don't take my word for it.
Simply look at the weekly bullish crossover that occurred between the 7 week & the 20 Week MA.
The last time this occurred was in Nov 2023 and the markets ripped 19% before having a major 3 week pullback and then another soaring continuation higher.

$SPY WILL 100% Hit ATH By End Of July! SPY is loaded up for a breakout run. All-time highs isn't even a question, but when is — and my bet is before July ends , honestly before end of June. In this idea, I go over key support levels, resistance zones, and the momentum shifts pointing toward a bullish continuation.

Bullish Intraday Patterns Everywhere!SPX had a wonderful intraday hourly chart confirmed breakout. This pattern is bullish and likely will continue higher.
The bulls tomorrow would love to confirm the daily chart breakout and will try to push for that.
SPY/SPX is holding more relative strength than the Q's & IWM which is displaying broad participation.
There are many bullish charts showing accumulation, golden crosses and bullish MA crossovers.
The DXY appears to be wanting to break down to around $97.00 which should yield more upside.
We secured profits today on SPY 594 calls & NVDA 144 calls.
We still remain net long and see the S&P 500 over $6000
Apple, XYZ, AI - are bullish setups were continuing to manage.

$SPY market COULD trend till nov25' (confirmation this month)I like to write today,
I see AMEX:SPY at a critical point right now, Im ultra long stocks and hedged today with a short AMEX:SPY ,
because:
We reached the target of a quarterly trend and didnt go higher for a long time.
We have a strange political situation which news affect the markets (more than usually) (positive and negative).
Were coiling at the top again after an insane rally from the lows.
But there are reasons to be bullish:
If we stay up this month we can form another longterm signal (6 month) until end of october and see an insane continuation rally. Target would be about 720 in AMEX:SPY and I guess its above all targets from US Banks for S&P.
Lets see whats coming and play it safe and with some calculated risks, its not safe out there but there are many oppurtunities.
1 step better every day, every week, every month and every year - my wish for you.

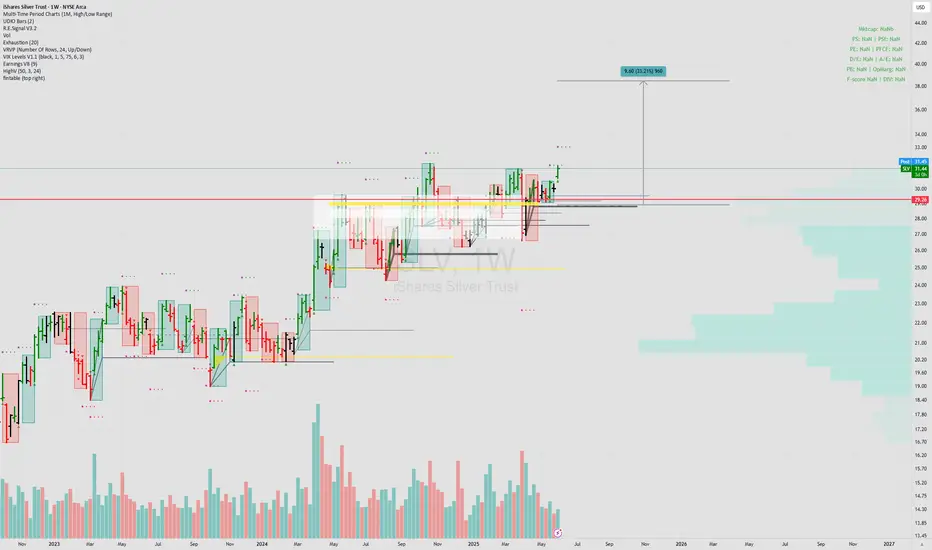
$SLV Silver could finally trend some longer timeframeAMEX:SLV finally show some strength and had a continuation day today, which is rare. I also see it as a good hedge or other position than stocks, which could react less to random moves (or maybe also not - calculate your risk on your own please)
My stop is the red line and I accumulated lower but still see it as a good entry if it stays up here.
Good luck!
$USO to $29-42 before a bottom is inAMEX:USO broke down from a long term that started in March 2020 and is now breaking down below support at $67.
The most likely outcome is a continuation down to the lower support levels at $29-33.
I won't rule out the possibility of one more retest of the trend line ($73-75) before continuing down further. An invalidation of the short would be a break over the $83 level.
Otherwise, downside is the most likely outcome from here.
Let's see how it plays out over the coming months.

Swing high on QQQ?My dowsing work is suggesting today is likely a swing high in indexes and there will be a few days down from around here. The level I expect on QQQ is just under 500. I've had some numbers as far as into the 80s as well, but not expecting that this go around.
I posted my roadmap for SPY as an idea for what to expect this week, and this is playing out so far. Today would be the "look above and fail", but we need to get the fail part! If it starts, then I think the target lower is valid.
I also will mention I get the number 6. That could be price or percent. If percent it's down to 495, which makes sense. In terms of price the last swing low was at 506.... idk we'll see.

SPY and DIA have reached the ML1 LevelsThe SPY and DIA have reached the ML1 Levels.
Always use stops...
Please Use Caution in Fast Moving Markets - Check Charts for Fast Moves
SYMBOL Trend ML 1 MS 1 IDMM Direction Date
SPY Long 595.12 589.56 LONG 2025-06-03
DIA Long 424.85 421.29 LONG 2025-06-03

SPY/QQQ Plan Your Trade For 6-3 : BreakAway In Trend ModeToday's pattern suggests the SPY/QQQ will attempt to move into a Breakaway type of pattern. I believe that Breakaway may be to the downside, but I could be wrong.
Price has been struggling in a sideways consolidated range over the past 2+ weeks. I believe this range sets up an "Island" type of price formation that is indicative of a topping type of pattern.
Currently, I'm tracking layers of different TA techniques to try to see how price may react in the future. Right now, price appears to be trapped within a range, has recently broken below the STDDEV channel, and may be moving into a very volatile FAILURE/REJECTION phase.
This is where price may attempt to resume trending (up or down) and I believe the move logical move is to the downside at this point.
Gold/Silver had a HUGE MOVE yesterday and are not contracting a bit. I still believe Metals will rally higher and attempt to break to new ATH levels.
BTCUSD is trapped in a sideways price range after reaching new ATH levels recently. Many of you are aware I'm expecting a rollover-top pattern to setup in BTCUSD (and the US markets) and I believe it is just a matter of time to see how the markets react to policies, news, and economic function/data.
Should be an interesting (possibly sideways) day today.
Get some.
#trading #research #investing #tradingalgos #tradingsignals #cycles #fibonacci #elliotwave #modelingsystems #stocks #bitcoin #btcusd #cryptos #spy #gold #nq #investing #trading #spytrading #spymarket #tradingmarket #stockmarket #silver

$QQQ // June 3 2025 // Analysis & Targets for Day TradersNASDAQ:QQQ // June 3 2025 // Analysis & Targets for Day Traders
Look at that sideways consolidation back to the 30min 200MA
