SPY Inverse Head & Shoulders Played Out Clean – Bounce from Buy Just wanted to follow up on the AMEX:SPY idea I published yesterday — this played out exactly as expected 👇🏾
We got that clean pullback right into the 588.50–589.90 buy zone, which aligned perfectly with high-volume support. From there, price reversed and gave us that upside move back toward 593+.
Even more validating: the pattern that formed was a textbook inverse head and shoulders
🔹 Left Shoulder → formed near 586
🔹 Head → at the deeper 585 level
🔹 Right Shoulder → bounced cleanly off the buy zone
🔹 Neckline Break → confirmed the move above 591.12
This is why I always say: have your levels ready and wait for confirmation. No chasing, just execution.
🔑 Buy zone held
📊 Volume-backed support
📈 Continuation in progress
Will continue monitoring for follow-through above 593.46. If bulls hold control, next resistance is near 596–597.
ETF market

SPY Major Confluence ZoneSPY has a major upside confluence zone around 625
Looking for a test of this area in the coming weeks.
The level is about 5% away.
Let the melt up begin.

SPY New All Time Highs IncomingThe #SPY weekly chart is so bullish but don't take my word for it.
Simply look at the weekly bullish crossover that occurred between the 7 week & the 20 Week MA.
The last time this occurred was in Nov 2023 and the markets ripped 19% before having a major 3 week pullback and then another soaring continuation higher.

$SPY WILL 100% Hit ATH By End Of July! SPY is loaded up for a breakout run. All-time highs isn't even a question, but when is — and my bet is before July ends , honestly before end of June. In this idea, I go over key support levels, resistance zones, and the momentum shifts pointing toward a bullish continuation.

Bullish Intraday Patterns Everywhere!SPX had a wonderful intraday hourly chart confirmed breakout. This pattern is bullish and likely will continue higher.
The bulls tomorrow would love to confirm the daily chart breakout and will try to push for that.
SPY/SPX is holding more relative strength than the Q's & IWM which is displaying broad participation.
There are many bullish charts showing accumulation, golden crosses and bullish MA crossovers.
The DXY appears to be wanting to break down to around $97.00 which should yield more upside.
We secured profits today on SPY 594 calls & NVDA 144 calls.
We still remain net long and see the S&P 500 over $6000
Apple, XYZ, AI - are bullish setups were continuing to manage.

$SPY market COULD trend till nov25' (confirmation this month)I like to write today,
I see AMEX:SPY at a critical point right now, Im ultra long stocks and hedged today with a short AMEX:SPY ,
because:
We reached the target of a quarterly trend and didnt go higher for a long time.
We have a strange political situation which news affect the markets (more than usually) (positive and negative).
Were coiling at the top again after an insane rally from the lows.
But there are reasons to be bullish:
If we stay up this month we can form another longterm signal (6 month) until end of october and see an insane continuation rally. Target would be about 720 in AMEX:SPY and I guess its above all targets from US Banks for S&P.
Lets see whats coming and play it safe and with some calculated risks, its not safe out there but there are many oppurtunities.
1 step better every day, every week, every month and every year - my wish for you.

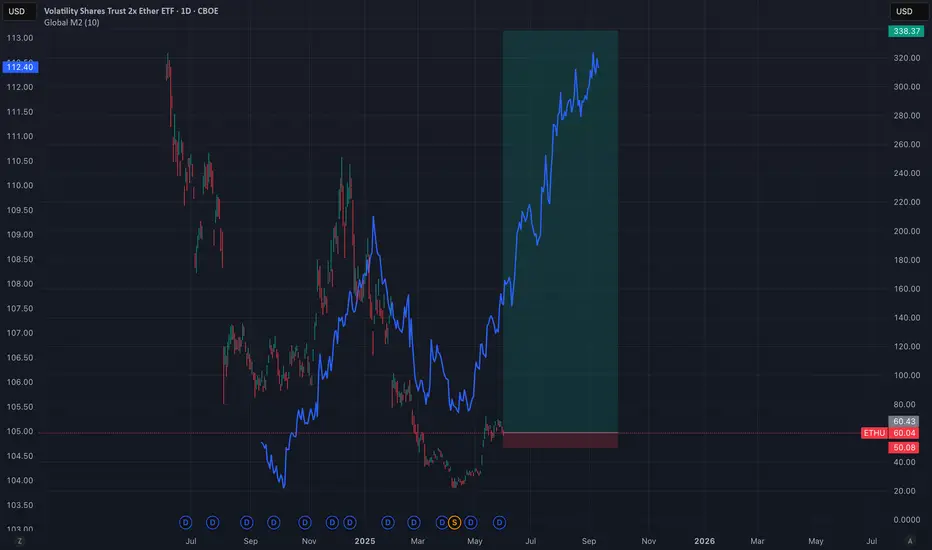
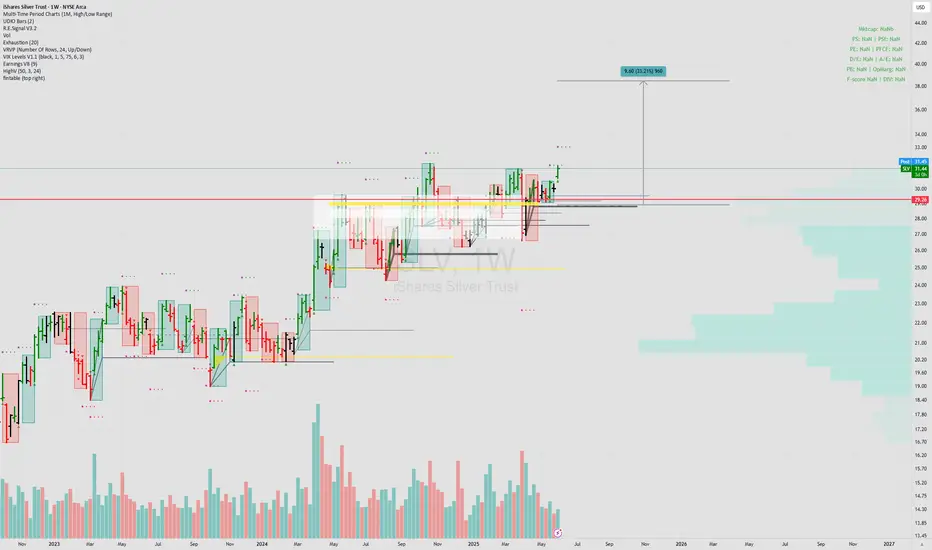
$SLV Silver could finally trend some longer timeframeAMEX:SLV finally show some strength and had a continuation day today, which is rare. I also see it as a good hedge or other position than stocks, which could react less to random moves (or maybe also not - calculate your risk on your own please)
My stop is the red line and I accumulated lower but still see it as a good entry if it stays up here.
Good luck!
$USO to $29-42 before a bottom is inAMEX:USO broke down from a long term that started in March 2020 and is now breaking down below support at $67.
The most likely outcome is a continuation down to the lower support levels at $29-33.
I won't rule out the possibility of one more retest of the trend line ($73-75) before continuing down further. An invalidation of the short would be a break over the $83 level.
Otherwise, downside is the most likely outcome from here.
Let's see how it plays out over the coming months.

Swing high on QQQ?My dowsing work is suggesting today is likely a swing high in indexes and there will be a few days down from around here. The level I expect on QQQ is just under 500. I've had some numbers as far as into the 80s as well, but not expecting that this go around.
I posted my roadmap for SPY as an idea for what to expect this week, and this is playing out so far. Today would be the "look above and fail", but we need to get the fail part! If it starts, then I think the target lower is valid.
I also will mention I get the number 6. That could be price or percent. If percent it's down to 495, which makes sense. In terms of price the last swing low was at 506.... idk we'll see.

SPY and DIA have reached the ML1 LevelsThe SPY and DIA have reached the ML1 Levels.
Always use stops...
Please Use Caution in Fast Moving Markets - Check Charts for Fast Moves
SYMBOL Trend ML 1 MS 1 IDMM Direction Date
SPY Long 595.12 589.56 LONG 2025-06-03
DIA Long 424.85 421.29 LONG 2025-06-03

SPY/QQQ Plan Your Trade For 6-3 : BreakAway In Trend ModeToday's pattern suggests the SPY/QQQ will attempt to move into a Breakaway type of pattern. I believe that Breakaway may be to the downside, but I could be wrong.
Price has been struggling in a sideways consolidated range over the past 2+ weeks. I believe this range sets up an "Island" type of price formation that is indicative of a topping type of pattern.
Currently, I'm tracking layers of different TA techniques to try to see how price may react in the future. Right now, price appears to be trapped within a range, has recently broken below the STDDEV channel, and may be moving into a very volatile FAILURE/REJECTION phase.
This is where price may attempt to resume trending (up or down) and I believe the move logical move is to the downside at this point.
Gold/Silver had a HUGE MOVE yesterday and are not contracting a bit. I still believe Metals will rally higher and attempt to break to new ATH levels.
BTCUSD is trapped in a sideways price range after reaching new ATH levels recently. Many of you are aware I'm expecting a rollover-top pattern to setup in BTCUSD (and the US markets) and I believe it is just a matter of time to see how the markets react to policies, news, and economic function/data.
Should be an interesting (possibly sideways) day today.
Get some.
#trading #research #investing #tradingalgos #tradingsignals #cycles #fibonacci #elliotwave #modelingsystems #stocks #bitcoin #btcusd #cryptos #spy #gold #nq #investing #trading #spytrading #spymarket #tradingmarket #stockmarket #silver

$QQQ // June 3 2025 // Analysis & Targets for Day TradersNASDAQ:QQQ // June 3 2025 // Analysis & Targets for Day Traders
Look at that sideways consolidation back to the 30min 200MA

SPY: Bullish Outlook Based on Market StructureETF Strategy: Still Buying for 2025 Growth
I'm continuing to buy SPY and adding other strong ETFs like VEA, QQQ, and TQQQ. The market structure looks solid after the recent bounce, and I’m positioning for continued growth through the rest of 2025. My goal is to close the year with a strong percentage gain.

19.45This channel is not providing individualized trading or investment advice, nor is it a banking service, brokerage service, trading service, investment service or money management

SPY 1HR Pullback to Volume Buy Zone Before Bullish ContinuationI’m watching the 588.52–589.94 range as a high-probability buy zone on the SPY 1-hour chart. This zone aligns with a strong volume shelf, indicating prior institutional accumulation and heavy transaction flow.
After a sharp move into the 591s, we’re seeing some hesitation and potential for a healthy pullback. The plan is to wait for price action to return to the buy zone, show signs of strength (e.g., hammer candle, strong bounce), and look for a continuation toward the previous high of 593.46 and possibly higher.
🔹 Buy Zone: 588.52–589.94
🔹 Volume Profile Support: High node at ~589
🔹 Resistance: 591.12 short-term, then 593.46
🔹 Stop Loss: Below 586.76 to avoid false breakouts
🔹 Target: 593.50+ with higher timeframe continuation in mind

SPY (S&P500 ETF) - Price Testing Resistance Trendline - DailySPY (S&P500 ETF) price is currently testing a resistance trendline above ($593 to $595 price levels).
SPY price in the medium-term has been uptrending since April and May 2025.
SPY price in the short-term has been consolidating sideways, and a large volume breakout or breakdown has not occurred yet.
The 12EMA (blue line) has been holding as support for 5 trading days. Resistance targets to the upside would be $598 to $600.
The grey gap and the 26EMA (purple line) are downside support targets if a rally does not occur this month ($576 to $567).
Breaking news and tariff trade deals are supposed to occur in June and July 2025.

Asset Bought: SPDR GOLD SHARES Symbol: GLD Exchange: US PurchasAsset Bought: SPDR GOLD SHARES
Symbol: GLD
Exchange: US
Purchased at Market Value: USD $312.31
Capital Allocation: 9.1%
Date: 3-Jun-25

600 before 580?, Jolts, Jobs Data, calling China🎮 What’s Happening Now:
1. The market trades like a simulation.
Levels get hit to the penny and reverse.
Fake breakouts, engineered sweeps, and chop-fests designed to trigger stops and crush premium.
It’s like trading inside a casino that reads your mind and moves the exit every five minutes.
2. AI + HFT firms front-run sentiment and order flow.
They scan Reddit, Discord, X, TradingView, and even order book imbalances in real time.
The second you find an edge, they’re already there—front-running or fading it.
3. Implied volatility and option decay weaponized.
They bait you in with movement, then nuke premiums before you can cash out.
If you're not closing green trades fast, they flip red—"correct trades, wrong time frame" syndrome.
⚖️ What Retail Is Up Against:
Smart order routers sniffing your orders.
Liquidity gaps intentionally created then filled.
Volume surges that mean nothing—just decoys.
AI-driven volume clusters that draw you in and dump you out.
💡 What some traders are doing to adapt:
Selling premium with iron condors, calendars, butterflies—less directional, more probability-based.
Trading futures or futures options, where fills are better and data is cleaner.
Sniping high-R:R setups, holding nothing overnight unless it's ironclad.
Using AI to fight AI—some build their own bots to scan volume shifts, OI skews, or gamma pins.

Nightly $SPY / $SPX Scenarios for June 3, 2025 🔮 Nightly AMEX:SPY / SP:SPX Scenarios for June 3, 2025 🔮
🌍 Market-Moving News 🌍
🏭 U.S. Manufacturing Slump Persists
U.S. manufacturing contracted for the third consecutive month in May, with new orders, backlogs, production, and employment all declining. Trade-war disruptions and elevated input costs continue to squeeze factory margins, setting the stage for today’s ISM Manufacturing PMI release
🌐 Global Trade Tensions Weigh on Stocks
Renewed U.S.–China tariff threats sent the S&P 500 lower overnight, as investors fear higher costs for exporters and slower global growth. Futures pointed to another rough open for $SPY/ SP:SPX
📈 China Caixin PMI Exceeds Expectations
China’s May Caixin Manufacturing PMI unexpectedly rose to 50.8, signaling stabilization in export-oriented factories despite ongoing trade uncertainty. That positive surprise may offer some support to Asian equities today
📊 Key Data Releases 📊
📅 Tuesday, June 3:
8:30 AM ET – ISM Manufacturing PMI (May) Measures U.S. factory-sector health; readings below 50 indicate contraction. Today’s survey will confirm if the May downturn persists.
10:00 AM ET – Construction Spending (April) Tracks monthly change in total construction outlays—an important gauge of housing and infrastructure investment trends.
1:00 PM ET – 10-Year Treasury Note Auction Benchmark auction that influences the yield curve. Weak demand or higher yields here can pressure equities, especially growth-oriented sectors.
⚠️ Disclaimer:
This information is for educational and informational purposes only and should not be construed as financial advice. Always consult a licensed financial advisor before making investment decisions.
📌 #trading #stockmarket #economy #news #trendtao #charting #technicalanalysis

Rally Maybe As of know we in n mans land
have to wait see we break 613 I think they do
why QE behind the scene
have a hedge in case we drop

USO Stock Chart Fibonacci Analysis 060225Trading Idea
1) Find a FIBO slingshot
2) Check FIBO 61.80% level
3) Entry Point > 67.8/61.80%
Chart time frame:B
A) 15 min(1W-3M)
B) 1 hr(3M-6M)
C) 4 hr(6M-1year)
D) 1 day(1-3years)
Stock progress:A
A) Keep rising over 61.80% resistance
B) 61.80% resistance
C) 61.80% support
D) Hit the bottom
E) Hit the top
Stocks rise as they rise from support and fall from resistance. Our goal is to find a low support point and enter. It can be referred to as buying at the pullback point. The pullback point can be found with a Fibonacci extension of 61.80%. This is a step to find entry level. 1) Find a triangle (Fibonacci Speed Fan Line) that connects the high (resistance) and low (support) points of the stock in progress, where it is continuously expressed as a Slingshot, 2) and create a Fibonacci extension level for the first rising wave from the start point of slingshot pattern.
When the current price goes over 61.80% level , that can be a good entry point, especially if the SMA 100 and 200 curves are gathered together at 61.80%, it is a very good entry point.
As a great help, tradingview provides these Fibonacci speed fan lines and extension levels with ease. So if you use the Fibonacci fan line, the extension level, and the SMA 100/200 curve well, you can find an entry point for the stock market. At least you have to enter at this low point to avoid trading failure, and if you are skilled at entering this low point, with fibonacci6180 technique, your reading skill to chart will be greatly improved.
If you want to do day trading, please set the time frame to 5 minutes or 15 minutes, and you will see many of the low point of rising stocks.
If want to prefer long term range trading, you can set the time frame to 1 hr or 1 day.

SPY/QQQ Plan Your Trade For 6-2 : Post Market UpdateHuge move for metals today. Absolutely incredible.
Hope you GOT SOME.
BTCUSD and the SPY/QQQ stalled somewhat flat today. SPY was up 0.50% - nothing huge.
Going to be interesting to see how things play out in the Asian/European markets tonight.
Buckle up. Could be some very big moves hitting this week.
GET SOME.
#trading #research #investing #tradingalgos #tradingsignals #cycles #fibonacci #elliotwave #modelingsystems #stocks #bitcoin #btcusd #cryptos #spy #gold #nq #investing #trading #spytrading #spymarket #tradingmarket #stockmarket #silver
