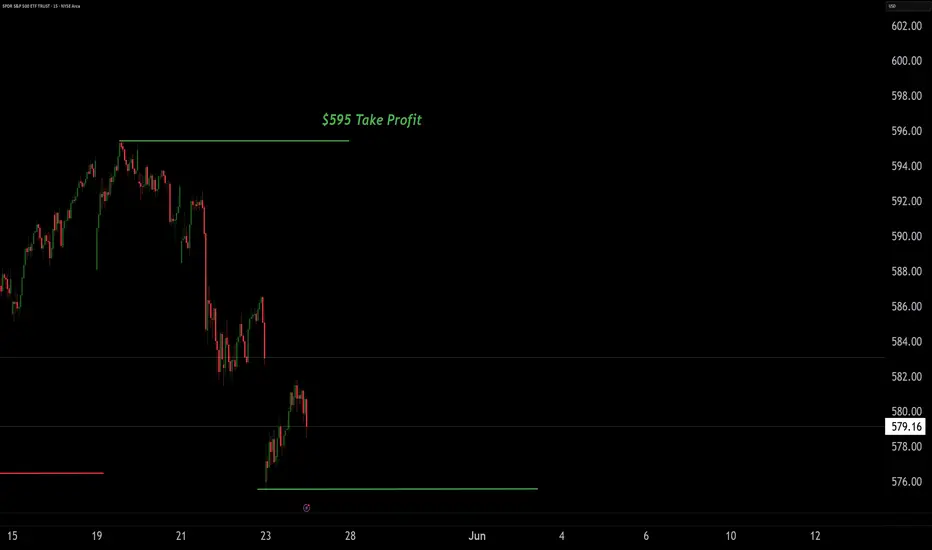
$SPY demand zone: Chinese+Canada+Mexican tariffsDaily SPY demand zone is $581-$586, lots of buys within that range. We´d need a major and negative catalyst to break lower than that, especially with the daily 200ma @$577.
Worsening China tariff and regressive trade news next week to push SPY to it´s $577 200 MA or at least some positive news from the Canadian and Mexican pause ending June 9th to at least continue to hold us at the higher end of the range ?
ETF market

GAP Fill on the table. We going lower according to the DSSDSS predicted the right moment in time. Time series analysis combined with my technical insight could be my edge that's working right now.
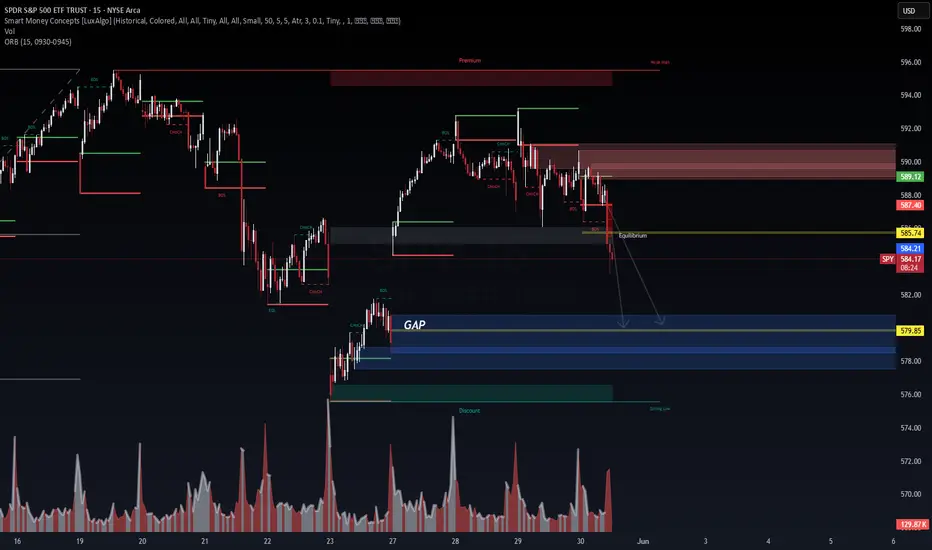
SPY Breakdown Watch – Smart Money Concepts (1H Chart)🔎 Chart: SPY | TradingView 1H
At Wavervanir International LLC, our discretionary analysis on SPY (S&P 500 ETF) using SMC + ORB logic is signaling potential downside.
🔍 Market Structure:
CHoCH (Change of Character) confirmed after BOS (Break of Structure), suggesting buyer exhaustion.
Premium zone rejection with multiple failed attempts to reclaim the weak high.
Liquidity has shifted toward discount zones, aligning with volume imbalance and OB zones below.
🎯 Target Zones:
Immediate liquidity pool: 579.85
Demand block confluence: 575–565 zone
Deep mitigation OB: 560–557.50 zone
📊 Macro Context:
Bond volatility rising (MOVE index)
Fed holding rates steady, inflation stickiness remains
Liquidity tightening into quarter-end
🧠 Strategic View:
SPY looks poised to fill inefficiencies into the 575–565 range unless macro tailwinds emerge. Volume supports this as market seeks equilibrium post-premium rejection.

UVIX looking real sweet! VIX has a very unique quality, which is that it bottoms-out! The VIX is in a very nice place right now. Already did 3 trades over the last week ranging from 4 to +10%. I can't think of a better ETF to trade in times of uncertainty and risk. I'll be providing alerts for those who are interested in upgrading to steak vs. rice and beans FOMO crypto bros!
Best of luck and always do your own due diligence! Nothing makes me more happy than to see average Joes and Janes beat the S&P and overpriced FAs.

SPY: Maybe today we could see this. Just a random thought and analysis. Would be fun if we see this waterfall today.

SUPER CYCLE TOP SOON IGV WAVE 5 The chart posted is by far the strongest chart within the market and has a clean wave structure from an Elliot Wave view . I have now taken a position for the last wave and will exit and go 100 % short all markets once the 5th wave has reached the targets min 106.7 to ideal target is 111 zone this should be seen based on my work in spiral cycle top is due 2.5 TD days from today with the alt on June 6/9 best of trades WAVETIMER

Qqq... almost timeIn the coming the tech sector will rollover and correct 10-12% in the month of june.
This will represent a 50% retrace from April lows
Weekly RSI is tagging Divergence resistance
www.tradingview.com
This space has only room enough to chop around for another few days so I'm thinking some news either comes out over the weekend or next weeks eco data comes out and causes a flush and break of this wedge
The immediate move would be to the 200ma or 495, from there I expect a bounce back to 505-508 before the next leg down
A break and close above 530 would negate this short..
I will go over some of the tech Sectors this weekend..
Don't swing any direction until this wedge is decided, will be choppy and annoying.. Theta decay heavy for 0dte.
Just have patience and fade the pops.. all the signs are there. I've notice a rotation into heath ,utilities and defensive all week despite qqq making new highs
If we happen to close below or near 515 that would leave us with a weekly reversal candle

2007 Top /2025 day 38td t-minus 2.5 days Major TOP The chart in focus is the 2007 chart we are now day 38 in the pattern and in 2007 we took 40td to make a new high And I have posted my models .I see the next rally to reach anywhere from 6035/on the low end to 6177 on the high end focus 6147 where Ax 1.618 = wave C or 3 Best of trades WAVETIMER

Opening (IRA): SPY September 19th 500 Short Put... for a 5.02 credit.
Comments: Adding at intervals at strikes better than what I currently have on, targeting the <16 delta strike paying around 1% of the strike price in credit. Will look to manage positions as I come to them.

$SPY // May 30 2025 // Analysis & Targets for Day TradersAMEX:SPY // May 30 2025 // Analysis & Targets for Day Traders

$SMH vs $HACK: Recent good correlation with breakout potentialMany market watchers will say that Semis are the most important stocks in the market. Semis are great from a market direction perspective. They are the best to indicate a downturn and the fastest to recover during a bull run. In this blog we have appreciated the relative resilience of the Cybersecurity stocks during the recent bear market. The cybersecurity ETF AMEX:HACK fell only 25 % during the 2025 bear market. NASDAQ:SMH fell almost 40% and NASDAQ:SMH / AMEX:HACK fell 35% which indicated the relative underperformance of Semis vs Cybersecurity in April. But form the lows of ‘Liberation Day’ NASDAQ:SMH and AMEX:HACK are trading with perfect correlation. But the question comes will NASDAQ:SMH claim the leadership and outperform AMEX:HACK if this bull market continues.
In the last 2024 Bull market NASDAQ:SMH significantly outperformed the $HACK. We are probably in the early days of this breakout outperformance. So. In my opinion in the near term NASDAQ:SMH outperforms $HACK. The ratio is at 96%. The ratio might touch the previous cycle highs of 160% if the momentum continues.
Verdict: NASDAQ:SMH outperforms AMEX:HACK in near term. Buy NASDAQ:SMH ; Hold AMEX:HACK

SPY/QQQ Plan Your Trade for 5-30 : CRUSH PatternToday's CRUSH pattern should result in a continued downward price trend in my analysis is accurate. I have seen CRUSH pattern trend upward sometimes. So, please understand I'm reading the chart and pattern as a rolling top type of pattern leading to a CRUSH (downward) price trend today.
I highlight the potential for a FAILED CRUSH (downward) price bar - whereas a reversion back to the upside is a potential. But, I estimate that potential at only 20-25% at this time.
My analysis suggests the breakdown in price will likely continue, and we'll likely see the SPY/QQQ/Bitcoin continue to try to trend downward.
Gold and Silver are moving into a fairly solid Gap-Stall-Revert-Flush pattern that may see Gold attempt to rally back above $3400 today. Silver is currently trading very close to a STDDEV Reversion level, so Silver may not see a big move today (like Gold).
I'm hopeful we start to see a big breakaway move in Gold/Silver today and carry into next week.
My TTScanner algos generated new BUY triggers for GDX, GDXJ, and NUGT yesterday. That's a very good sign we are getting into a BUY/BULLISH mode in metals again.
I got up late today. Somehow, my alarms got turned off.
Happy Friday.
Get some.
#trading #research #investing #tradingalgos #tradingsignals #cycles #fibonacci #elliotwave #modelingsystems #stocks #bitcoin #btcusd #cryptos #spy #gold #nq #investing #trading #spytrading #spymarket #tradingmarket #stockmarket #silver

Finally A pull Back But How FarOk guys bad news on market; what we need is another 1 day or 2 sell off to be confirm direction change
I believe gaps will be filled if they past the fill part then bye bye market

Nightly $SPY / $SPX Scenarios for May 30, 2025🔮 Nightly AMEX:SPY / SP:SPX Scenarios for May 30, 2025 🔮
🌍 Market-Moving News 🌍
🤝 Debt-Ceiling Deal Advances
The U.S. House passed a bipartisan framework extending the federal borrowing limit through September, easing immediate default fears and lifting risk assets.
📉 Bond Yields Retreat
After surging above 4.6% earlier this week, the 10-year Treasury yield dipped back toward 4.5%, helping equities recover from recent rate-driven pullbacks.
⛽ Oil Inventories Jump
API data showed a 5.2 million-barrel build in U.S. crude stocks last week, sending oil prices lower and weighing on energy sector names.
🚗 Tesla Price Cut Spurs EV Rally
Tesla ( NASDAQ:TSLA ) cut Model 3 prices by 3% in the U.S., igniting a broader EV stock rally as investors priced in renewed demand ahead of summer driving season.
📊 Key Data Releases 📊
📅 Friday, May 30:
8:30 AM ET: Personal Consumption Expenditures (PCE) Price Index for April
Measures core inflation trends—Fed’s preferred gauge of consumer-price pressures.
10:00 AM ET: Pending Home Sales for April
Tracks signed contracts on existing homes; a leading indicator for the housing market.
⚠️ Disclaimer:
This information is for educational and informational purposes only and should not be construed as financial advice. Always consult a licensed financial advisor before making investment decisions.
📌 #trading #stockmarket #economy #news #trendtao #charting #technicalanalysis

TOP WAVE COUNT QQQ or SPY both same We had a higher high in the futures at 4 am . since that point we have declining I look for the market to still reach that price .But I know there was a lot of selling overnight today is day 37td since low

$TLT breaking down? $80 target?TLT looks to be breaking down out of a bear flag.
We've already had multiple touches of the lower trend line and now it looks like price has broken through.
I think the most likely target is $79-80, but I've included multiple supports just incase we see a larger move than I'm expecting.
I'm looking to buy those levels should they hit as I think we'll see a longer term bullish move afterwards.


DIA has reached the MS1 LevelThe DIA has reached the MS1 Level at 420.77
This level being reached is a good indication that the short-term intra-day direction is down.

The TACO Trade Is Back!🌮 AMEX:SPY
📊 The Setup:
The TACO trade ("Trump Always Chickens Out") continues to prove its resilience in the face of trade war headlines. The market dips sharply when tariffs are announced, and then surges back up as the news cycle turns, with Trump pausing or reversing his decisions.
We’ve seen multiple examples of this year-to-date on the AMEX:SPY chart:
🔹 Trump Pauses Tariffs for Canada & Mexico – market bounces.
🔹 Trump Pauses Most Liberation Day Tariffs – another bounce.
🔹 Trump Floats Lowering Tariffs on China – bounce continues.
🔹 Trump Pushes Back EU Tariffs to July – market rips higher.
It’s as if every tariff tantrum is followed by an inevitable rebound. Could this be the pattern to trade around for the next few months?
At this point, it almost feels like we’re watching a predictable movie. Every new threat to impose tariffs or spark a trade war is just a scene in the “TACO” storyline, and the markets are starting to get used to the plot twist.
Are we playing into an endless loop of fear and relief? Is this time different, or just the same old TACO? How much longer can we trust that the market will “chicken out” and bounce back every time tariffs are floated?


CHILE Stock Market Technical and Fundamental PerspectivesChile’s stock market is primarily represented by several key indices, each with distinct characteristics and coverage:
IGPA (Índice General de Precios de Acciones) BCS:SPCLXIGPA
The IGPA is the broadest and most representative index, covering the majority of stocks traded on the Santiago Stock Exchange. It is a capitalization-weighted index, revised annually, and includes companies across all major sectors of the Chilean economy. As of May 2025, the IGPA reached a historic high of over 42,000 points, reflecting robust market performance.
IPSA (Índice de Precios Selectivo de Acciones) BCS:SP_IPSA
The IPSA is a more focused index, comprising the 40 most heavily traded stocks on the Santiago Stock Exchange. It is revised quarterly and serves as the benchmark for large-cap Chilean equities.
S&P/CLX INTER Index 10 BCS:SPCLXIN10
This index tracks the 10 main Chilean stocks that also have American Depositary Receipts (ADRs) listed abroad, providing a bridge between local and international investors.
STOXX® Chile Total Market Index
This index aims to cover approximately 95% of Chile’s free-float market capitalization, with top components including major companies such as Falabella, Banco de Chile, LATAM Airlines Group, Cencosud, Banco Santander Chile, Empresas Copec, and Sociedad Química y Minera de Chile (SQM).
Key Components
The leading companies in Chile’s indices span various sectors:
Financials: Banco de Chile, Banco Santander Chile, Banco de Crédito e Inversiones
Retail: Falabella, Cencosud
Utilities/Energy: Enel Américas, Empresas Copec
Mining/Chemicals: Sociedad Química y Minera de Chile (SQM)
Forestry/Paper: Empresas CMPC
Airlines: LATAM Airlines Group
Long-Term Technical Perspective and Recent Trends
The Chilean stock market, as reflected by the IGPA and IPSA, has experienced a strong rally in 2025, with the major indices gaining over 25% year-to-date
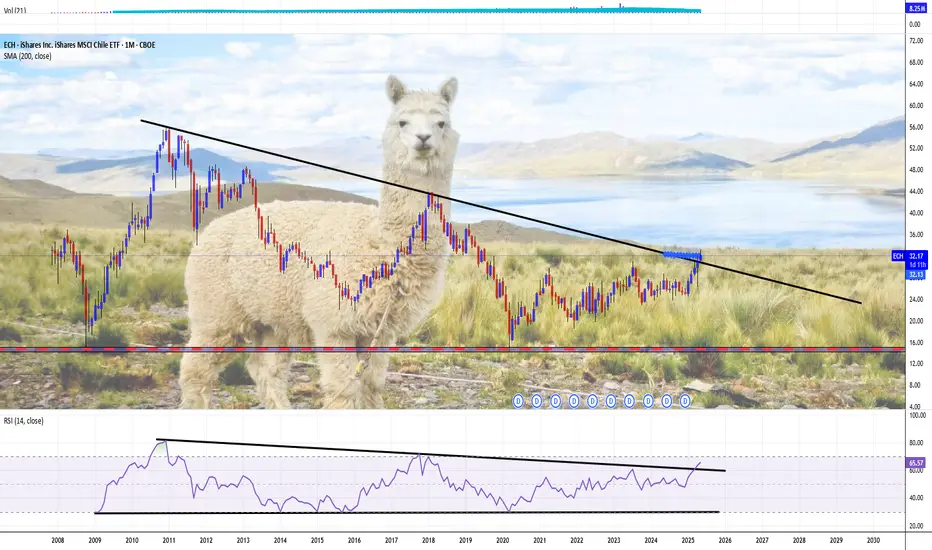
The MSCI Chile index currently presents a mixed technical picture. While long-term moving averages (200-day) signal a "buy," shorter-term indicators (5-100 day) are on "sell," and several oscillators (RSI, Stochastic, MACD) indicate oversold conditions or continued selling pressure.
This suggests that, despite the recent rally, some short-term consolidation or correction could occur, but the long-term trend remains constructive.
Fundamental breakdown
The Santiago Stock Exchange’s market capitalization stands at approximately $187 billion, with a price-to-earnings (P/E) ratio of 12.08, which is below both the emerging markets average (14.3) and the global average (22.12).
This relatively low valuation, even after a significant rally, suggests Chilean equities remain attractive on a fundamental basis.
The Chilean economy is projected to grow by 2.3% in 2025. Inflation has moderated to 4.5%, and the central bank’s benchmark interest rate is stable at 5%.
The banking sector is particularly robust, with Banco de Chile reporting a 14.2% year-over-year increase in net income for Q1 2025.
The mining sector, especially lithium, is poised for growth following major investments and Chile’s strategic push to regain global leadership in lithium production.
The combination of strong fundamentals, sectoral diversity, and attractive valuations positions Chile’s stock market for steady long-term growth, though short-term volatility is possible as global and local conditions evolve.
Conclusion
Chile’s stock market demonstrates strong long-term potential, underpinned by solid economic fundamentals, sectoral strengths, and attractive valuations, though investors should remain mindful of cyclical corrections and global market influences.
Thу main technical chart for CBOE:ECH - iShares MSCI Chile ETF (total return) points on massive 200-months SMA breakthrough, attempts to break long term 'descending top/ flat bottom' technical figure.
--
Best wishes,
@PandorraResearch Team 😎
#NiftyBees - What does it Say?Date: 29-05-2025
#NIFTYBEES Current Price: 277.50
#NIFTYBEES Pivot Point: 279.6
Upside Targets: 291.81 298.01 304.91 311.82
Downside Targets: 267.39 261.17 254.26 247.35
Support: 273.61
Resistance: 285.61

Spy Monthly Close $595-$602📈 May is on track to close bullish with projected levels of $595–$602.
This move is backed by the AlphaPulse™ Trading System:
– Momentum signals confirm multi-timeframe strength
– Anchored VWAP reclaimed from April highs
– MACD bull cross + RSI holding strong (60–70 zone)
– Price above SMA50/200 with elevated volume
– Fibonacci 1.618 aligns with $602 target
When anchored VWAP, MACD, RSI, volume, fibs, and AlphaPulse all align bullishly — and price structure supports clean higher lows — the probability of a May close between $595 and $602 becomes statistically favorable.
📈 Thesis Probability and Conditional Breakdown
🔷 Bullish Probability Estimate (May Close $595–$602):
📊 68% Probability of bullish continuation into $595–$602
Based on:
Multi-timeframe confluence (MACD, RSI, AVWAP)
No bearish divergences
Volume + smart money alignment (AlphaPulse Bot)
✅ Bull Case (If $580 Holds):
If price continues holding above $580, expect:
Continuation wave toward $595 (local fib target)
Acceleration into $602 (1.618 extension) if breakout holds above $596
Supported by:
AVWAP control staying bullish
MACD histogram expanding
RSI maintaining >60 zone
AlphaPulse breakout signal staying green
🎯 Target: $595–$602
📆 Timeframe: By May 30 close
🎯 Optional overshoot: $608 wick zone if volume spikes
⚠️ Bear Case Trigger (If $580 Breaks)
If $580 fails on high volume or with RSI divergence, the setup shifts:
Condition Bearish Implication
Break below $580 Invalidates current higher low base
MACD flips negative Signals momentum exhaustion
RSI < 50 Enters bearish zone
AlphaPulse Signal flips red Confirms structural breakdown
🔻 Downside Risk:
If $580 fails, probability of bearish retrace to $567 = 75%
$567 is the last demand support zone
Also aligns with prior consolidation + rising SMA50
Below this, momentum cracks completely, and macro selling may accelerate
🧠 Final Note:
“Above $580 = control remains with bulls.
Below $580 = structure breaks, and $567 becomes the likely magnet.”
AS always SafeTrades And JoeWtrades