SPY: Positioning for this. Today I bought some futures options contract, to self analyze things. From trading AGI, once developed it should do a lot of things. I need to be a partner somewhere at this point, might as well start a trading view pack hahaha. More outreach and audiences.
ETF market
Flying into the sun or about to get burnt?Market is about to reach all-time highs again. Many trade deals must have been made. Interest rates must have been cut. Wars must have been resolved. Personal debt must have come under control. Corporate debt must have been resolved.
Wait, nothing has changed? Things are worse? Well why is the index about to hit new all-time highs? My take is a major fake out. We are about to set a double top as we complete a rising wedge pattern.
The rising wedge.
What began at the market bottom on 7 April, has remained bound in a channel. If the first pump up was an A followed by the declaration of the channel bottom as B, wave C has last over a month upward. We have wave 3 signals identifying wave 3 of C ending with the high on 19 May. Last week's dip was wave 4 and now we fly high this week. It is unclear if we actually make a new all-time high or fall just short. The below chart has 138.197% extension around 610.63. Inside wave C, my wave 1 was nine days long, and wave 3 was only 8. This points to wave 5 lasting less than 8 days. A common wave 1-3-5 duration in relation to wave 3 is around 114% for 1 and 50% for wave 5.
The height of the rising wedge covers 66.82 points. This same distance should provide the first target bottom once we exit the channel, possibly as early as next week. Once the bottom falls, we then examine the double top pattern. Although the neckline stretches far backwards, the bottom is established at the 7 April low. The distance from the neckline to the all-time high in February provides the next possible minimum target bottom by taking this 131.43 drop and subtracting it from the neckline of 481.80. This puts the initial low around 350.37 sometime later this year or early next.
There is a perfect storm of calamity brewing with zero resolutions in place or even planned. Do we finally drop or keep rising into the sun?

Breakout is next?Shaded red looks like a tough nut to crack (being in a confluence of resist zone for some major channels), but with the majority of price action over the last 5 years below (shaded blue), and weekly EMA30 as the wind on its back (red line), it may look possible now. AMEX:SILJ #silver

Understanding How Dark Pool Buy Side Institutions AccumulateThe SPY is the most widely traded ETF in the world. Its price or value movement reflects the S&P 500 index value. It doesn't reflect the buying or selling of the SPY.
You must use volume indicators and accumulation/distribution indicators that indicate whether the Buy Side Institutions are in accumulation mode, rotation to lower inventory to buy a different ETF or other instrument, OR distribution due to mutual fund and pension fund redemption demands.
ETFs are one of the fastest growing industries in the US and around the world. There are more than 4000 Exchange Traded Derivatives. There are ETDs for just about anything you might wish to invest in long term or trade short term.
If you trade the SPY, it is important to study the S&P 500 index, its top 10 components, how their values are changing, and resistance and support levels. SPY will mirror the S&P 500 closely but not precisely.
ETFs are built with a variety of types of investments and always have a TRUST FUND, in which the components of that ETF inventory are held. The ETF Inventory is updated and adjusted monthly or sooner as needed to maintain the integrity of the ETF price value to the value of the S&P 500 index. Rules and regulations require that the ETF SPY be closely aligned to the S&P 500. So inventory adjustments are going on regularly.
When trading the SPY, you must remember that it is not buyers and sellers of the ETF that change its price. Rather, it is the S&P 500 top components' price fluctuations that change the SPY price value.
This is a tough concept to accept and understand. When you do understand it and apply that knowledge to your trading of the SPY, you will be far more profitable. This takes time. You also need to develop Spatial Pattern Recognition Skills so that when a pattern appears, you can recognize it instantly and act accordingly in your trading.
Today we cover the resistance levels above the current price value. That resistance is likely to slow down the rapid gains in price value over the past few weeks. The ideal would be a sideways trend to allow corporations time to adjust to the new normal of whatever tarrifs are impacting their imports and exports.
Then, the S&P500 move out of that sideways trend would result in a stronger Moderately Uptrending Market Condition.
Trade Wisely,
Martha Stokes CMT

URNM eyes on $36.07: Golden Genesis to Mark Bottom or End BounceURNM trying to recover from a strong downtrend.
Currently testing a Golden Genesis fib at $36.07
Look for a Break-and-Retest to mark the Bottom.
.
Last Plot that called the TOP:
Also a Golden Genesis that marked the top.
============================================
.

KBWB eyes on $65.58: Golden Genesis Fib for bulls to BreakKBWB trying to resume uptrend but hit a Golden Genesis fib.
Looking for a Dip-to-Fib below or Break-n-Retest to enter.
There is another relevant fib just above so will be tough.

SPY/QQQ Plan Your Trade For 5-27-25 : Blank PatternToday's SPY Cycle Pattern is BLANK. This suggests the market will trend similarly to what we've seen over the past few days - likely melting upward.
A BLANK pattern is a price structure I have not identified as some type of price structure yet. I will check the data to see if I can find anything that correlates with this pattern throughout today.
Generally, we are rolling into a consolidation phase that may attempt to break higher or continue consolidating and roll downward.
Overall, the alignment with the Fibonacci trigger levels suggests the markets will continue to struggle near the ranges I've shown on my charts.
Gold and Silver are rolling downward - likely as a result of the EU tariff pause. That move to pause EU tariffs takes quite a bit of pressure off the metals markets.
I do believe the Gold/Silver will continue to try to rocket higher - but this week metals may stay somewhat flat and trend downward a bit.
BTCUSD is setting up a MASSIVE Excess Phase Peak pattern. This is a very big price rotation that could either INVALIDATE (upward) or CONFIRM (downward). If we get confirmation, BTCUSD could fall back below $75k very easily. If we get invalidation, the sky is the limit to the upside.
Ultimately, I believe the global markets need another 60-90+ days to settle with all the global trade/tariff and other issues before moving into a more bullish price trend.
We'll see if I'm right or not over the next 60-90+ days.
Get some.
#trading #research #investing #tradingalgos #tradingsignals #cycles #fibonacci #elliotwave #modelingsystems #stocks #bitcoin #btcusd #cryptos #spy #gold #nq #investing #trading #spytrading #spymarket #tradingmarket #stockmarket #silver

$DIA / May 30 2026 CONTRACT / Analysis & Targets for Day Traders
Only the first contract of the week will be public. GL today, y'all...

$IWM / May 27 2026 CONTRACT / Analysis & Targets for Day Traders
Only the first contract of the week will be public. GL today, y'all...

$QQQ / May 27 2026 CONTRACT / Analysis & Targets for Day Traders
Only the first contract of the week will be public. GL today, y'all...

The Biggest Turning Point Isn’t in the Market — It’s in YouHard truth:
No new strategy, indicator, or tool will work until you change how you operate.
Here’s why:
Strategy hopping is fear wearing a costume.
If you keep switching tools after every loss, you’re not refining — you’re running.
You don’t need more — you need fewer, better decisions.
Simplifying your process is harder than adding new ideas. But that’s where edge lives.
Belief is the multiplier.
Without conviction, you’ll quit before any system has time to work.
🚀 The shift?
For us, it was trusting what we built — TrendGo.
When we finally stopped tweaking and started trusting the system, everything changed: our mindset, our consistency, our results.
The best tool is worthless if you don’t believe in your process.
🧠 Start there.

$SPY / May 27 2026 CONTRACT / Analysis & Targets for Day TradersAMEX:SPY / May 27 2026 CONTRACT / Analysis & Targets for Day Traders
Only the first contract of the week will be public. GL today, y'all...

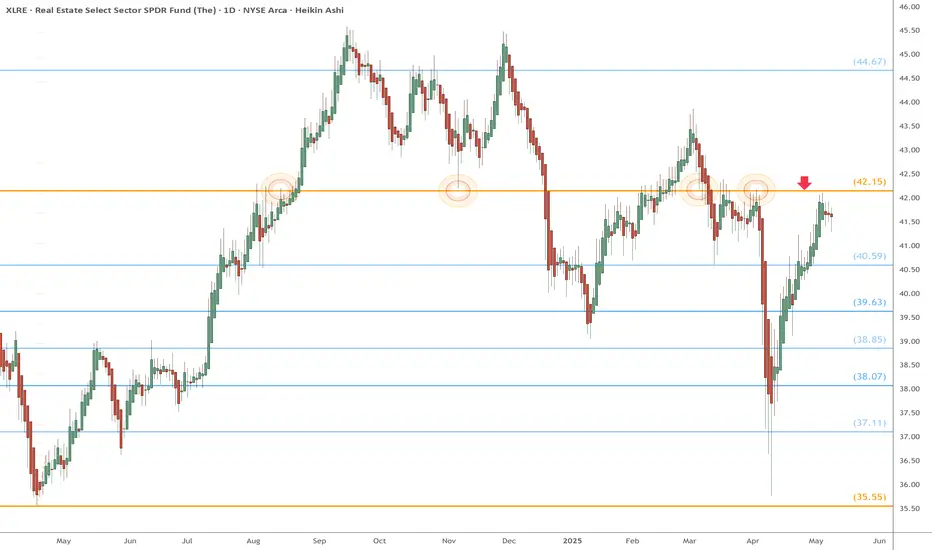
XLRE watch $42.15: proven Golden Genesis fib to determine TrendXLRE (Real Estate) has bounced back strong.
BUT just hit a Golden Genesis fib at $42.15
Look for a likely dip to one of the fibs below.
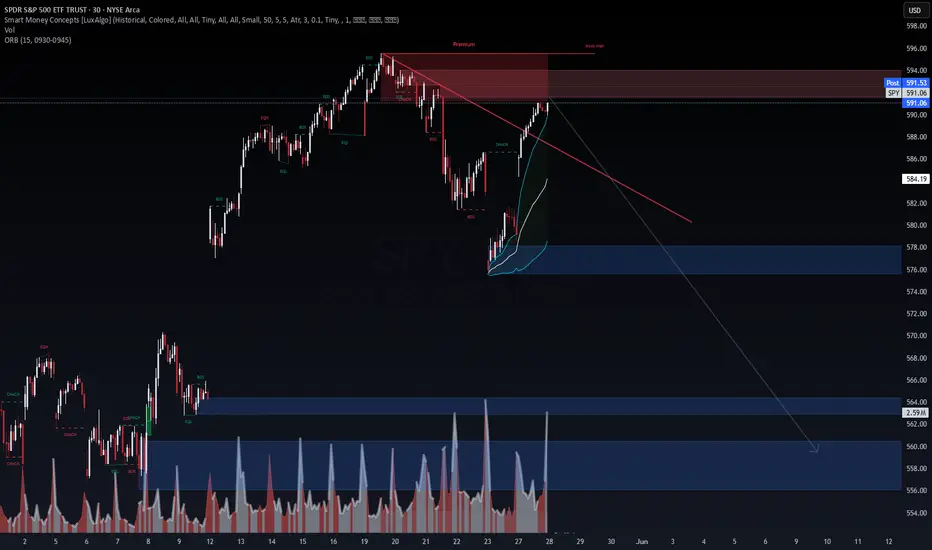
$SPY May 27, 2025AMEX:SPY May 27, 2025
15 Minutes.
Below 577 target is 571-572 levels.
Above 582 target is 586-587 levels being 200 averages.
Since value below 200 averages am biased towards lower levels.
582 is 200 in 5 minutes which needs to be taken out first for 586 587 level.

Weekly $SPY / $SPX Scenarios for May 27–30, 2025🔮 Weekly AMEX:SPY / SP:SPX Scenarios for May 27–30, 2025 🔮
🌍 Market-Moving News 🌍
🇺🇸 Tax-and-Debt Debate Rattles Markets
Washington’s push to advance a massive tax-cut and spending bill—projected to add $3.8 trillion to an already $36.2 trillion debt—has investors questioning U.S. fiscal discipline. The dollar weakened further, while Treasury yields remain elevated on credit-rating concerns and deficit fears
⚖️ Trump Delays EU Tariffs, Lifts Sentiment
President Trump pushed back 50% tariffs on EU goods from June 1 to July 9 after talks with EU leaders. U.S. futures jumped, and global markets breathed easier despite lingering trade-policy uncertainty
📈 Bond Yields Spike, Then Stabilize
Both 20- and 30-year Treasury yields jumped above 5.1% before easing slightly as auction demand picked up. Fed officials signaled they expect to hold rates steady for the next two meetings, putting a floor under yields
📊 Key Data Releases 📊
📅 Tuesday, May 28:
9:00 AM ET: Case-Shiller Home Price Index
10:00 AM ET: Consumer Confidence (May)
📅 Wednesday, May 29:
8:30 AM ET: Advance Q1 GDP
8:30 AM ET: Personal Income & Spending (April)
📅 Thursday, May 30:
8:30 AM ET: PCE Price Index (April)
10:00 AM ET: Pending Home Sales (April)
⚠️ Disclaimer:
This information is for educational and informational purposes only and should not be construed as financial advice. Always consult a licensed financial advisor before making investment decisions.
📌 #trading #stockmarket #economy #news #trendtao #charting #technicalanalysis

$SPY Positioning for New Highs After a Pullback.. $650-$700??SPY remains in a bullish trend until proven otherwise, but I’m anticipating a short-term pullback before the next leg higher. My current outlook sees downside potential toward the $555 level, where I expect a potential reversal. From there, I believe SPY is on track to retest and eventually break through all-time highs at $613. Until I see confirmation at $555 or signs of structural breakdown, I’m treating this pullback as a buying opportunity—not a reversal.

Updated thoughtsThe chart speaks for itself. It’s going to go up then drop. Please lmk if yall have any other thoughts/ideas. Good luck traders!

SPY - Ground Up Multi-Time Frame Analysis!Lots of interesting algorithms at play here between the LTF and HTF algorithms. We need to be very cautious before entering long-term positions.
But, there will be great opportunities to take LTF trades once we start seeing our green tapered buying proving itself and/or a respect and proof of a selling channel like orange or red
Happy Trading :)

Top 10 YieldMax ETFS- For High-Yield Passive Income Portfolio📈 Building a High-Yield Passive Income Portfolio with YieldMax ETFs 💰
YieldMax ETFs are redefining passive income by offering massive monthly distributions through options on high-volatility names like TSLA, MSTR, NVDA, and more.
Below is a high-income ETF portfolio allocation tailored for strong yield, sector diversification, and long-term compounding potential.
🧺 Top YieldMax ETF Allocation
ETF Exposure Suggested Allocation Key Highlights
TSLY Tesla 20% "~108% yield, 29.7% price gain"
BTF Bitcoin 15% "29.15% return, BTC-linked"
CONY Coinbase 15% "High volatility, 21.5% return"
PLTY Palantir 15% AI/data growth with 18.15% gain
NVDY Nvidia 10% "Semis + AI, strong growth"
MSTY MicroStrategy 10% "Crypto proxy, massive yield"
TSMY TSMC 10% Stable Asia chip exposure
YMAX Diversified 5% Exposure to all YieldMax names
Or simply add 10% in each of the top 10 and balance quarterly.
🔁 Reinvest vs. Withdraw? What Happens to $10,000?
✅ Scenario 1: Reinvest Dividends (Compounded ~95%/year)
Time Horizon Estimated Value
1 Year ~$19,500
5 Years ~$369,000
10 Years ~$13.6 Million
❌ Scenario 2: Withdraw Dividends (No Compounding, Flat 70%/year Yield)
Time Horizon Estimated Value
1 Year ~$17,000
5 Years ~$52,000
10 Years ~$105,000
📌 The Takeaway: High yield is powerful. But reinvesting that income unleashes true exponential growth. Passive income becomes wealth acceleration.
“You don’t need more capital. You need more time — and compounding on your side.”
⚠️ Disclaimer
This is an educational illustration. Yields and ETF performance can vary significantly year to year. YieldMax ETFs use options strategies that cap upside and introduce volatility. Do your due diligence

No refinance for u! $TLTContinuation of bearish behavior means you stuck with your 6-7% mortgage rate for awhile. But don't be sad maybe that will be considered a good rate in the future. TLT still looking or support check back around $77 to see what happens next!

QQQ To Be DeterminedUsing the Potterbox strategy, we can see that we successfully bounced off the 4HR cost basis, or median at about $505.60 and closed above the top of the box at about $507.77.
I believe that to continue to the upside, we'll have to first secure the floor above at $511.50 with a 4 hour candle close. At that point, we'll have a chance to punchback with a candle close above cost basis at about $513.84. With that, we can look to head to the upside and use $522 as a price target.
On the other hand, if we drop below the top of the box that we closed above, we could retest cost basis at about $505.60 and if we get a candle close at that end, then we can look to continue downwards towards a $497 price target.

Bond Market Crisis - Opportunity?Pay close attention to the bond market, particular to the 20 Year Treasury yield which is creeping back up. This is really bad news for the markets, yields could spike higher which could send the market tumbling. This cascade effect could provide an optimal entry into TLT - which is an inverse play on interest rates.
There is currently no reason for the Fed reserve to reduce interest rates. Inflation is creeping back up and the cost implications of tariffs are yet to truly felt in the inflation readings. Meanwhile, the US has lost its perfect credit rating and the debt burden continues to grow. The Fed will not reduce rates if inflation shows no sign of abating. Note that in the UK inflation is back up and I expect this to also be the case in the US.
My plan is to watch this play out and look for opportunity in TLT. I don’t want to get caught up bag holding stocks if there is a major bond crisis. As far as the chart is concerned, I expect a double bottom pattern and bullish confirmation with a break of the neckline.
None of this is financial advice, do what’s best for you.

SPY, QQQ, IBIT Last week of MayHey everyone,
Here is my analysis on SPY, QQQ, IBIT for next week.
Enjoy your long weekend if you are in the U.S.
If you are anywhere else like me, enjoy Monday back to work haha.
Safe trades everyone!
