SMH 2 (Semicond.)Dashboard of Semiconductor sector index and main assets of the US stock market sector. Leading indicators for swing strategy.
ETF market
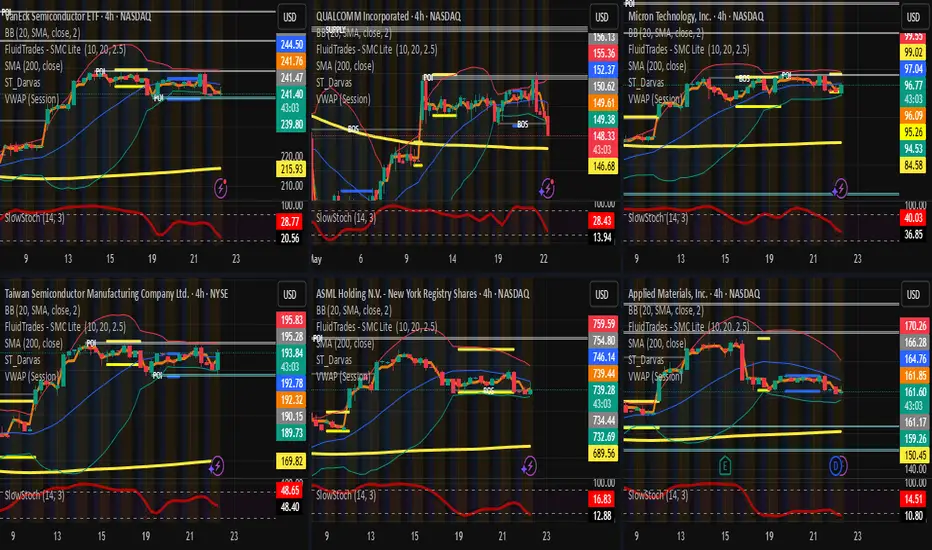
SMH 1 (Semicond.)Dashboard of Semiconductor sector index and main assets of the US stock market sector. Leading indicators for swing strategy.

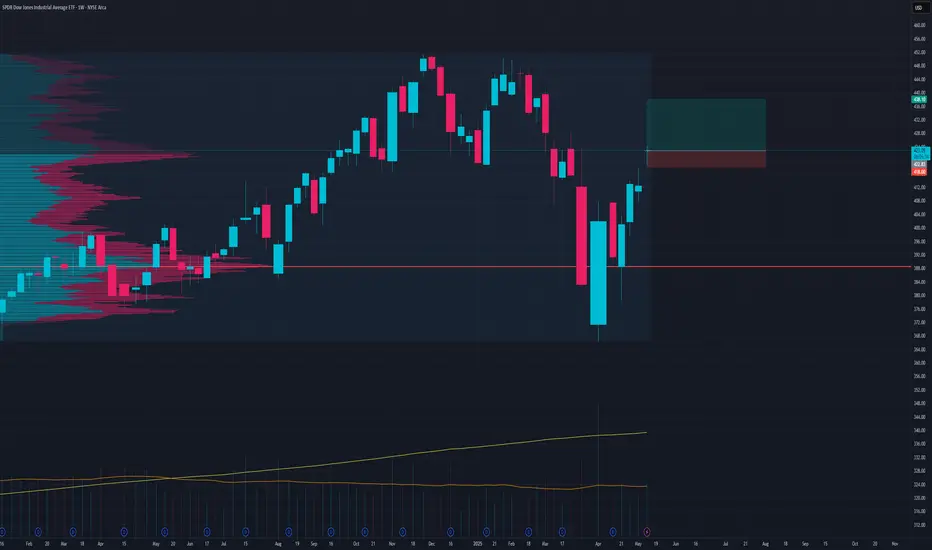
DIA Continuation PumpGap up and push here?
Stop loss could be at 415 but that would not be with good risk to reward ratio
Use proper position sizing and conservatize risk management
SL 418.47
TP 437.31
$TQQQ Weirdly mildly bullishDon't understand why, don't care. My AI gave of a partial bullishness signal for tomorrow onwards for TQQQ. It believes this a buy the dip moment (Unless it changes it's mind for whatever reason).
This is a signal on 3 out of 16 of my 3.6 sharpe models which is fairly bullish. I also had a UVXY call buy suggestion for today which i acted on which weirdly worked out intraday.
Expected move is around ~$4-7 dollars up, more likely on the lower end of that but i can't be sure. All i know is that the AI says up so i'm in.
I've dipped my feet a bit at these levels and waiting for more of my models to say BUY before i fully dip in. Several other tickers like CVNA and MARA flashed BUY today as well which is a nice extra confirmation, but not as good as if all 16 of my TQQQ models flash BUY which they haven't yet.

Smart Entry into the Wheel Using a Credit Put Spread on QQQSmart Entry into the Wheel Strategy Using a Credit Put Spread on QQQ
⚠️ ⚠️ Warning and Disclaimer⚠️⚠️:
This strategy is a trading concept and not financial advice. All traders must conduct their own research and accept full responsibility for the risks involved. While NASDAQ:QQQ is considered a high-quality ETF, options trading always carries the potential for capital loss.
Market Context & Strategic Outlook
Assuming the weekly gap in QQQ gets filled, we may see a temporary correction to around $488 , followed by a quick recovery and potential consolidation near $500 , assuming no new negative catalysts. While I remain skeptical of the market staying perfectly stable, this scenario provides an opportunity for a strategically structured option play with reasonable reward and manageable risk.
If you're planning to acquire 100 shares of QQQ or have the buying power to do so, this strategy can offer a smart and flexible way to enter a long-term position while generating short-term income.
Strategy Concept: Credit Put Spread as Wheel Entry
Prerequisites:
Buying Power: $50,000+
Ideal Market Conditions: Short-term weakness followed by stabilization
Expiration: ~7 Days to Expiry (DTE), depending on volatility and setup
Option Positions Initial Credit Put Spread
Sell QQQ $500 Put
Buy QQQ $498 Put
Net Delta: Less than 0.03
Note: Short strike must be at $500 to set the stage for assignment and wheel initiation.
Management Phases
Stage 1: Entry via Credit Put Spread
- Sell the vertical spread with the intention of owning QQQ.
- If QQQ falls below $500 , close or roll the long $498 put to a lower strike with delta < 0.15.
- Upon expiration:
Let the short put assign, or
Buy the 100 shares outright and close the short leg before the market closes.
Model Virtualization
Alternative (managing risk with rolling down the long put)
Model Virtualization
Goal: Own QQQ at a slightly discounted price, with reduced initial cost due to premium received.
Stage 2: Transition to Covered Call
- After assignment or manual purchase, sell a covered call:
Target DTE ≈ 7 days
Delta ≈ -0.45
Strike price must be ≥ $500
If not available, sell the short call at $500 strike.
Model Virtualization
This generates weekly income while holding the shares, allowing the strategy to compound returns.
Stage 3: Exit or Continue Wheel
- If the call expires worthless, repeat the covered call sale weekly.
- If assigned early, welcome it as it accelerates capital rotation.
- You may also manually unwind the position on expiration if near max profit or market conditions shift.
Model Virtualization
Strategic Rationale
This strategy is a more dynamic and risk-managed version of the traditional Wheel. Rather than starting with a fully cash-secured put, we use a credit put spread for entry, offering a buffer against a steep drop with lower upfront margin.
Why Not Just Sell the Put?
A credit put spread offers:
Defined risk
Lower buying power requirement
Better capital efficiency if the price declines sharply
When NOT to Use This Strategy
If QQQ is expected to trade in a narrow range with minimal volatility, avoid this approach. Instead, consider:
Butterfly or Iron Condor setups with DTE ~12 days
Calendar spreads to benefit from sideways action
Risk and Reward Assessment
Risk and Reward Assessment, Outcome Scenarios
Scenario 1: Price stays above $500
Outcome: Credit put spread expires worthless
Estimated Profit: ~$150
ROI: Approx. 0.3% on $50,000 buying power
Note: No shares are acquired; premium is kept
Scenario 2: Price drops below $500 but recovers
Outcome: Assigned 100 shares, enter covered call phase
Estimated Profit (3 weeks total): ~$800–$1,200
ROI: Approx. 2%
Note: Ideal wheel cycle if managed properly
Scenario 3: Price drops and stays low
Outcome: Maximum loss on the credit put spread
Estimated Profit: -$160
Note: This occurs if the spread expires in-the-money and is unmanaged
This strategy aims not to harvest credit, but to secure a better entry into a long-term equity position.
Caution on Risk
While QQQ is a fundamentally strong ETF, a sharp decline could lock your capital or increase unrealized losses. Liquidity risk which needs that cash for other purposes is the biggest concern.
Mitigation Tip: Consider using a collar strategy (buying protective puts) to hedge against large drawdowns post-assignment.
Stop Loss?
For long-term investors in QQQ, a traditional stop-loss is less critical. But if you're more tactical or capital-sensitive, protecting the downside with a collar is a reasonable move.
Final Thoughts
This approach offers a sophisticated entry into the "Wheel" strategy, additionally, it balances risk, reward, and capital efficiency. Whether the market pulls back or holds steady, you’re either:
Earning premium while staying in cash, or
Entering a high-quality equity position at a better price and generating income weekly.
Thank you for reading. Wish you a successful options trading!

$SPY May 22, 2025AMEX:SPY May 22, 2025
15 Minutes.
Last week I expected the retracement towards 580 levels as numbers were far away from moving averages. But AMEX:SPY kept moving towards595 and suddenly broke yesterday towards 582 levels.
I expect it to settle down around 579 - 581 levels then a pull back is on cards as now we have the reverse on the cards with the 200 being away again.
On left side we have a big gap around 570 - 577 levels which I feel will be sorted out before a consolidation.
The weakness below 590 has keto 582 levels.
At the moment if 578 is broken i see support around 573 574 levels.

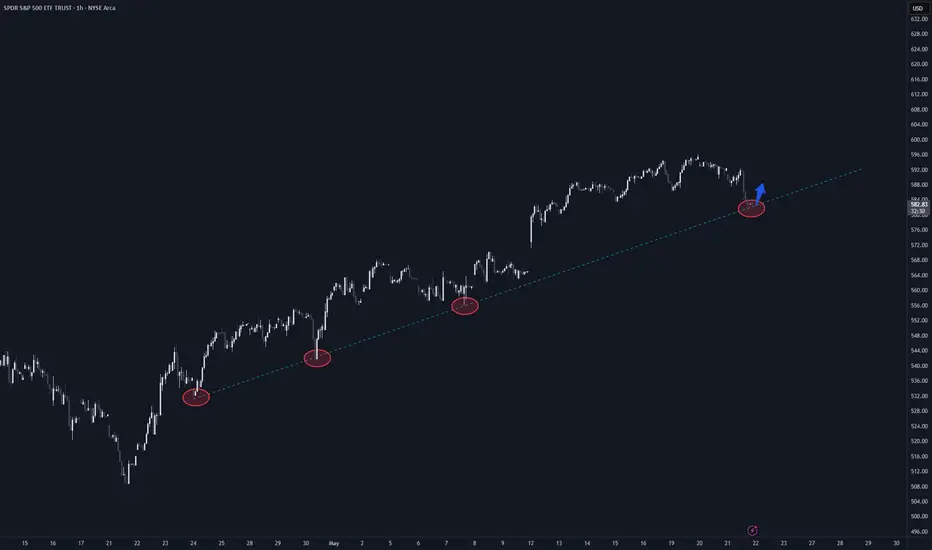
$SPY Calls - May 30 - $600Entered on the trend line confirmation, with a price target of $600.
Stop loss behind the trend line.

Puts on SPY, with temp pullback to buyI see emas beginning to cross, I am expecting a temporary pull back upwards and for the SPY to drop immediately after. With ema's crossing, as my confirmation before entering.

Zero coupon bonds 🚀This is the most extreme US Treasury bond ETF. Basically pay some amount and get back face value in 25 years. Inflation would kill these, whereas deflation and falling interest rates will send this to the moon.
Interestingly this pays a dividend in line with other bonds, I looked it up and it looks like the fund has to do this for tax purposes, but the underlying security has literally a Macaulay duration of 25 years. TLT by comparison is 17 years (per iShares website), so duration risk is 50% higher.
Using fibs a modest pullback to 78, completing a IHS, would be a great place to start loading up, assuming 1) this thing doesn't just take off right here, and 2) I'm not totally wrong and inflation comes back next year.

SPY @ the trendlineTruly a 50/50 from here depending on the gap up/down tomorrow. My best guess? Bullish.

Nightly $SPY / $SPX Scenarios for May 22, 2025 🔮 Nightly AMEX:SPY / SP:SPX Scenarios for May 22, 2025 🔮
🌍 Market-Moving News 🌍
📈 Treasury Yields Surge Amid Weak Bond Auction
U.S. Treasury yields continued their upward trajectory, with the 10-year yield nearing 4.6% and the 30-year yield surpassing 5%, marking the highest levels since early 2023. This increase followed a weak $16 billion auction of 20-year bonds, which attracted less investor demand and sold at higher-than-expected yields. Factors contributing to the rise include fading recession fears, persistent inflation concerns, and growing fiscal worries related to potential tax cut extensions.
📉 Stock Market Declines as Tech Stocks Retreat
The stock market experienced significant losses, with the Dow Jones Industrial Average dropping 1.9%, falling below its 200-day moving average. The S&P 500 and Nasdaq fell 1.6% and 1.4%, respectively.
💼 Snowflake ( NYSE:SNOW ) Reports Strong Earnings
Snowflake Inc. reported record quarterly revenue of $1.04 billion, surpassing expectations. Product revenue increased 26% year-over-year to $996.8 million. The company raised its full-year forecast to $4.325 billion, reflecting a 25% year-over-year increase. Despite a GAAP net loss of $430 million, Snowflake posted an adjusted profit of 24 cents per share, exceeding the 21-cent estimate.
📊 Morgan Stanley Turns Bullish on U.S. Stocks
Morgan Stanley has shifted to a bullish stance on U.S. stocks and bonds, raising its outlook due to signs of market stabilization and improving growth conditions. The bank maintains a base target of 6,500 for the S&P 500 by mid-2026, with a bullish scenario projecting 7,200.
📊 Key Data Releases 📊
📅 Thursday, May 22:
8:30 AM ET: Initial Jobless Claims
9:45 AM ET: S&P Global Flash U.S. Services PMI for May
10:00 AM ET: Advance Services Report (First Quarter 2025)
⚠️ Disclaimer:
This information is for educational and informational purposes only and should not be construed as financial advice. Always consult a licensed financial advisor before making investment decisions.
📌 #trading #stockmarket #economy #news #trendtao #charting #technicalanalysis

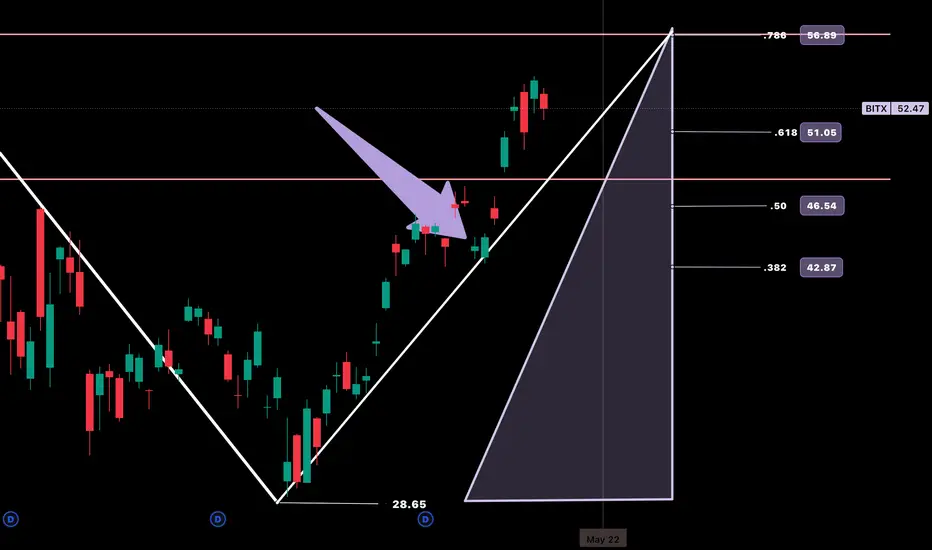
**Trade Update Post: BITx**Trying something new here for the community to follow along with me.
This is an update to my ongoing CBOE:BITX trade showing my ‘Fibonacci Triangle’ standing strong in the wake of some minor consolidation. I have highlighted by arrow during this run the last trend bounce we made before continuing upwards. I am okay with the same type of price action even with potential retracement down to the lower HV10 weekly range of $48.
Due to leverage decay on top of time decay I have set an exit path of May 22nd if I do not see the same type of bounce off my retracement trend line. This mark is Thursday next week. PT is still $58-$60
Cheers!
The 'Fibonacci Triangle' and Historical Volatility Along with the harmonic I just posted to the community showing confluence with HV63 regression that started to take place last week, I wanted to include my 'Fibonacci Triangle' with my predictive volatility range idea.
I see HV10 (bi-weekly) resonating off HV21 (monthly) to enter the week. This would create roughly a $4.92 range if correct for tomorrow. From there we can continue to increase in volatility into the week until full means regression to quarterly trending averages are met.
This can be reflected in the daily candle through the trending bi-weekly daily volatility print on the day, then calculated into range. Of course as always, my ranges are weighted to the current IV environment.
If my target range of monthly volatility is reached tomorrow, which holds confluence in the 78.60% retracement value from selling off with BTC for 70 days..i'd say there is probability to move another $2.21 in regression, putting us just below $60.00.
CBOE:BITX

SPY had a small correction today, as I expected!Do I even need a description? We perfectly just called the latest correction and a spy to take place this week and now it happened, so let's talk about what's next.

Ugly SP500 Reaction to Treasury YieldsUnlike other headline news, long term interest rates breaking out to the upside is an immediate threat to equity prices especially if it's driven by bond vigilantes rather than strong economic news. This will immediately compress valuations and particularly hurt high growth and small caps the most. In addition, this is not a one-off headline where equities markets can easily shake it off and continue to rally. I think we're going to test the gap ~$567 on AMEX:SPY after breaking down from a rising wedge and triggering the PSAR flip.

SPY Trading Opportunity! SELL!
My dear subscribers,
My technical analysis for SPY is below:
The price is coiling around a solid key level - 594.29
Bias - Bearish
Technical Indicators: Pivot Points Low anticipates a potential price reversal.
Super trend shows a clear sell, giving a perfect indicators' convergence.
Goal - 563.56
My Stop Loss - 611.99
About Used Indicators:
By the very nature of the supertrend indicator, it offers firm support and resistance levels for traders to enter and exit trades. Additionally, it also provides signals for setting stop losses
Disclosure: I am part of Trade Nation's Influencer program and receive a monthly fee for using their TradingView charts in my analysis.
———————————
WISH YOU ALL LUCK

Why this may be the bottom: Touch of crucial trendlineI think it may be a good idea to go full port long here.
We will be re-visiting the 590s again very soon.
This sell off was a result of a impending pent up dump that needed to happen sooner rather than later.
spy filling gap, to continue to upside? #tradewhatyousee
Market rallied up, inside area of interest for selling, will the GAP be a area of where buyers want to get involved?

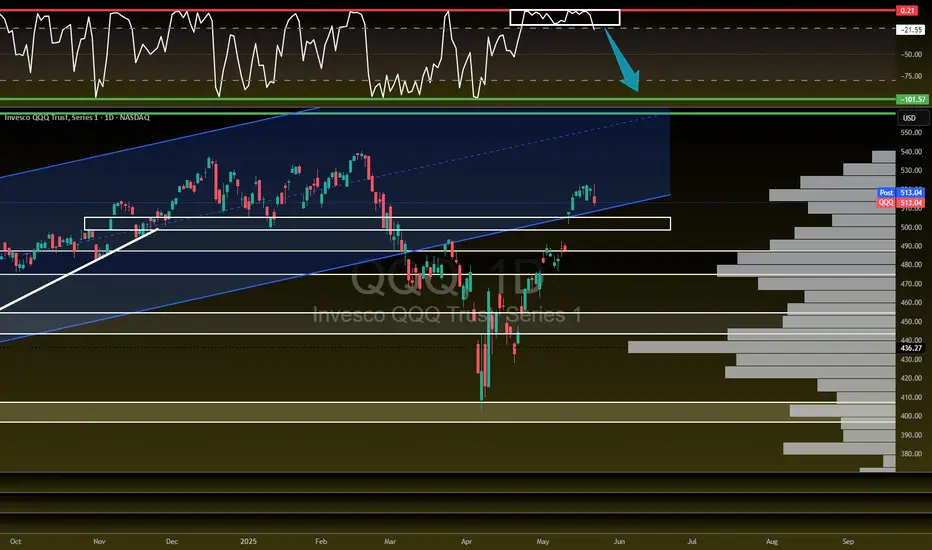
QQQ about to FLUSH?! Let's talk about it!I'm not saying it's over but you have to admit it does feel like we are going to see a decent size pullback...2-6% over the next few weeks on the NASDAQ:QQQ AMEX:SPY
- TVC:VIX back over 20
- US20Y hit 52 week high
- USDJPY starting to creep towards April lows
- $491.54 GAP to fill on NASDAQ:QQQ
- $447.58 Bigger GAP to fill on NASDAQ:QQQ
- Credit starting to become and issue
- Banks/ Credit companies tanked today
There is bullish pieces as well but we do look extended here and a healthy 2-6% would be welcomed...A break of $475 level spells trouble on QQQ.
Trend Line in Play - Imminent Advance in Small Caps?Small Caps look the least extended in this equity rally and I really like the tight ranges before it advances to it's next box. My analysis puts IWM imminent on its next advance upwards. Put this trade idea under: "The trend is your friend until it bends".

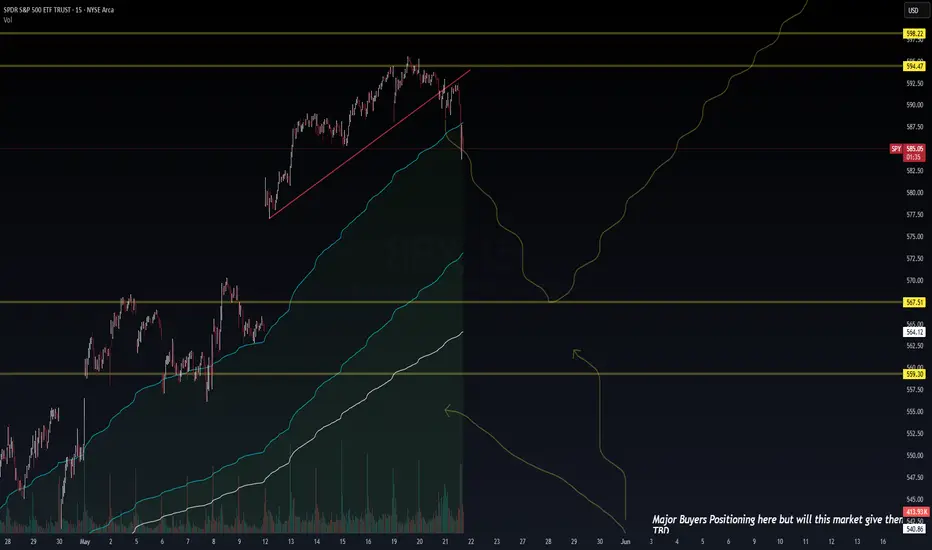
SPY Intraday Breakdown | Will the Fill Zone Hold?🕰️ 15-Min Chart | May 21, 2025
🏢 Posted by: Wavervanir_International_LLC
A textbook ascending wedge breakdown has triggered intraday, breaching dynamic support right at the edge of the VWAP envelope. This breakdown aligns with a higher time-frame rejection seen near 598.22 (0.886 retrace zone).
🔍 Intraday Observations:
Structure Break: Rising wedge support snapped → suggests momentum shift short-term.
Next Liquidity Pools:
📍 567.51 – Prior HVN zone and VWAP mid-band
📍 559.30 – Golden pocket + historical positioning from April
Volume Spike: Bearish confirmation on rising sell-side volume.
🧠 Strategic Context:
Macro Tone: Market breathes as participants await key inflation data + Fed speak. Liquidity is not risk-on.
Risk Flow Watch: Options OI building around 560/570 strikes — could magnetize toward there if flow accelerates.
🛡️ Tactical Setup:
Short-Term Bias: Bearish to neutral into 567.5–559.3 zone
Mean Reversion Setup: Watch VWAP / 3-day anchored VWAP cluster around 559 as a potential reload zone
Invalidation: Quick reclaim and hold above 590 with strong volume flips intraday tone bullish again.
📌 Message to Traders:
Major buyers may be lurking below. The market is deciding whether to reward trapped longs or give value buyers their fill at better risk-adjusted zones. We remain liquidity-aware and flexible.
—
🔗 #SPY #IntradayTrading #VolumeProfile #Wavervanir #LiquidityMapping #VWAP #Orderflow #SMC
SPY | Liquidity Engineering or Reversal?🕰️ Daily Chart | May 21, 2025
🏢 Posted by: Wavervanir_International_LLC
“Major buyers are lurking... but will the market deliver the fill they want?” That’s the question.
We’re currently watching a tactical rejection near 598.22, the 0.886 Fib retracement of the prior high-volume breakdown. This level historically serves as a liquidity sweep zone before decision-making candles emerge.
🔍 Technical + Volume Profile:
Liquidity Zones:
Resistance: 594.4–598.2 = prior supply + Fib confluence
Demand Zones:
567.5 → anchored VWAP / trend channel midpoint
559.3 → 0.618 Fib + major positioning cluster
Volume: Distribution volume into prior highs = possible short-term exhaustion
EMA Structure: Bullish stack but extended from mean; room for reversion to VWAP bands.
🧠 Macro Overlay:
Risk Events: Debt ceiling headlines are muted, but upcoming PCE inflation and labor data could dictate short-term gamma positioning.
Options Skew: OTM put volume rising; VIX curve remains steep in front-end → suggesting hedging or prep for pullback.
Macro Setup: Real yields are sticky, and the Fed is not signaling dovish pivot yet — any continuation will need confirmation via breadth and credit spreads.
🛡️ Risk Framework:
Reclaim 598.2: Bias flips bullish with upside into 613–644
Break Below 567.5: Opens doors for deeper retest at 559 or even 533
Neutral Range: 567.5–594.5 → Let market structure show intent before deploying size.
📌 Game Plan:
Let price come to you. Patience > Prediction. Market is deciding whether to reward early breakout traders or punish late longs via mean reversion. Watch the 567–559 cluster—that’s where smart money may reload.
—
🔗 #SPY #MacroTrading #VolumeAnalysis #RiskManagement #Fibonacci #Wavervanir #SP500 #LiquidityMap

India 50 Major Market Caution Signs Emerging!Any time you see multiple head-and-shoulders patterns forming on the chart often signals serious trouble ahead.
Stay vigilant for a break in the right shoulder of this massive head-and-shoulders pattern currently developing.
As a macro trader, I focus on the big picture—economics and long-term trends. While markets like India and long-term trading don’t get much TV coverage, my aim is to shift your perspective and enhance your trading strategy.
Follow this post to track how multiple head and shoulders patterns and a rising bearish wedge evolve over time.
Let’s ignite your curiosity and elevate your overall trading and investing.
Like, follow, and subscribe to join me in tackling these wild markets. Let's get to 5,000 followers!
