SPY to 575 EOM
IF AND ONLY IF buyers can't step in...
SPY 575 first bearish target
560 if we break the trendline at 575ish
555 after that
I'm going to watch how price reacts but my intraday bias is now bearish
ETF market

BITX — Harmonic Completion: Expression in Time for point ‘D’CBOE:BITX
I wanted to share my concept of fibonacci retracement in time with the community and why I selected the 86.6% retracement of this sell off for point ‘D’ within my harmonic structure with an exit and completion of today.
This was a 45 day sell off after the first ‘W’ price distribution from the top. I always decide on a pivot candle to start my retracement off the impulse rally. Doesn’t matter if it is bullish or bearish by nature. When point ‘B’ was created it extended past the 23.6% value but fell short of 50% where it continued to sell down below the original impulse rally. When CBOE:BITX pivoted at point ‘C’ we had a confirmation of retracement anywhere from .886-1.13 for how I read fibonacci levels.
Next I run the ‘A-B-C Trend-Based Time’ tool and input my extensions. You will find when I build my ‘Fibonacci Triangle’ I run .382-.786 symmetrically in price/time, but for my harmonics I use extension in time to locate my point ‘D’ and pair that with my retracement level. You can see in my chart above that there is daily significance more often than not on these days. I tend to run my X-A-B-C-D tool to the harmonic extension zones in time and track the trend. This example above, it was the 86.6% retracement of a 45 sell off that executed on the 141% value in time from that sell off.
Feel me?
If you like the conversation, drop a boost and give a follow! Let’s talked price and time fibonacci symmetry. I always get down on historical volatility as well with my weighted system to ever sliding IV — Come find me, let’s go!

Using Historical Volatility and HarmonicsI track bi-weekly, monthly, and quarterly volatility to have a feel for how trending markets elasticity is and I weight this volatility percentage to the ever sliding IV environment and calculate an implied range for the week.
This helps me gauge the weekly candle potential.
Here you see my HV10/21/63 implied ranges for the week listed from my spreadsheet and visualized on the daily perspective of CBOE:BITX -- What I would like to point out entering the week as this run will begin to cool off, is the confluence around $60.00 with HV63 regression and 'Point D' completion of my harmonic shown.
I hope everyone has a great week. If you like to talk volatility and enjoy fibonacci drop me a comment.

TZA Stock Chart Fibonacci Analysis 052225Trading Idea
1) Find a FIBO slingshot
2) Check FIBO 61.80% level
3) Entry Point > 14.2/61.80%
Chart time frame:C
A) 15 min(1W-3M)
B) 1 hr(3M-6M)
C) 4 hr(6M-1year)
D) 1 day(1-3years)
Stock progress:A
A) Keep rising over 61.80% resistance
B) 61.80% resistance
C) 61.80% support
D) Hit the bottom
E) Hit the top
Stocks rise as they rise from support and fall from resistance. Our goal is to find a low support point and enter. It can be referred to as buying at the pullback point. The pullback point can be found with a Fibonacci extension of 61.80%. This is a step to find entry level. 1) Find a triangle (Fibonacci Speed Fan Line) that connects the high (resistance) and low (support) points of the stock in progress, where it is continuously expressed as a Slingshot, 2) and create a Fibonacci extension level for the first rising wave from the start point of slingshot pattern.
When the current price goes over 61.80% level , that can be a good entry point, especially if the SMA 100 and 200 curves are gathered together at 61.80%, it is a very good entry point.
As a great help, tradingview provides these Fibonacci speed fan lines and extension levels with ease. So if you use the Fibonacci fan line, the extension level, and the SMA 100/200 curve well, you can find an entry point for the stock market. At least you have to enter at this low point to avoid trading failure, and if you are skilled at entering this low point, with fibonacci6180 technique, your reading skill to chart will be greatly improved.
If you want to do day trading, please set the time frame to 5 minutes or 15 minutes, and you will see many of the low point of rising stocks.
If want to prefer long term range trading, you can set the time frame to 1 hr or 1 day.

Nightly $SPY / $SPX Scenarios for May 23, 2025 🔮 Nightly AMEX:SPY / SP:SPX Scenarios for May 23, 2025 🔮
🌍 Market-Moving News 🌍
🇬🇧 Global Bond Yields Signal Rising Term Premium
Long-dated government bond yields in the U.S., U.K., and Japan surged, with the U.S. 30-year Treasury yield touching 5.09%, as investors demand higher compensation for locking in funds amid mounting debt and inflation risks
🏗️ Komatsu Sees Tariff Relief
Komatsu’s CEO says a recent U.S.–China trade truce may cut the company’s tariff hit by $140 million, easing cost pressures on its U.S. operations and brightening machinery sector outlook
📉 U.S. Stocks End Flat as Yields Ease
Wall Street closed little changed, with the S&P 500 and Dow finishing flat and the Nasdaq up 0.3%, after Treasury yields retreated slightly following recent spikes
📊 Key Data Releases 📊
📅 Friday, May 23:
🏠 New Home Sales (10:00 AM ET)
Reports the number of newly signed contracts for single-family homes, a direct gauge of housing demand and consumer confidence.
⚠️ Disclaimer:
This information is for educational and informational purposes only and should not be construed as financial advice. Always consult a licensed financial advisor before making investment decisions.
📌 #trading #stockmarket #economy #news #trendtao #charting #technicalanalysis

Engineering the Hull‑style Exponential Moving Average (HEMA)▶️ Introduction
Hull’s Moving Average (HMA) is beloved because it offers near–zero‑lag turns while staying remarkably smooth. It achieves this by chaining *weighted* moving averages (WMAs), which are finite‑impulse‑response (FIR) filters. Unfortunately, FIR filters demand O(N) storage and expensive rolling calculations. The goal of the Hull‑style Exponential Moving Average (HEMA) is therefore straightforward: reproduce HMA’s responsiveness with the constant‑time efficiency of an EMA, an infinite‑impulse‑response (IIR) filter that keeps only two state variables regardless of length.
▶️ From FIR to IIR – What Changes?
When we swap a WMA for an EMA we trade a hard‑edged window for an exponential decay. This swap creates two immediate engineering challenges. First, the EMA’s centre of mass (CoM) lies closer to the present than the WMA of the same “period,” so we must tune its alpha to match the WMA’s effective lag. Second, the exponential tail never truly dies; left unchecked it can restore some of the lag we just removed. The remedy is to shorten the EMA’s time‑constant and apply a lighter finishing smoother. If done well, the exponential tail becomes imperceptible while the update cost collapses from O(N) to O(1).
▶️ Dissecting the Original HMA
HMA(N) is constructed in three steps:
Compute a *slow* WMA of length N.
Compute a *fast* WMA of length N/2, double it, then subtract the slow WMA. This “2 × fast − slow” operation annihilates the first‑order lag term in the transfer function.
Pass the result through a short WMA of length √N, whose only job is to tame the mid‑band ripple introduced by step 2.
Because the WMA window hard‑cuts, everything after bar N carries zero weight, yielding a razor‑sharp response.
▶️ Re‑building Each Block with EMAs
1. Slow leg .
We choose αₛ = 3 / (2N − 1) .
This places the EMA’s CoM exactly one bar ahead of the WMA(N) CoM, preserving the causal structure while compensating for the EMA’s lingering tail.
2. Fast leg .
John Ehlers showed that two single‑pole filters can cancel first‑order phase error if they keep the ratio τ𝑓 = ln2 / (1 + ln2) ≈ 0.409 τₛ .
We therefore compute α𝑓 = 1 − e^(−λₛ / 0.409) ,
where λₛ = −ln(1 − αₛ).
3. Zero‑lag blend .
Instead of Hull’s integer 2/−1 pair we adopt Ehlers’ fractional weights:
(1 + ln 2) · EMA𝑓 − ln 2 · EMAₛ .
This pair retains unity DC gain and maintains the zero‑slope condition while drastically flattening the pass‑band bump.
4. Finishing smoother .
The WMA(√N) in HMA adds roughly one and a half bars of consequential delay. Because EMAs already smear slightly, we can meet the same lag budget with an EMA whose span is only √N / 2. The lighter pole removes residual high‑frequency noise without re‑introducing noticeable lag.
▶️ Error Budget vs. Classical HMA
Quantitatively, HEMA tracks HMA to within 0.1–0.2 bars on the first visible turn for N between 10 and 50. Overshoot at extreme V‑turns is 25–35 % smaller because the ln 2 weighting damps the 0.2 fs gain peak. Root‑mean‑square ripple inside long swings falls by roughly 15–20 %. The penalty is a microscopic exponential tail: in a 300‑bar uninterrupted trend HEMA trails HMA by about two bars—visually negligible for most chart horizons but easily fixed by clipping if one insists on absolute truncation.
▶️ Practical Evaluation
Side‑by‑side plots confirm the math. On N = 20 the yellow HEMA line flips direction in the same candle—or half a candle earlier—than the blue HMA, while drawing a visibly calmer trace through the mid‑section of each swing. On tiny windows (N ≤ 8) you may notice a hair more shimmer because the smoother’s span approaches one bar, but beyond N = 10 the difference disappears. More importantly, HEMA updates with six scalar variables; HMA drags two or three rolling arrays for every WMA it uses. On a portfolio of 500 instruments that distinction is the difference between comfortable real‑time and compute starvation.
▶️ Conclusion
HEMA is not a casual “replace W with E” hack. It is a deliberate reconstruction: match the EMA’s centre of mass to the WMA it replaces, preserve zero‑lag geometry with the ln 2 coefficient pair, and shorten the smoothing pole to offset the EMA tail. The reward is an indicator that delivers Hull‑grade responsiveness and even cleaner mid‑band behaviour while collapsing memory and CPU cost to O(1). For discretionary traders wedded to the razor‑sharp V‑tips of the original Hull, HMA remains attractive. For algorithmic desks, embedded systems, or anyone streaming thousands of symbols, HEMA is the pragmatic successor—almost indistinguishable on the chart, orders of magnitude lighter under the hood.

SPY Will Keep Growing! Buy!
Hello,Traders!
SPY is trading in an uptrend
And the index made a retest
Of the key horizontal level
Of 579$ from where we are
Already seeing a bullish
Rebound so as we are
Bullish biased we will be
Expecting a further
Bullish move up
Buy!
Comment and subscribe to help us grow!
Check out other forecasts below too!
Disclosure: I am part of Trade Nation's Influencer program and receive a monthly fee for using their TradingView charts in my analysis.

$SPY Bollinger Bands and RSI Oversold SignalThe AMEX:SPY aka S&P 500 is delivering a daily Bollinger Bands and RSI oversold signal today
In the last ten years there has been a bigger recovery shortly after such an signal

IWM INVENTED HEAD N SHOULDER TARGET .786 /alt 618 We have now pulled back in what should be an abc drop The question is as we stop at the 50 % mark I tend to see another advance to the .618 and most likely .786 . I see the bond market decline as ready to turn UP rather big . This should help rally ALL Boats . We also had a nice 5 waves down under the bearish alt wave count . This should be good for the .618 .But one wave at a time . Wavetimer

$SPY – Bearish RSI Divergence + Gap Below = Risky Setup👀 The RSI divergence has been signaling weakness for several sessions — with lower highs on momentum while price made higher highs.
And now, we’re stalling right at a volume shelf (see VRVP) with a big unfilled gap looming just below.
⚠️ Things to watch:
Bearish RSI divergence ✔️
Price breakdown confirmation below $582
Gap fill target = ~$572
VRVP shows thin volume beneath current price
If momentum rolls over from here, this could accelerate fast into that gap zone.

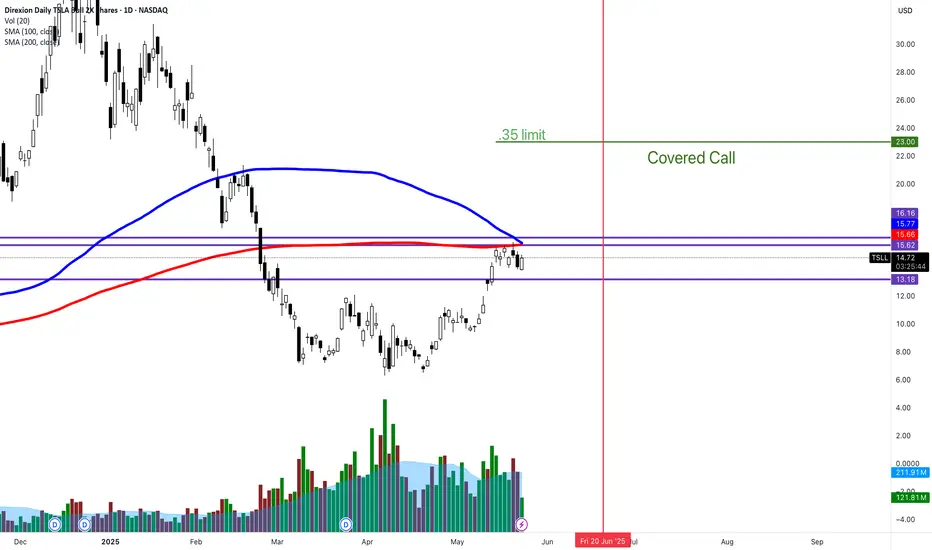
TSLL JUNE covered call What is REALLY cool about this covered call is
100/200 SMA acting as resistance. I'm getting 1.6% of premium. This CC is over 2 closed days in the market and it's $10 HIGHER than stock price?!?!
This is crazy. I love it.
IBITUSDT | Volume Speaks FirstRight now, IBITUSDT is showing more volume than even Binance’s pair . That alone tells me where the real activity is — and this is the chart I’ll be tracking .
I’m not interested in premature entries. I’ll be watching below the green line for potential setups , but only with clear confirmation on lower timeframes.
“I will not insist on my short idea. If the levels suddenly break upwards and do not give a downward break in the low time frame, I will not evaluate it. If they break upwards with volume and give a retest, I will look long.”
Most traders follow the noise. I follow the volume. That’s how I stay accurate.
📌I keep my charts clean and simple because I believe clarity leads to better decisions.
📌My approach is built on years of experience and a solid track record. I don’t claim to know it all but I’m confident in my ability to spot high-probability setups.
📌If you would like to learn how to use the heatmap, cumulative volume delta and volume footprint techniques that I use below to determine very accurate demand regions, you can send me a private message. I help anyone who wants it completely free of charge.
🔑I have a long list of my proven technique below:
🎯 ZENUSDT.P: Patience & Profitability | %230 Reaction from the Sniper Entry
🐶 DOGEUSDT.P: Next Move
🎨 RENDERUSDT.P: Opportunity of the Month
💎 ETHUSDT.P: Where to Retrace
🟢 BNBUSDT.P: Potential Surge
📊 BTC Dominance: Reaction Zone
🌊 WAVESUSDT.P: Demand Zone Potential
🟣 UNIUSDT.P: Long-Term Trade
🔵 XRPUSDT.P: Entry Zones
🔗 LINKUSDT.P: Follow The River
📈 BTCUSDT.P: Two Key Demand Zones
🟩 POLUSDT: Bullish Momentum
🌟 PENDLEUSDT.P: Where Opportunity Meets Precision
🔥 BTCUSDT.P: Liquidation of Highly Leveraged Longs
🌊 SOLUSDT.P: SOL's Dip - Your Opportunity
🐸 1000PEPEUSDT.P: Prime Bounce Zone Unlocked
🚀 ETHUSDT.P: Set to Explode - Don't Miss This Game Changer
🤖 IQUSDT: Smart Plan
⚡️ PONDUSDT: A Trade Not Taken Is Better Than a Losing One
💼 STMXUSDT: 2 Buying Areas
🐢 TURBOUSDT: Buy Zones and Buyer Presence
🌍 ICPUSDT.P: Massive Upside Potential | Check the Trade Update For Seeing Results
🟠 IDEXUSDT: Spot Buy Area | %26 Profit if You Trade with MSB
📌 USUALUSDT: Buyers Are Active + %70 Profit in Total
🌟 FORTHUSDT: Sniper Entry +%26 Reaction
🐳 QKCUSDT: Sniper Entry +%57 Reaction
📊 BTC.D: Retest of Key Area Highly Likely
📊 XNOUSDT %80 Reaction with a Simple Blue Box!
📊 BELUSDT Amazing %120 Reaction!
📊 Simple Red Box, Extraordinary Results
I stopped adding to the list because it's kinda tiring to add 5-10 charts in every move but you can check my profile and see that it goes on..

SMH 3 (Semicond.)Dashboard of Semiconductor sector index and main assets of the US stock market sector. Leading indicators for swing strategy.

IWM: Could Be a Gap Fill Day Today🔍 Posted by WaverVanir International LLC
Looking at IWM on the 15-minute chart, price action remains ambiguous — we’re caught in a range where traditional technical indicators are providing limited directional clarity.
However, our proprietary Decision Support System (DSS) is signaling a potential move based on LSTM (Long Short-Term Memory) model outputs. While human sentiment and chart structure may hesitate, machine learning is beginning to lean bullish.
🔹 Key Notes:
No clear breakout yet from this consolidation zone.
Volume remains subdued, signaling indecision.
LSTM forecasting engine from our DSS suite is tilting slightly bullish over the next 1–2 hours.
Awaiting confirmation from VWAP and liquidity sweeps before a higher conviction entry.
⚠️ Short-term traders: stay nimble. Machine guidance suggests preparing for a breakout, but price confirmation is critical.
🧠 “When human emotion falters, data continues.”
— WaverVanir DSS

SPY SHORTES Futures have decisively broken down from the ascending wedge pattern that had been forming over the past few weeks. This bearish technical breakdown suggests a potential shift in market sentiment and momentum. Given the high correlation, I'm anticipating that SPY will follow suit shortly, especially as macroeconomic pressures intensify.
The catalyst appears to be a combination of bearish fundamental developments:
Moody’s Credit Downgrade: The recent downgrade has shaken investor confidence in U.S. creditworthiness, adding fuel to the bond market selloff.
Bond Market Pressure: Yields continue to climb as investors exit fixed income, concerned about rising inflation, mounting debt, and tightening financial conditions.
Fiscal Uncertainty: The U.S. House has passed Trump’s substantial tax bill, which, while aimed at stimulating growth, raises concerns about further ballooning the national deficit. This is compounded by Trump's new spending package and a proposed debt ceiling increase, heightening fiscal instability and long-term debt fears.
We’re also seeing an uptick in volume following the last downward wave, which may indicate institutional participation and confirmation of the breakdown.
Technical Targets (If Breakdown Continues):
nPoC (Naked Point of Control): A high-probability magnet for price action due to untested liquidity.
50% Fibonacci Extension: Suggests a measured move target based on the size of the previous wave.
0.618 Fibonacci Retracement (Golden Pocket): A key confluence zone that often acts as strong support/resistance due to its high relevance in market algorithms and trader psychology.
These targets present a strong technical confluence zone and may serve as areas of interest for both short covering and potential long re-entries.

SMH 2 (Semicond.)Dashboard of Semiconductor sector index and main assets of the US stock market sector. Leading indicators for swing strategy.
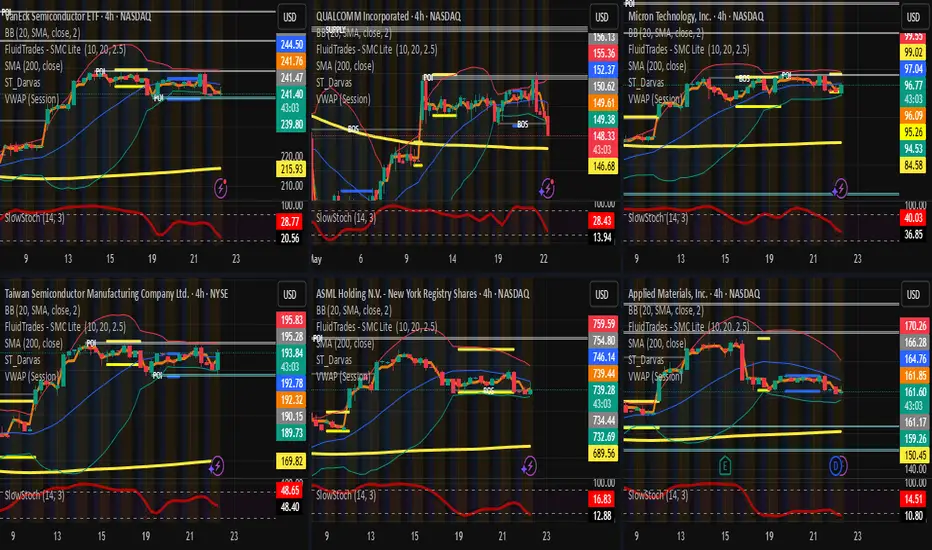
SMH 1 (Semicond.)Dashboard of Semiconductor sector index and main assets of the US stock market sector. Leading indicators for swing strategy.

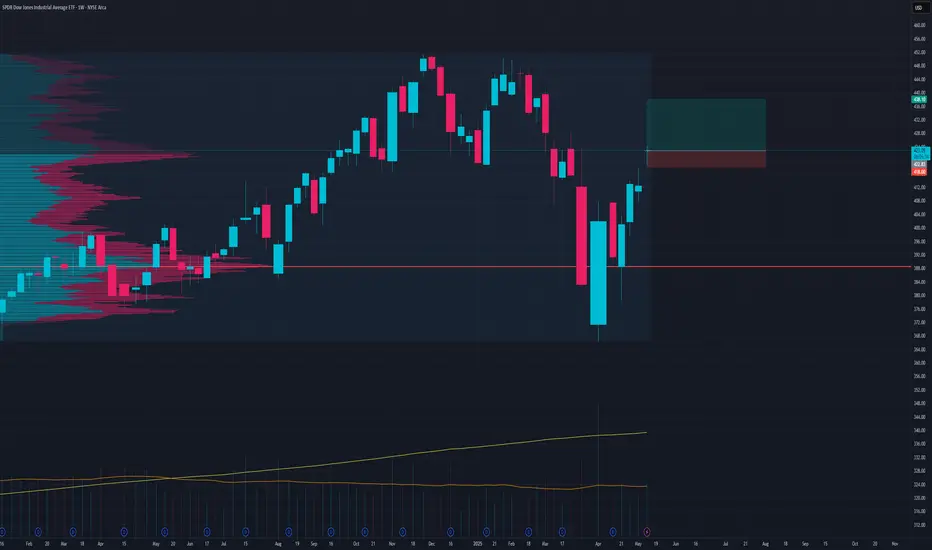
DIA Continuation PumpGap up and push here?
Stop loss could be at 415 but that would not be with good risk to reward ratio
Use proper position sizing and conservatize risk management
SL 418.47
TP 437.31
$TQQQ Weirdly mildly bullishDon't understand why, don't care. My AI gave of a partial bullishness signal for tomorrow onwards for TQQQ. It believes this a buy the dip moment (Unless it changes it's mind for whatever reason).
This is a signal on 3 out of 16 of my 3.6 sharpe models which is fairly bullish. I also had a UVXY call buy suggestion for today which i acted on which weirdly worked out intraday.
Expected move is around ~$4-7 dollars up, more likely on the lower end of that but i can't be sure. All i know is that the AI says up so i'm in.
I've dipped my feet a bit at these levels and waiting for more of my models to say BUY before i fully dip in. Several other tickers like CVNA and MARA flashed BUY today as well which is a nice extra confirmation, but not as good as if all 16 of my TQQQ models flash BUY which they haven't yet.

Smart Entry into the Wheel Using a Credit Put Spread on QQQSmart Entry into the Wheel Strategy Using a Credit Put Spread on QQQ
⚠️ ⚠️ Warning and Disclaimer⚠️⚠️:
This strategy is a trading concept and not financial advice. All traders must conduct their own research and accept full responsibility for the risks involved. While NASDAQ:QQQ is considered a high-quality ETF, options trading always carries the potential for capital loss.
Market Context & Strategic Outlook
Assuming the weekly gap in QQQ gets filled, we may see a temporary correction to around $488 , followed by a quick recovery and potential consolidation near $500 , assuming no new negative catalysts. While I remain skeptical of the market staying perfectly stable, this scenario provides an opportunity for a strategically structured option play with reasonable reward and manageable risk.
If you're planning to acquire 100 shares of QQQ or have the buying power to do so, this strategy can offer a smart and flexible way to enter a long-term position while generating short-term income.
Strategy Concept: Credit Put Spread as Wheel Entry
Prerequisites:
Buying Power: $50,000+
Ideal Market Conditions: Short-term weakness followed by stabilization
Expiration: ~7 Days to Expiry (DTE), depending on volatility and setup
Option Positions Initial Credit Put Spread
Sell QQQ $500 Put
Buy QQQ $498 Put
Net Delta: Less than 0.03
Note: Short strike must be at $500 to set the stage for assignment and wheel initiation.
Management Phases
Stage 1: Entry via Credit Put Spread
- Sell the vertical spread with the intention of owning QQQ.
- If QQQ falls below $500 , close or roll the long $498 put to a lower strike with delta < 0.15.
- Upon expiration:
Let the short put assign, or
Buy the 100 shares outright and close the short leg before the market closes.
Model Virtualization
Alternative (managing risk with rolling down the long put)
Model Virtualization
Goal: Own QQQ at a slightly discounted price, with reduced initial cost due to premium received.
Stage 2: Transition to Covered Call
- After assignment or manual purchase, sell a covered call:
Target DTE ≈ 7 days
Delta ≈ -0.45
Strike price must be ≥ $500
If not available, sell the short call at $500 strike.
Model Virtualization
This generates weekly income while holding the shares, allowing the strategy to compound returns.
Stage 3: Exit or Continue Wheel
- If the call expires worthless, repeat the covered call sale weekly.
- If assigned early, welcome it as it accelerates capital rotation.
- You may also manually unwind the position on expiration if near max profit or market conditions shift.
Model Virtualization
Strategic Rationale
This strategy is a more dynamic and risk-managed version of the traditional Wheel. Rather than starting with a fully cash-secured put, we use a credit put spread for entry, offering a buffer against a steep drop with lower upfront margin.
Why Not Just Sell the Put?
A credit put spread offers:
Defined risk
Lower buying power requirement
Better capital efficiency if the price declines sharply
When NOT to Use This Strategy
If QQQ is expected to trade in a narrow range with minimal volatility, avoid this approach. Instead, consider:
Butterfly or Iron Condor setups with DTE ~12 days
Calendar spreads to benefit from sideways action
Risk and Reward Assessment
Risk and Reward Assessment, Outcome Scenarios
Scenario 1: Price stays above $500
Outcome: Credit put spread expires worthless
Estimated Profit: ~$150
ROI: Approx. 0.3% on $50,000 buying power
Note: No shares are acquired; premium is kept
Scenario 2: Price drops below $500 but recovers
Outcome: Assigned 100 shares, enter covered call phase
Estimated Profit (3 weeks total): ~$800–$1,200
ROI: Approx. 2%
Note: Ideal wheel cycle if managed properly
Scenario 3: Price drops and stays low
Outcome: Maximum loss on the credit put spread
Estimated Profit: -$160
Note: This occurs if the spread expires in-the-money and is unmanaged
This strategy aims not to harvest credit, but to secure a better entry into a long-term equity position.
Caution on Risk
While QQQ is a fundamentally strong ETF, a sharp decline could lock your capital or increase unrealized losses. Liquidity risk which needs that cash for other purposes is the biggest concern.
Mitigation Tip: Consider using a collar strategy (buying protective puts) to hedge against large drawdowns post-assignment.
Stop Loss?
For long-term investors in QQQ, a traditional stop-loss is less critical. But if you're more tactical or capital-sensitive, protecting the downside with a collar is a reasonable move.
Final Thoughts
This approach offers a sophisticated entry into the "Wheel" strategy, additionally, it balances risk, reward, and capital efficiency. Whether the market pulls back or holds steady, you’re either:
Earning premium while staying in cash, or
Entering a high-quality equity position at a better price and generating income weekly.
Thank you for reading. Wish you a successful options trading!

$SPY May 22, 2025AMEX:SPY May 22, 2025
15 Minutes.
Last week I expected the retracement towards 580 levels as numbers were far away from moving averages. But AMEX:SPY kept moving towards595 and suddenly broke yesterday towards 582 levels.
I expect it to settle down around 579 - 581 levels then a pull back is on cards as now we have the reverse on the cards with the 200 being away again.
On left side we have a big gap around 570 - 577 levels which I feel will be sorted out before a consolidation.
The weakness below 590 has keto 582 levels.
At the moment if 578 is broken i see support around 573 574 levels.

$SPY Calls - May 30 - $600Entered on the trend line confirmation, with a price target of $600.
Stop loss behind the trend line.

Puts on SPY, with temp pullback to buyI see emas beginning to cross, I am expecting a temporary pull back upwards and for the SPY to drop immediately after. With ema's crossing, as my confirmation before entering.
