$SPY Daily Chart Taz Plan - May 2025 into June-July Breakdown📉 SPY Daily Chart Trading Plan — May 2025
Thesis:
Price has returned to the exact level ($594.20) where the February impulse breakdown began. This zone is acting as a Lower High rejection within a broader bearish structure. A clean rejection here opens the door to multiple inefficiency fills below.
🔍 Structure Breakdown:
Feb High (ATH): $613.23
Feb Open: $592.67
Feb Close (last green candle before impulse): $594.20
Current Price: $594.20
Marked LH: $592.50
This is a rally back into rejection, not strength.
📉 Key Zones & Gaps:
🔺 Gap Supply: $566.48 – $578.50
🔺 Wick Gap: $558 – $566 → Needs a full-body candle to initiate fill
🟥 FVG (4/22): $528 – $541.52
🧱 Major Support: $481.80
🧠 Trade Plan:
Short Entry 1 (Confirmation-Based):
🔻 Red candle rejection under $592.50 = starter short
🔻 Watch RSI and MACD for momentum fade
Short Entry 2 (Gap Breach):
🔻 If $578 is broken and retested → scale in
🔻 Gap fill expected quickly once triggered
Short Entry 3 (Wick Gap):
🔻 Body close through $558 = last add
🔻 Sets up for final flush to FVG
🎯 Targets:
$578.50 → $566.48 (Gap Fill)
$558 → $541.52 (Wick Gap & FVG Top)
$528 – $530 (FVG Close)
$481.80 (Long-Term Panic Target)
❌ Invalidation:
Daily close > $595.50 = Pause thesis
Weekly close > $600 = Structural shift, short squeeze zone
🧠 Final Thoughts:
This isn’t just a gap fill play — it’s a structural fade from a lower high back into memory. The Feb impulse wave left behind layers of inefficiency, and price just tapped the origin of the breakdown.
Momentum is peaking. If this is a trap, the downside should begin immediately.
Let the chart prove it.
ETF market

US Downgrade, 3-5-10% Pullbacks But Still Bullish on S&PHappy Sunday!!!
US Futures open lower after Friday's close and Moody's downgrade.
Last time this occurred in 2011, the S&P dropped around 10% from the "news."
This is all interesting timing but I'm still liking pullbacks for opportunities to position
bullish in the US indexes (S&P, Nasdaq, Dow)
Because the melt-up continues to run (US/China gap last week and drift higher), I'm trying to stay patient for a pause or pullback
Trump and Bessent are still chirping about Tariffs and a government "detox" so a round of trade war related news may help calm the market's red hot advance post April 7 lows
I'm selling calls on owned positions for income. I'm waiting for more favorable levels to add new positions, but within 3-4% of all time highs for the S&P and Nasdaq I don't think anybody will be surprised to see the all-time highs revisited in the near to medium-term
Let's have a great week - thanks for watching!!!
-Chris Pulver

SPY: short term pullback after credit downgrade? In this video we talk about what's next for the coming week in the S&P 500, given how we could be setting up for a short term pullback

SPY: Week of May 18Hey everyone,
Here are my thoughts on SPY.
Hope you all have a great rest of your weekend and safe trades next week!

SPY WEEKLY 19TH-23RD MAY 2025Welcome to Spy weekly. I have tried to explain the price action & all-important levels in the best possible way but still if you have doubts then feel free to leave a comment below.
NOTE: WE ARE IN BULL RUN

SPY volatility this weekI'm posting the rest of the readings I did for each week this month on SPY. This week I'm expecting a drop into Wed. I get all my info from dowsing, btw.
I noticed all last week it kept suggesting to sell rallies, which makes me thing we're going to pull back. The weekly (done at the beginning of the month) did suggest over 5% down this week. But my dowsing now says to watch for a bounce Wed. with a look below & fail. Move up to some extent Wed. & reverse down Thursday (implies gap up or some up). Then Friday up. Short term watching the $575 area for the bounce or resumption of trend.
Next week's reading of down more is a bit of a head scratcher, so that's why I think things could just be really volatile.
Low on QQQ I'm looking for is 498.

I was early, but not wrong - 571 target still standsHello Traders,
We can clearly see a top signal as SPY has started to play out a bearish divergence at the 594 level. The 594 level seemed to fade during after hours upon the announcement of Moody's US credit downgrade as the price sliced through the 590 level all the way down to 588.
I believe the price will rapidly cascade down sub 580, down to 571 Monday - Tuesday. The gap fill is at 565.13. The gap fill level is too obvious, therefore I would be surprised if the price perfectly reversed (although, expect a reaction at this level).
My target for this downturn is 561.63, which is the 38.2% fib level, as low as 551.48.
This would offer a great pullback and buying opportunity for the long term, for the bullish case.
I personally believe that the stock market won't make all time highs, but does not mean I will miss out on bullish opportunities, if the trend does truly reverse.
As always, we will have to see what Monday brings us.

SPY (S&P 500 ETF) Weekly Technical Analysis4H Chart (Short-Term View)
Trend: Ongoing bullish momentum with dominant green candles.
Key Breakout: Strong breakout above the $594–$596 resistance zone, which now acts as support.
Volume Profile (VPVR): A low-volume area between $595 and $610 suggests potential for a swift move higher.
Indicators: The Ichimoku Cloud shows rising support, with positive band compression.
Projection: As long as the price holds above $594, there is potential to test the $610–$615 area.
Daily Chart (Medium-Term View)
Fibonacci Levels: The 0.786 level was broken decisively, indicating strong bullish momentum.
Trend: Clearly bullish, supported by declining volume on pullbacks and steady upward movement.
Volume: Consistent increase in buying volume since April strengthens the bullish case.
Upcoming Resistance: $610–$615 (previous highs).
Weekly Chart (Long-Term View)
Recovery: A solid rebound from the March lows.
VPVR: The high-volume node between $455 and $475 has been left behind, now acting as a structural support.
Macro Trend: Price has returned to a previous consolidation area from the prior bull market.
Risks: While there is room for further upside, the $610 area could act as both technical and psychological resistance.
Key Levels
Immediate Resistance: $610–$615
Technical Support: $594–$596
Structural Support: $560 (significant volume cluster)
Conclusion
SPY maintains a strong bullish structure across all timeframes, with sustained upward momentum and room to challenge previous highs. The reaction around the $610 zone will be critical. As long as price holds above $594, the structure remains favorable for buyers. However, given the lack of historical volume in this price range, short-term volatility or pullbacks are possible.
Disclaimer:
This analysis is intended for informational and educational purposes only. It does not constitute financial advice or an investment recommendation. Always assess your own risk profile and consult a licensed professional before making investment decisions.

GLD where to?My dowsing work suggested a high around $288 on GLD, which obviously worked out (see prior idea). There's often a decent reversal opportunity once levels are hit. This one was golden... Wah-wah.
I'm trying not to over ask on things because with my work, I think it opens the door for misleading information or confusion on my part.
Simply put, the guidance was to get a date from the past, which was Jan. 10th. Look to revisit that price, which happens to correlate with the area of the 200 sma. When I asked what price from the H/L of that day, I get $249.
I drew a line to show the reference candle from January.
I ask what date this may occur by & get May 15th, but another date came of July 26th. There's some big stuff I think happening in indexes too in June/July. Dates are often reversals, but can be nothing. You just never know, but odds are more often they are something.

GDXJ short to $44Using my dowsing readings on GDXJ as confirmation was helpful for the long GLD idea, so why not use it for the move down idea? Only this time, I'll post what I get :)
As I mentioned, I'm a dowser & all my ideas and levels come from that. There's not much to this idea other than it shouldn't go much above 54. I do have a bit higher on GLD, and then a significant correction, which on GDXJ gives me a target of $44.
Levels hit well before, so hopefully, we can get lucky again.

QQQ: Bearish Continuation & Short Trade
QQQ
- Classic bearish pattern
- Our team expects retracement
SUGGESTED TRADE:
Swing Trade
Sell QQQ
Entry - 521.53
Stop - 536.96
Take - 476.43
Our Risk - 1%
Start protection of your profits from lower levels
Disclosure: I am part of Trade Nation's Influencer program and receive a monthly fee for using their TradingView charts in my analysis.
❤️ Please, support our work with like & comment! ❤️

Why Traders Chase — and Always LoseHard truth:
You don’t miss opportunities. You chase noise.
Let’s break down the real reason you keep “missing moves”:
1. FOMO is not urgency — it’s confusion.
When you enter because “everyone’s talking about it,” you’re not trading a setup. You’re reacting to social proof.
2. Volatility ≠ opportunity.
Big moves look attractive, but if they’re not in your plan — they’re distractions, not trades.
3. The market rewards patience, not activity.
Every click, every chart, every refresh feeds your dopamine — not your edge.
🚫 Solution?
Stop scanning. Start filtering.
Use tools that prioritize structure over noise. That’s why we built TrendGo — to give clarity in chaos and help you avoid traps masked as opportunity.
📌 Don’t chase. Build your edge.

Trendline BreakTrendline break
If it breaks above upper trendline then it will retest. Then it will go higher. It has already tested this price level.

SPY or SPX vs 3 month Treasury yieldLets just few the picture and let it tell us a 1000 words.
Everyone says to the moon...Just like 2009, up we go....Just like 2020, up we go
But let us view it another way...eh?
You "stole/froze" whatever you label it...Russian Assets and kicked them from Swift, which they return the favor by arguing that the ceasefire deal cant be done cause they don't like the style of pen you brought that day....
You decided to show the the world that you will turn a certain area of the Mediterranean into a French Plaza with beach front hotels, and may...maybe give the inhabitants vouchers to move away- one can say its a booming deal for them.
You decide to demonstrate to the world that on a tweet's notice you will change policy without official announcements and policy update for the rest of the world.
Then you decide...well I think that picture is becoming clear- Japan just bit the hand of Uncle Sam and said 'if you step any closer the treasuries get it'
So in all, the rally to ATH is literally exactly like 2009 and 2020, since there is literally nothing that has changed and everything above was equally going on, just change the dates and the people/places involved but exactly the same right.
Except for that weird number 0...0% which seemed to occur in 2009 and 2020- no coincidence there and todays 4.3% means absolutely nothing...just slight inflation, roughly 12-13k % increase...but its no issue.
So what can we surmise here....:
Well you were dropping for a good amount of time in 2009- ~504 days and in 2020 you basically turned the lights off and then on again...so that seems to fit with what just happened here right>>
you had 282 days of drop in 2022, which is 56% of 2009 and you literally made up a number of tariffs, then made up a lower number a month later and bingo-bango back up you go....
butttt...one of these things in pink just doesn't quite fit...so honestly it will be a delight to see how the see-saw theory works:
I call it a theory cause there is no proof on the chart that when the market goes up- yields go up, no case for it and not visible on the chart anywhere....So we should be good. Ergo....
As the market makes ATH and keeps charging up, the yields will go back down to 0% or so on the 3month and stay there cause that follows the see-saw theory. You don't keep money in the markets for too long as they rise, you rotate it into the treasuries cause you get a better stable return.
So...Trump and Bessent win...getting lower yields and a higher stock market- cause just look at the Technical Analysis everyone- there is only emotion in people saying Yields go up as the S&P goes up, its not cold hard logical facts right...only emotional people think stocks make yields go up..jeez
----
If you agree with the last bit there...you may need to check your local big city, over 2-3million inhabitants, to see how you are doing in these ATH markets....you may find that when treasuries are up....you arent doing so well on the street..
You can lie to a Tiger and say according to the charts you are more advanced than him and you will, according to the charts, beat him due to your superiority. He however lives in reality and wonders why you are talking to him and showing him a paper- so he offs you and walks away- feeling nothing cause you were the emotional one trying to use a chart to tell nature what it isn't. :)
be careful out there...cause V-bottom explosions need a 0 or close to 0% interest rate...and 4.3 isn't 0, so study an elliot wave guy and see if this isnt what is called the "B-wave" where you may settle back in the 400 range soon..and low 400 at that.

SQQQ | Im Very Bearish the Markets Going into Q1 - 2025How I see It: (The commentary is purely my own thoughts based on my research comparing it to what I've seen in the media and other social media sites)
SQQQ smooths out the noise and shows me if we are in a bearish scenario in the technology sector.
This ETF has been in a bullish divergence for the last 6 months, and it showing signs its time to pop higher.
That equates to the QQQ's going into a correction mode over the next 3 - 6 months.
Be careful as profit taking will come hard, and margin calls will run crazy.
ProShares UltraPro Short QQQ seeks daily investment results, before fees and expenses, that correspond to three times the inverse (-3x) of the daily performance of the NASDAQ-100 Index. The fund invests in financial instruments that ProShare Advisors believes, in combination, should produce daily returns consistent with the fund's investment objective. The index includes 100 of the largest domestic and international non-financial companies listed on The Nasdaq Stock Market based on market capitalization. The fund is non-diversified.

Stock Market Forecast | TSLA NVDA AAPL AMZN META MSFTStock Market Forecast | CME_MINI:NQ1! NASDAQ:QQQ AMEX:SPY CME_MINI:ES1!
Mag 7 Forecast | TSLA NVDA AAPL AMZN META MSFT GOOGL

Pullback before higher ? Just looking at a break under from previous lows now that we are back over it right now. 515-505

SPY LongNo need to discuss fundamentals here since it is THE SPY.
Very good entry for beginners or swing traders.
clean reversal patter.
You can keep SL a bit lower if you have appetite

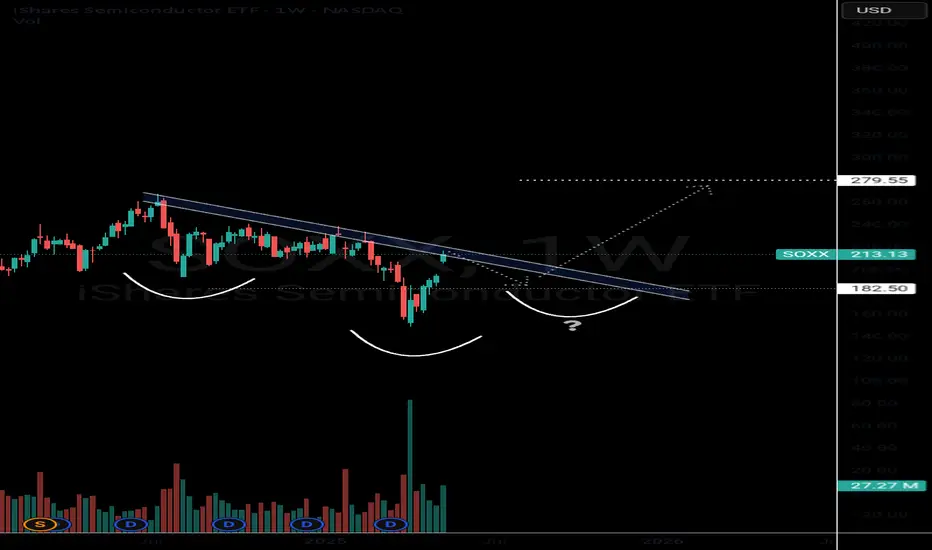
Bullish Semiconductors? SOXX The semiconductors NASDAQ:SOXX definitely tend to lead the market In bull rallies. I still think this saying will hold true for several years.
The NASDAQ:SOXX is flirting with some pretty decent resistance. This would be a perfect spot for sellers to exit and price action to digest recent gains.
If the chart plays out like I think it will, we should have a decent pullback in this area which could create an epic inverse head right shoulder. This pattern would be a very bullish setup that could take us into new All Time Highs in 2026.
This is a weekly pattern so allow the chart some tike to play out.
Ukraine War and Prospects for PeaceThe ongoing war in Ukraine, now entering its fourth year of full-scale conflict, continues to reshape geopolitical risk and investment decisions globally. For investors, the challenge is to manage the asymmetric risks of a protracted war while remaining positioned for a potential peace dividend. Drawing on conflict research and historical cases, this article presents two complementary investment strategies: one aligned with a possible de-escalation or ceasefire in the next 12–24 months, the other designed to hedge against continued instability or escalation.
Peace Positioning Strategy (Base Case)
Should the war move toward de-escalation in 2025 or 2026, certain sectors are likely to outperform significantly. Infrastructure and construction companies such as Caterpillar, Vinci, Strabag or Heidelberg Materials could benefit from post-war rebuilding and logistics modernization in Eastern Europe. Industrial stocks like BASF or ArcelorMittal may rise on improved regional trade flows and demand for building materials. Banks with exposure to Eastern Europe, such as Raiffeisen or OTP Bank, could experience re-ratings as sovereign risks decline and local loan activity revives. Agricultural machinery firms like John Deere or fertilizer producers like Nutrien and Yara may also see tailwinds due to renewed agricultural exports from Ukraine and surrounding regions.
To access these themes efficiently, investors can consider ETFs such as the iShares MSCI Eastern Europe Capped ETF (if reintroduced), the SPDR S&P International Industrial ETF (IPN), or the Xtrackers MSCI EMEA Infrastructure ETF. These vehicles provide diversified exposure to peace-leveraged equities. A hypothetical future ETF focused on Ukraine reconstruction could offer very high upside, but it does not yet exist.
Target returns in this peace scenario are estimated between 20–35% over a 12–24 month horizon, with defined stop-loss levels between -10% and -15% to protect capital. For example, a position in an infrastructure ETF might have a target of +30% with a stop-loss at -15%. For bank or material stocks, upside could reach +50% in select cases, though volatility remains high.
Hedging Against Conflict (Risk Scenario)
If the conflict persists or escalates further into 2026 or beyond, portfolios must remain resilient against commodity shocks, defense spending surges, and persistent volatility. Defense contractors such as Rheinmetall, BAE Systems, or Lockheed Martin may benefit from increased military expenditures in Europe and the U.S. Energy majors like Shell, Equinor, or Chevron may profit from renewed pressure on energy supply chains.
In terms of ETF hedges, the iShares U.S. Aerospace & Defense ETF (ITA) and the Invesco DB Commodity Index ETF (DBC) offer exposure to global defense and broad commodities, respectively. Precious metals—especially gold—remain core hedging instruments, either through direct holdings or via ETFs like Xetra-Gold or the VanEck Gold Miners ETF (GDX), which tracks miners such as Barrick Gold and Newmont.
Expected returns in this defensive strategy range from +10% to +25% over the same 12–24 month period, depending on the asset. Defense equities may return up to +40% under sustained geopolitical tensions. A stop-loss discipline remains critical here as well, generally set tighter (e.g., -10% to -12%) due to high volatility and potential news-driven reversals.
Portfolio Allocation Suggestion
Investors may consider a split allocation, combining peace-beneficiary assets with defensive hedges and a tactical cash buffer. For example, a portfolio of €10,000 could allocate €4,000 toward peace-aligned themes (such as infrastructure ETFs or Eastern European banks), €2,500 in defense or energy hedges (e.g., ITA, oil stocks), €1,500 in gold or gold miners (e.g., Xetra-Gold or GDX), €1,000 in commodity broad hedges (e.g., DBC), and €1,000 held in cash for flexibility or drawdown buying.
This approach offers diversification across geopolitical scenarios and maintains optionality in a rapidly evolving environment.
Return Outlook and Scenarios
In a peace or ceasefire scenario, portfolio returns could reach +18% to +30% over 12–24 months, driven by sector re-ratings and reconstruction optimism. In a baseline stalemate scenario, returns are expected to be more muted, in the +5% to +10% range, as defensive positions offset lackluster peace exposure. In the case of renewed escalation, select hedges (defense, energy, gold) could still generate +10% to +15%, while broader risk assets may suffer losses of -5% or more.
Risks to Monitor
Major risks include premature positioning for peace that fails to materialize, overexposure to volatile frontier assets, and policy-driven shocks such as expanded sanctions or regional energy disruptions. Tactical flexibility and strict risk management (via stop-losses and position sizing) are essential in both scenarios.
Disclaimer
This article is provided for informational and educational purposes only and does not constitute investment advice, a solicitation, or an offer to buy or sell any securities. All investments involve risk, including possible loss of capital. The views expressed are those of the author and do not reflect the official policy or position of any institution. Forecasts, targets, and projections are based on current market conditions and subject to change without notice. Readers are advised to consult with a licensed financial advisor before making investment decisions. ETFs, stocks, and instruments mentioned are for illustrative purposes only.


SPY Breakdown – May 16, 2025📉 SPY Breakdown – May 16, 2025
Posted by ThePlotThickens
We’re hitting resistance at the top of this price channel, and I think we drop to 585-587 tomorrow. I believe the market has topped for now.
Most of the market looks weak, overbought tapping resistance walls, except for the big tech names that just keep running (especially chip stocks — total madness. Endless speculative market cap for chips lol). But overall, it feels like things are starting to slow down, not dumpy per se.
👉 Key Levels:
We’re right at the bottom of the Feb 2–5 weekly candle, when the Trump tariffs were dropped. This is a major support zone, and a lot of traders are watching it. Also, a quick reminder — weekly candles are super important right now. They show the bigger trend and are way more reliable than just looking at daily moves.
We might still tap the low of this week’s candle, but I believe 575 is the real line in the sand. That level marked the start of our bull run. As long as we stay above it, the long-term trend still looks strong.
💸 Short-term outlook:
I expect profit-taking tomorrow — probably a red day. Even if Trump tweets again, I doubt it does much unless he removes all tariffs (which would be wild). It took 6 weeks to get here.
📌 My main point:
Keep your eyes on 575 support. If we close the weekly candle above that, bulls are still in control. That’s the psychological level most traders are watching. If we drop below, we could revisit lower zones before trying to go higher again.
🔴 Channel Resistance at the top — The “toppy” zone where price is struggling.
🟠 Short-term target at 583-585 — Where you expect a drop.
🟢 Major Support at 575 — The key psychological and technical level.
🔴 Watch Zone below 575 — Where bulls could lose momentum.

Opening (IRA): SMH July 18th 205 Short Put... for a 2.21 credit.
Comments: Doing some higher IV premium-selling in the ETF space, targeting the <16 delta strike paying around 1% of the strike price in credit.
Will look to add at intervals if I can get in at strikes better than what I currently have on ... .
