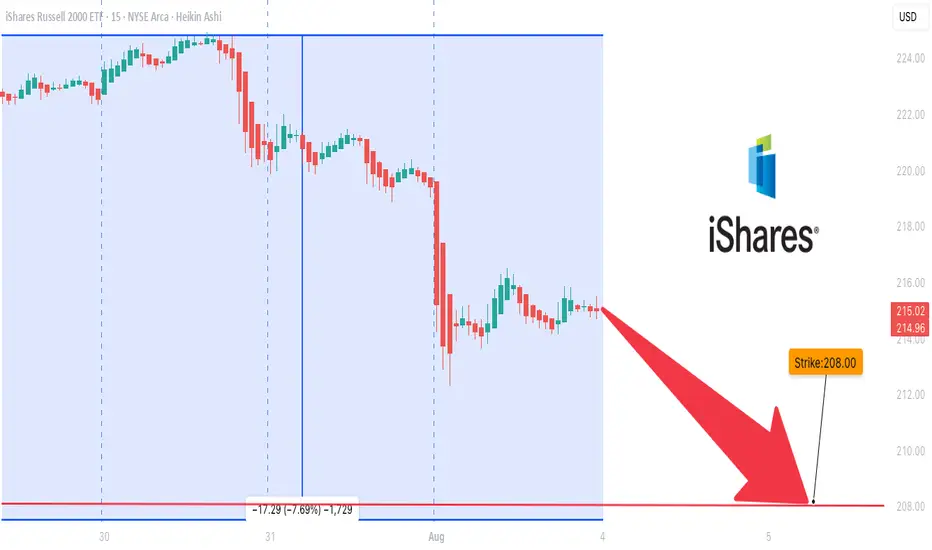
IWM is Overbought### ⚠️ \ AMEX:IWM Bearish Setup Alert — Weekly PUT Trade (Aug 3, 2025)
> **Momentum breakdown + institutional volume = high-probability short play**
📉 **Market Breakdown:**
* **📉 Daily RSI:** 34.9 → Bearish momentum under key 45 level
* **📊 Weekly RSI:** 53.0 → Neutral but slipping = trend weakening
* **📈 Volume Spike:** 1.4x → Institutional moves hint at potential sell-off
* **⚖️ Options Flow:** 1.00 C/P ratio → No bias = wait for price action
* **💀 Max Pain:** \$222.50 → Downward price magnet
* **🌪️ VIX:** 20.38 → Normal vol zone, good for option plays
---
### 💥 Trade Setup – 5D Weekly PUT
| Entry | 🎯 Target | 🛑 Stop Loss | ⚖️ R/R Ratio | 📅 Expiry |
| ------ | ------------- | ------------- | ------------ | ---------- |
| \$0.92 | \$1.35 (+50%) | \$0.45 (-50%) | 1:1.5 | 2025-08-08 |
🔻 **Strike:** \$208.00
💼 **Type:** Naked PUT
⏰ **Timing:** Enter at market open
📈 **Confidence:** 70%
🧠 **Logic:** Bearish RSI + volume surge + neutral flow = downside edge
---
### 🔍 Summary
> “IWM is losing grip. Momentum says down. Big players are already positioning.”
> 🔸 Short-term PUTs offer attractive R/R
> 🔸 Low volatility improves pricing
> 🔸 Weekly RSI still neutral → stay nimble
---
📊 **TRADE DETAILS**
🎯 Instrument: **IWM**
🔀 Direction: **PUT (SHORT)**
🎯 Strike: **\$208.00**
💵 Entry: **\$0.92**
🎯 Target: **\$1.35**
🛑 Stop Loss: **\$0.45**
📅 Expiry: **2025-08-08**
📈 Confidence: **70%**
🕒 Entry Timing: **Open**
---
### 💡 Tag It:
\#IWM #PutOptions #WeeklyTrade #BearishMomentum #RSIAlert #OptionsFlow #MaxPainTheory #VolatilityTrading #MarketOutlook #TradingView #OptionsAlert
ETF market
SPY vs VIX two day LongSPY falling wedge - short term oversold - VIX wainning, looks like VIX to retreat to $18.50 area which translates into a DCB on SPY. We'd Aug 6th target = $631/633 Gap fill then probable resumption to the downside to test $613. Good luck 👍

SPY: Growth & Bullish Forecast
The price of SPY will most likely increase soon enough, due to the demand beginning to exceed supply which we can see by looking at the chart of the pair.
Disclosure: I am part of Trade Nation's Influencer program and receive a monthly fee for using their TradingView charts in my analysis.
❤️ Please, support our work with like & comment! ❤️

My short analysis on why I am comfortably long XHB
Price making HHs and HLs
RSI making HHs and HLs
2 break above 200SMA, the second one making a HH with increasing volume
Price holding above 50 EMA which recently underwent a direction reversal

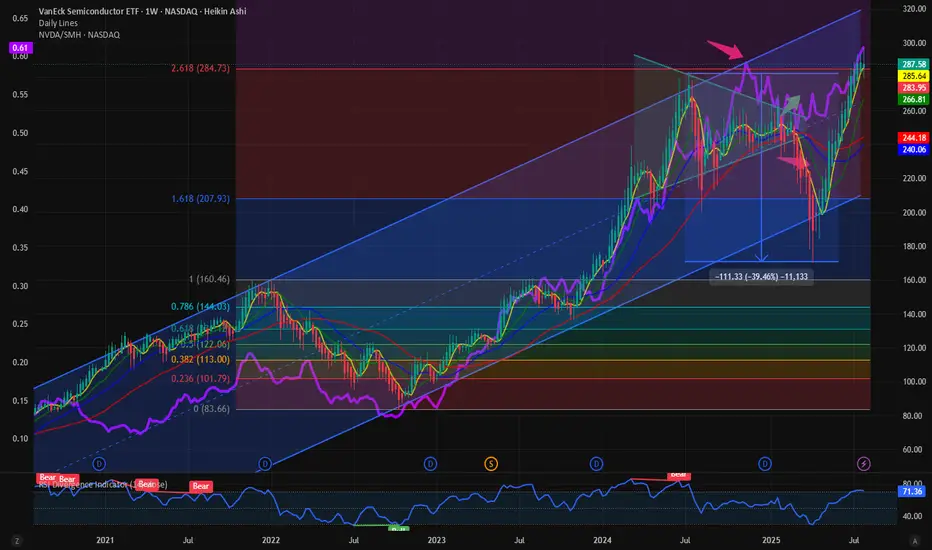
$NVDA Dominance to 65%: Trajectory is right path might be bumpy.First, I have to say its good to be back among friends after a summer break. A lot has happened in the meantime. In the TradFi and Crypto Markets stuffs are making ATH, and we are in a full-fledged bull market which is third year in the making. History is in favor of us. So, let’s look at the stuffs making new highs and the relative performance. Because relative performance tells us a lot about the over or underperformance, we love to look at CRYPTOCAP:BTC dominance and similarly in the TradFi space we investigate NASDAQ:NVDA Dominance a term we coined here.
My favorite is to look at the NASDAQ:NVDA / NASDAQ:SMH i.e. what percentage of NASDAQ:SMH is represented by $NVDA. We predicated in this space that NASDAQ:NVDA Dominance will touch 65% and NASDAQ:NVDA will first touch 170$.
NASDAQ:SMH and NASDAQ:NVDA Dominance: Some more room to run for both for NASDAQ:SMH by RabishankarBiswal — TradingView
We have blown past our July end target in NASDAQ:NVDA , hence our year end target of 240$ looks achievable. The price target in NASDAQ:SMH of 315 looks more achievable than before. But will this be a straight-line form here. My expectation is that with NASDAQ:SMH @2.61 Fib retracement level with price @ 285 it will go through temporary consolidation before it can resume its upward trajectory with NASDAQ:NVDA doing the heavy lifting. The next catalyst is NASDAQ:NVDA earning on Aug 28.
Verdict: NASDAQ:SMH might go through consolidation here. Year-end targets remain intact: NASDAQ:SMH @ 315 $ and NASDAQ:NVDA @ 240 $ with NASDAQ:NVDA Dominance @ 65%.

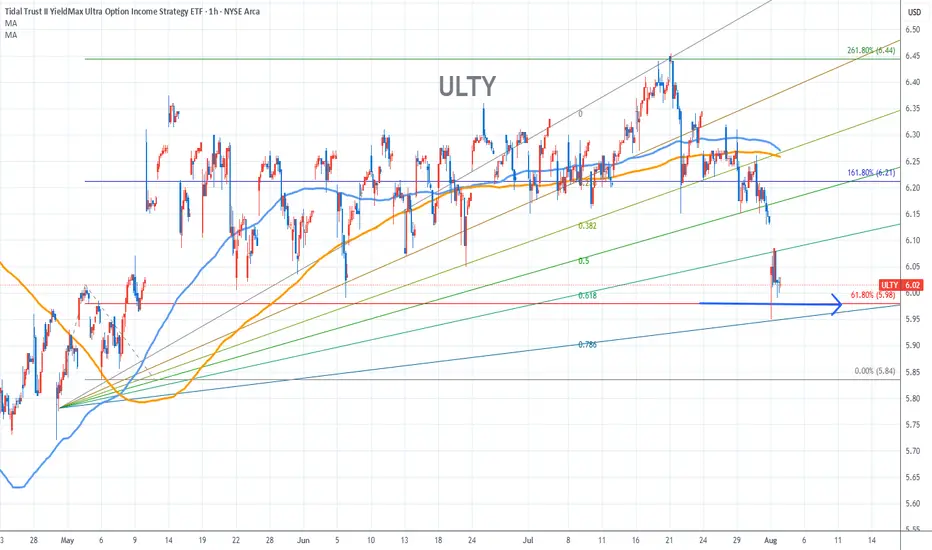
Ulty Stock Chart Fibonacci Analysis 080125Trading Idea
1) Find a FIBO slingshot
2) Check FIBO 61.80% level
3) Entry Point > 6.0/61.80%
Chart time frame:B
A) 15 min(1W-3M)
B) 1 hr(3M-6M)
C) 4 hr(6M-1year)
D) 1 day(1-3years)
Stock progress:C
A) Keep rising over 61.80% resistance
B) 61.80% resistance
C) 61.80% support
D) Hit the bottom
E) Hit the top
Stocks rise as they rise from support and fall from resistance. Our goal is to find a low support point and enter. It can be referred to as buying at the pullback point. The pullback point can be found with a Fibonacci extension of 61.80%. This is a step to find entry level. 1) Find a triangle (Fibonacci Speed Fan Line) that connects the high (resistance) and low (support) points of the stock in progress, where it is continuously expressed as a Slingshot, 2) and create a Fibonacci extension level for the first rising wave from the start point of slingshot pattern.
When the current price goes over 61.80% level , that can be a good entry point, especially if the SMA 100 and 200 curves are gathered together at 61.80%, it is a very good entry point.
As a great help, tradingview provides these Fibonacci speed fan lines and extension levels with ease. So if you use the Fibonacci fan line, the extension level, and the SMA 100/200 curve well, you can find an entry point for the stock market. At least you have to enter at this low point to avoid trading failure, and if you are skilled at entering this low point, with fibonacci6180 technique, your reading skill to chart will be greatly improved.
If you want to do day trading, please set the time frame to 5 minutes or 15 minutes, and you will see many of the low point of rising stocks.
If want to prefer long term range trading, you can set the time frame to 1 hr or 1 day.

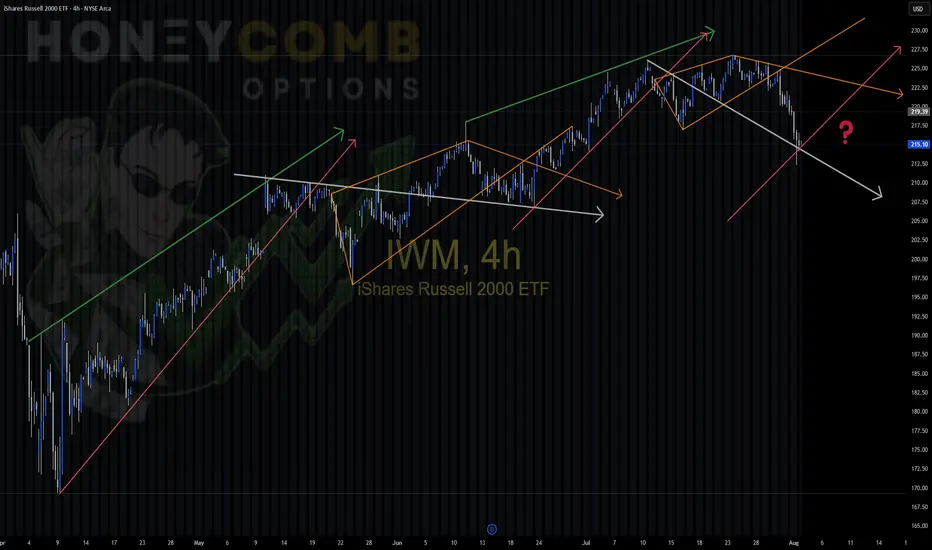
IWM repeating patterns IWM Playing around today noticed similar patterns in this uptrend, color coded for you convenience. Different sizes,, but the patterns are the same. Will we enter a new trend and start a different pattern, or will we stay in the same cycle?
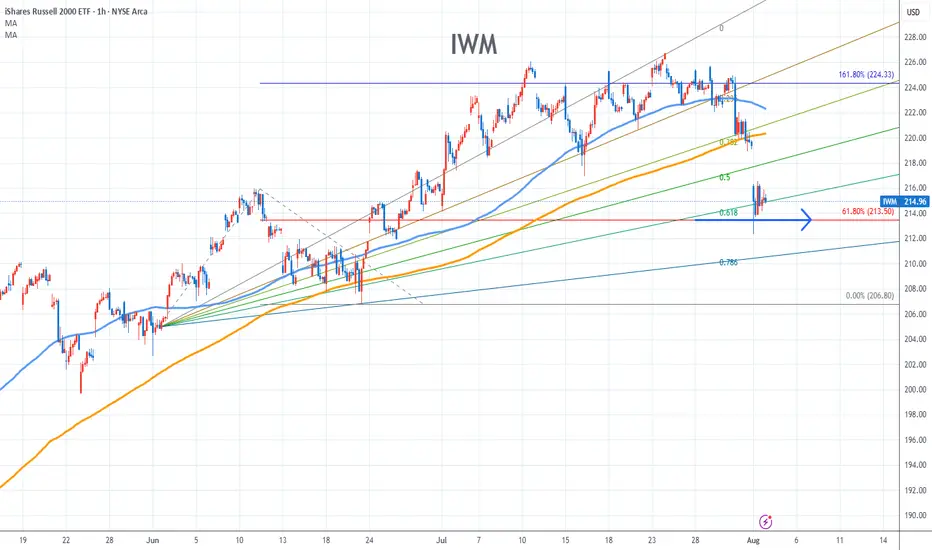
IWM Stock Chart Fibonacci Analysis 080125Trading Idea
1) Find a FIBO slingshot
2) Check FIBO 61.80% level
3) Entry Point > 214/61.80%
Chart time frame:B
A) 15 min(1W-3M)
B) 1 hr(3M-6M)
C) 4 hr(6M-1year)
D) 1 day(1-3years)
Stock progress:C
A) Keep rising over 61.80% resistance
B) 61.80% resistance
C) 61.80% support
D) Hit the bottom
E) Hit the top
Stocks rise as they rise from support and fall from resistance. Our goal is to find a low support point and enter. It can be referred to as buying at the pullback point. The pullback point can be found with a Fibonacci extension of 61.80%. This is a step to find entry level. 1) Find a triangle (Fibonacci Speed Fan Line) that connects the high (resistance) and low (support) points of the stock in progress, where it is continuously expressed as a Slingshot, 2) and create a Fibonacci extension level for the first rising wave from the start point of slingshot pattern.
When the current price goes over 61.80% level , that can be a good entry point, especially if the SMA 100 and 200 curves are gathered together at 61.80%, it is a very good entry point.
As a great help, tradingview provides these Fibonacci speed fan lines and extension levels with ease. So if you use the Fibonacci fan line, the extension level, and the SMA 100/200 curve well, you can find an entry point for the stock market. At least you have to enter at this low point to avoid trading failure, and if you are skilled at entering this low point, with fibonacci6180 technique, your reading skill to chart will be greatly improved.
If you want to do day trading, please set the time frame to 5 minutes or 15 minutes, and you will see many of the low point of rising stocks.
If want to prefer long term range trading, you can set the time frame to 1 hr or 1 day.
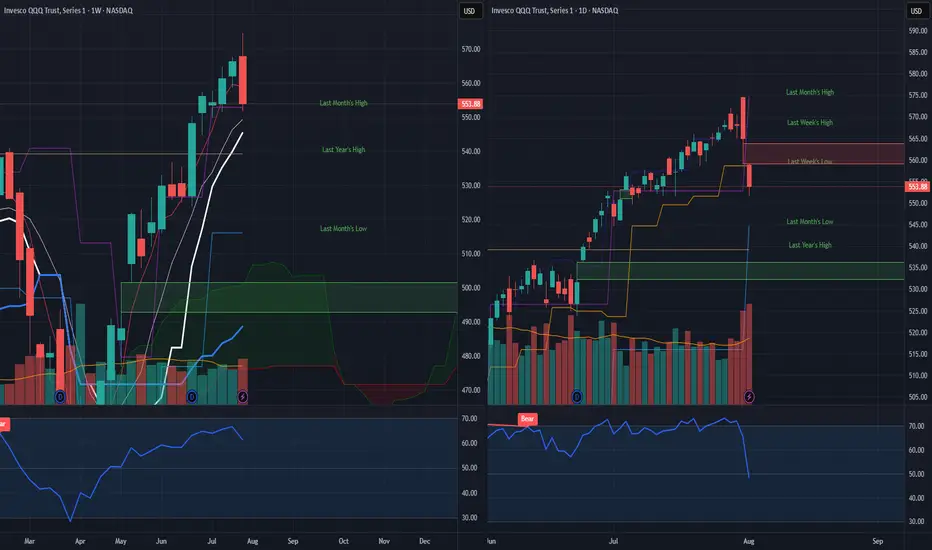
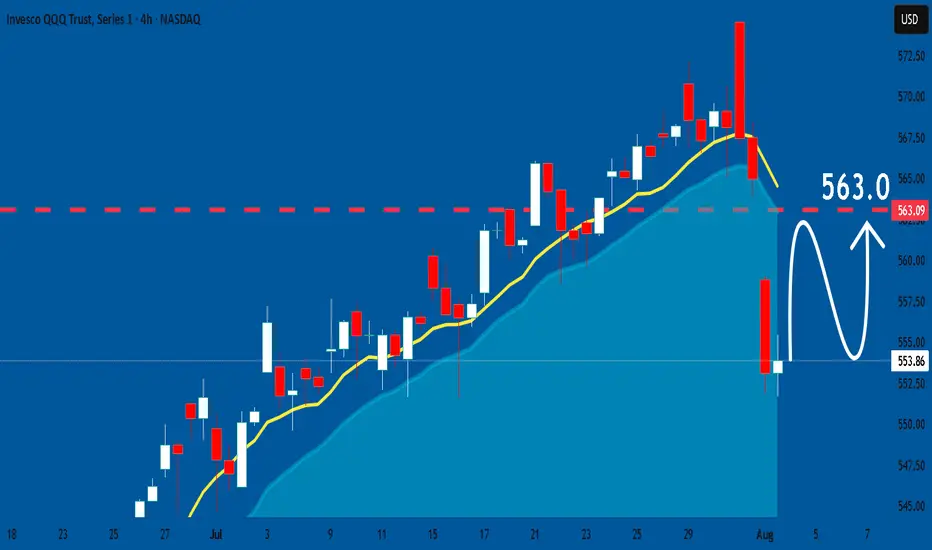
QQQ daily bearish engulfing on Aug 1st. Where is the bottom?Top or temporary top signal spotted on August 1st tariff deadline marked by daily and weekly bearish engulfing candle on indexes.
Where is the bottom? Bullish reversal signal not yet spotted so here are potential scenarios as of now.
Scenario 1: Bull market still in play and reversal will happens to make a higher monthly low. Watch for a closed reversal candle.
Scenario 2: Monthly lower will be set. It's anyone guess where the temp bottom will happen. Here are potential bottom target to monitor:
2.1: Last year's high
2.2: QQQ 536-532 gap
2.3: Daily RSI 30
2.4: Daily RSI bullish divergence
Conclusion, set your alert levels and stay bearish till we see a closed reversal candle.
Stock Market Forecast | TSLA NVDA AAPL AMZN META MSFTStock Market Forecast | CME_MINI:NQ1! CME_MINI:ES1! SPY QQQ
Mag 7 Forecast | NASDAQ:TSLA NASDAQ:NVDA AAPL AMZN META MSFT GOOG

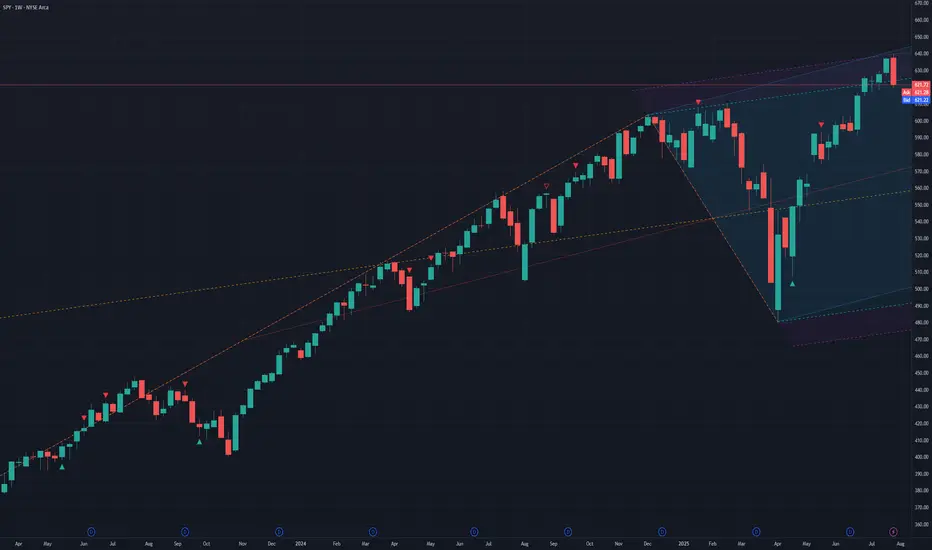
SPY to continue fallingSPY reached a top (resistance) fork line and started to fall. Based on this I entered long on VIX on July 28, when VIX was at its lowest point. I expect this fall of the market to continue.
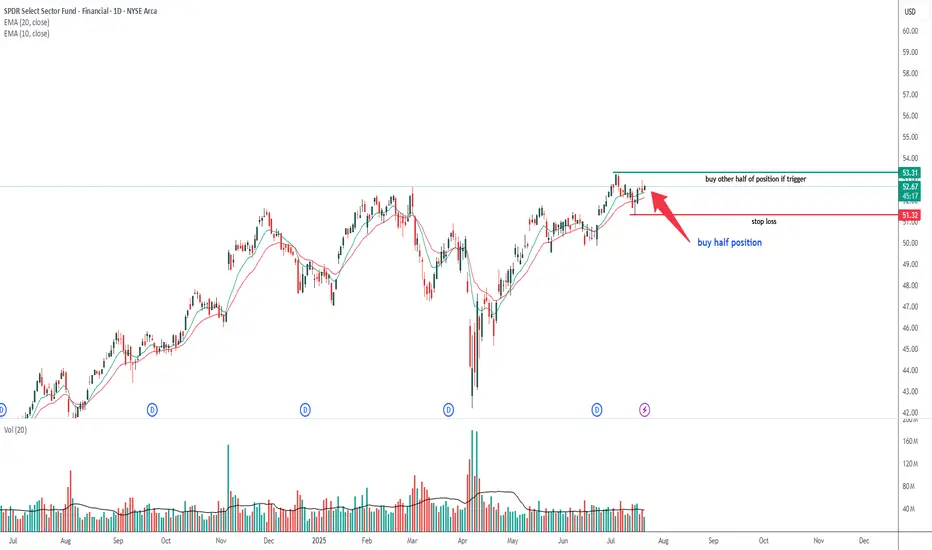
XLF -- Possible trade opportunityXLF -- Possible trade opportunity based of price, volume and chart pattern
PSIL Head and Shoulders confirmed. Here's what I'm looking forWeekly consolidation has started in the sector ETF and so far is very healthy shallow consolidation. This remains a weekly bullflag unless bears can prove it's not.
We must keep an eye on the broader market, although the sector held up remarkably well on Friday on a very red day in the indicies.

QQQ healthy pullback so far - here are my targets for supportQQQ bears show up for the first time in months but zooming out show us the charts are still extremely healthy. Here are some of my targets for areas to find potential support

SPY bears finally show up. Here are my targetsLong term charts still look perfectly fine, and I'm not interested in fighting bears on the first day they show up in months. Here are the targets I'm looking at to find potential support

QQQ: Expecting Bullish Continuation! Here is Why:
Our strategy, polished by years of trial and error has helped us identify what seems to be a great trading opportunity and we are here to share it with you as the time is ripe for us to buy QQQ.
Disclosure: I am part of Trade Nation's Influencer program and receive a monthly fee for using their TradingView charts in my analysis.
❤️ Please, support our work with like & comment! ❤️
Stock Allocation IdeasIf you're building a stock portfolio, how you allocate your money matters as much as what you buy. Here’s a practical, risk-aware approach for retail traders and investors:
1. Core and Satellite Approach
Core (60–70%): Stick with strong, stable companies—large-cap names with reliable earnings like AAPL, MSFT, or JNJ. These form the foundation of your portfolio.
Satellite (30–40%): Use this portion for high-potential ideas—growth stocks, emerging tech (like AI or EV), or small caps. Higher risk, but higher potential return.
2. Mix Between Defensive and Growth Stocks
In volatile markets, lean toward defensive sectors (healthcare, consumer staples, utilities).
In bull markets or improving conditions, increase exposure to growth sectors (tech, consumer discretionary).
3. Blend Growth and Value
Balance high-growth stocks with undervalued, stable companies.
When interest rates are high or inflation is rising, value stocks often perform better.
When rates fall or the economy picks up, growth stocks usually lead.
4. Don't Ignore International Exposure
While U.S. stocks are strong, consider adding 20–30% exposure to global markets (Europe, Japan, or select emerging markets).
5. Stay Disciplined with Rebalancing
Check your portfolio every 3 months.
Take profits where gains have outpaced, and reinvest in areas that are still fundamentally strong but lagging.
Final Tip: Focus on position sizing and risk management. You don’t need to hit every trade—preserving capital and staying in the game is the priority.
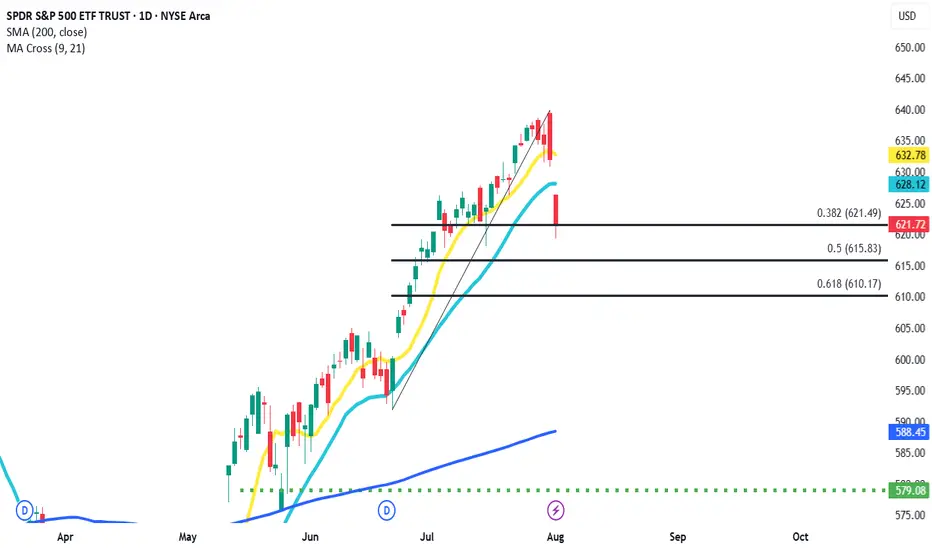
FIBO touch and goPretty violent last couple of days in July, but I honestly think it might be over for now. Price action couldn't break past .38 fibo retracement. If I'm right we could see continuation of uptrend in coming weeks.
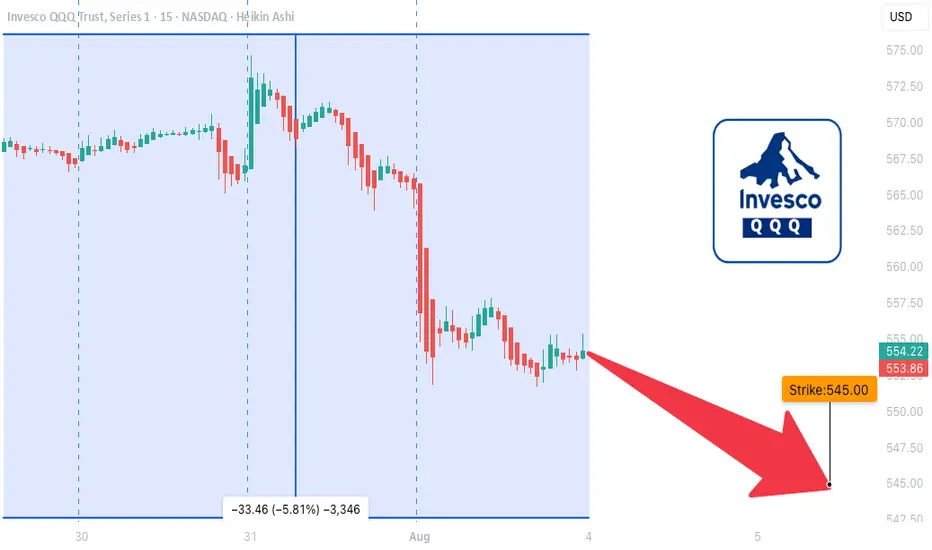
QQQ LEAP Trade Thesis – Aug 1, 2025
🧠 **QQQ LEAP Trade Thesis – Aug 1, 2025**
🎯 **Setup**: High-conviction LEAP PUT
📉 **Bias**: 🔻 *Moderate Bearish*
📆 Horizon: Long-Term (12+ months)
---
📊 **Multi-Model Intelligence Summary**
🧪 **Grok (xAI)**
• Monthly RSI = bearish 📉
• Trading near 52W highs = overvalued 💥
• Suggests: \$545 PUT
🧠 **Gemini (Google)**
• High conviction bearish
• Suggests: \$590 PUT (expensive premium)
🧬 **Claude (Anthropic)**
• RSI breakdown = confirmed weakness
• Recommends: \$530 PUT for max downside
🦾 **Meta (LLaMA)**
• Moving averages turning over
• Suggests: \$555 PUT – moderate confidence
🛰️ **DeepSeek**
• Long-term RSI confirms bearish drift
• Volatility ideal for LEAP entries
• Recommends: \$545 PUT
---
📍**MODEL CONSENSUS**
✅ Bearish trend across all models
✅ Favorable volatility (VIX ✅)
✅ Overvaluation = downside pressure
⚠️ Strike variance across models → we anchor at **\$545** for balance
---
💼 **TRADE SETUP (LEAP PUT)**
• 🔻 Direction: PUT (Short)
• 🎯 Strike: **\$545**
• 📆 Expiry: **2026-09-18** (413 days)
• 💰 Entry Price: **\$38.33**
• 🎯 Target: **\$76.66**
• 🛑 Stop: **\$24.91**
• ✅ Confidence: **75%**
• ⏰ Entry: Monday Open
• 📏 Size: 1 contract
---
📌 **Narrative**:
Every model says the same thing: RSI rollover, inflated price, and perfect LEAP conditions. Institutions are neutral → retail can front-run the decay. You don’t often get long-dated PUTs this clean.
🎯 Asymmetric risk/reward.
📉 Macro setup aligns.
🎯 Strong long-term positioning play.
---
🧠 Stay smart. Position early. Ride the macro shift.
🔔 Like + Follow for more AI-driven trade setups.
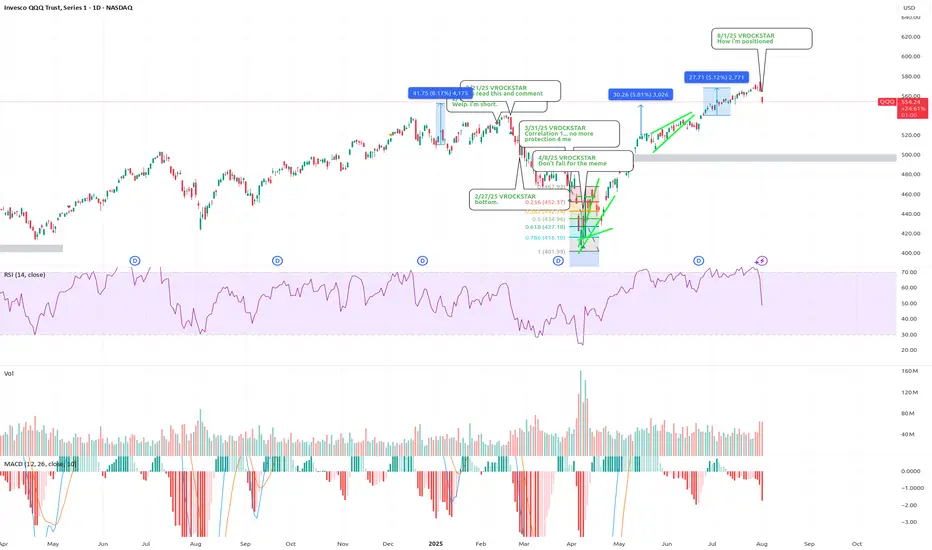
8/1/25 - $qqq - How i'm positioned 8/1/25 :: VROCKSTAR :: NASDAQ:QQQ
How i'm positioned
- 2x leverage on the whole book. 75% at risk so 150% gross
- so 25% powder
47% obtc
30% nxt (12.5% leaps)
36% deck (ST and leaps for 6.5%)
27% lulu (ST gas for 1% lol!)
8% mstr (ST gas for 80 bps lol!)
5% gme (ST gas for 40 bps!)
5% ses (covered with calls at 1 strike already)
be well. let's attack monday.
if we dip monday i think >50% chance that's the low
if we don't, i think >30% chance we go higher
so i'm bidding this selectively w balance of ST gas and high conviction plays.
V
SPY: I think dollar milkshake is brewing, buying for long term📉 SPY Daily Breakdown – Aug 1, 2025 | VolanX Observations
🧠 Bot failed today, but the market taught more than any trade could have. Sitting out gave me the clarity to reassess structure and edge.
🔍 Market Structure Update:
Gap Down from Premium Zone: Today’s price action rejected the weak high and created a clean daily gap — signaling potential distribution at the top.
ORB (15-min) marked and ready: Likely to be retested on Monday. If price rallies into this zone and rejects, that’s where I’ll look for short entries.
Friday Bearish Close Rule: Statistically, when Friday closes red with strong momentum, Monday tends to follow — especially after a gap-down open.
🧭 Big Picture Outlook:
Liquidity Zones Below:
600 → First institutional reaction zone.
580 → Deeper demand and equilibrium area from previous consolidation.
Dollar Milkshake Brewing: Strong USD thesis could pressure equities short-term. This aligns with potential flow into defensives and out of high beta.
Long-Term Bias: Watching for deep discounts. If price moves into high-value demand zones, I’ll accumulate for the long haul — buying fear when it's priced in.
📌 What I’m Watching Next Week:
Monday open – will we see Gap & Go or a Gap Fill + Fade?
Reaction to ORB zone.
Volatility behavior and volume footprint in the first 90 minutes.
🔻 No trades today due to a bot error, but ironically, that gave me better vision. Sometimes, the best trades are the ones you don’t take.
VolanX Protocol engaged. Standing by.
