A tale of two wedgesIn early 2025 we’ve seen two classic wedge patterns on two of the market’s most watched charts: a falling wedge on the U.S. Dollar Index ( TVC:DXY ) and a rising wedge on the S&P 500 ETF ( AMEX:SPY ). Alone each tells its own tale—but together they sketch a tug‑of‑war between a fading dollar and resilient equities.
The Falling Wedge on DXY
A falling wedge in a downtrend signals waning bearish momentum and often precedes a bullish reversal once price breaks the upper trendline.
The Rising Wedge on SPY
A rising wedge in an uptrend is classically a bearish reversal pattern —a breakdown below the lower trendline confirms sellers are gaining control.
A Converging Reversal
Given the well‑known inverse correlation between the dollar and most assets, it’s noteworthy that both asset classes are flashing signs of a reversal. Taken together that makes a compelling argument.
ETF market

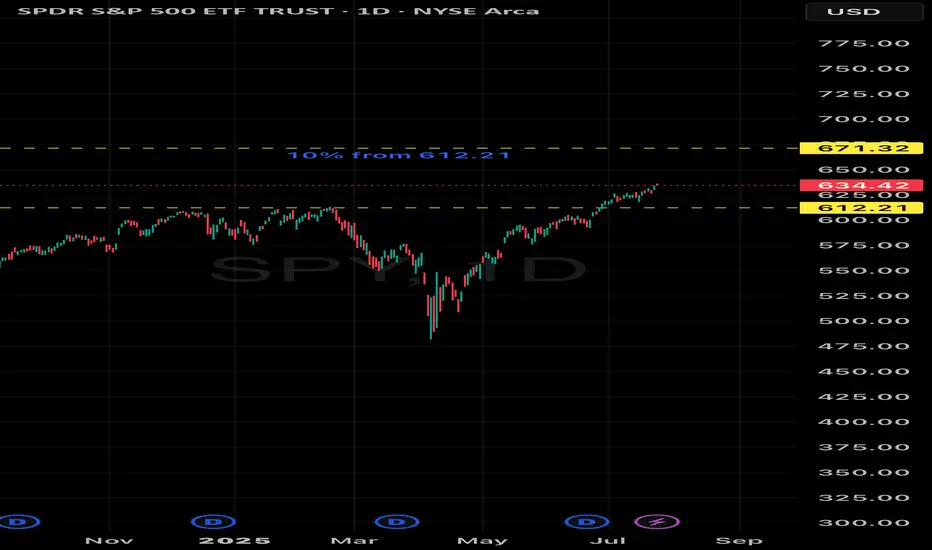
Spy ATH prediction by end of 2025 10% from 613 triple top ATH major major level. I think SPY see 672 before 2025 is over 🔮
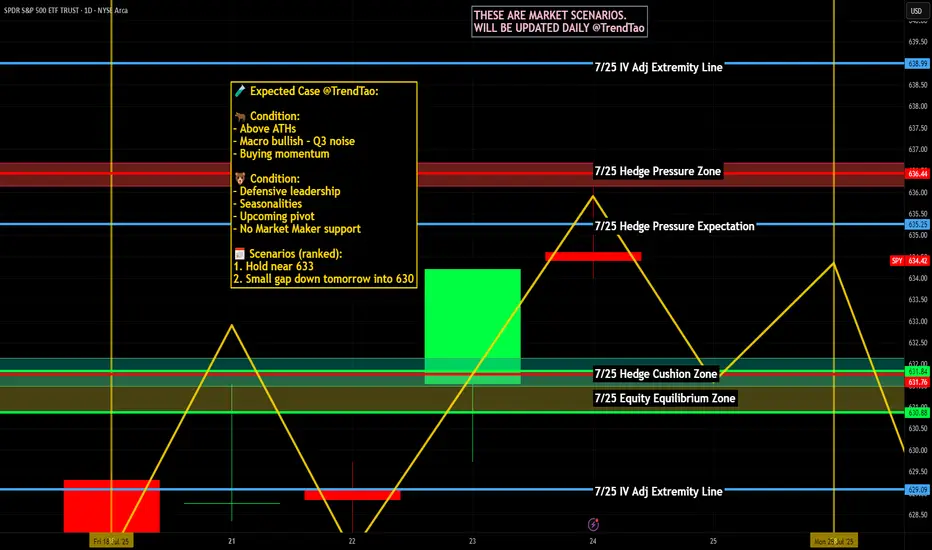
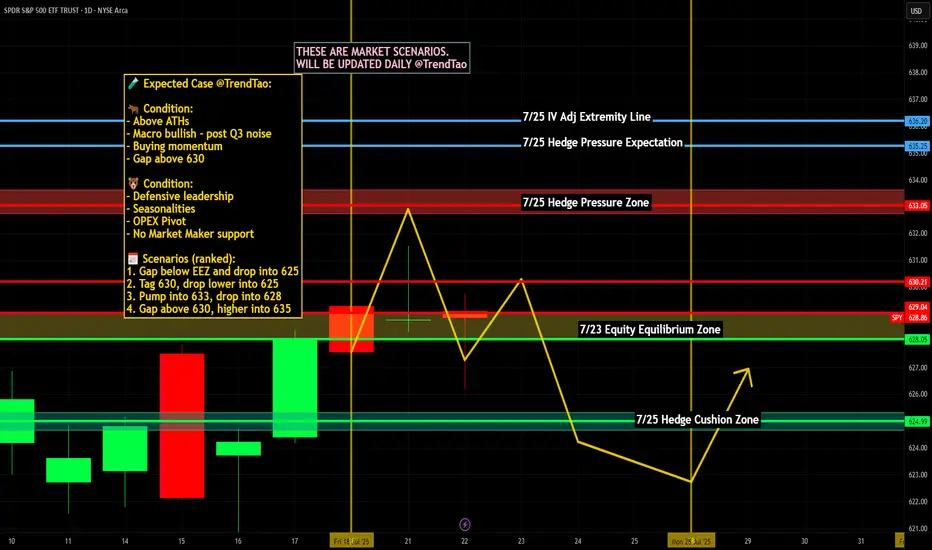
Nightly $SPY / $SPX Scenarios for July 25, 2025🔮 Nightly AMEX:SPY / CBOE:SPX Scenarios for July 25, 2025 🔮
🌍 Market‑Moving News 🌍
🏔️ Copper Market Flashpoint
Following President Trump’s announcement of steep copper tariffs (15–50% range), U.S. copper futures surged, then sharply reversed. Inventory arbitrage between CME and LME markets surged, distorting pricing dynamics and triggering concern over metal market stability.
🇪🇺 EU–China Summit Signals Trade Reset
EU leaders concluded their 25th summit with China, fostering deeper economic and strategic ties. Observers expect follow-up on mutual trade agreements, particularly regarding tech and sustainability sectors.
🌍 EM Equity Rally Consolidates Gains
Emerging markets continue to outperform global equities in 2025—with MSCI EM up ~18% vs. S&P 500. Analysts highlight strong opportunities in AI/fintech stocks in China and Latin America, suggesting further rotations out of U.S. markets.
📊 Key Data Releases & Events 📊
📅 Friday, July 25:
8:30 AM ET – Durable Goods Orders (June):
Forecast shows a sharp drop (~–10%), following a ~16% gain in May—signaling possible cooling in business-related equipment purchases.
10:00 AM ET – U.S. Imports of Steel Products (June):
Trade-data release monitoring steel flows amid evolving tariff frameworks.
All Day – Corporate Earnings Reports:
Companies such as First Financial Bancorp (FFBC), HCA, AON, Charter, and others report earnings. Outlooks may influence small- to mid-cap sentiment.
⚠️ Disclaimer:
This report is for educational and informational purposes only—not financial advice. Always consult a licensed financial advisor before making investment decisions.
📌 #trading #stockmarket #economy #data #earnings #commodities #EM #technicalanalysis
REMX Long - Buy and hold tradeThe price of ETF REMX is increasing fast on high volume. This is one of the best signs to buy. In this situation I prefer a buy and hold trade. Just my personal view - no financial advice!

XLU Short1. Market Structure Overview
1.1 Change of Character (CHoCH) – 86.01
Marked a bearish shift after price broke below a significant higher low.
Suggests that the prior bullish trend has lost strength.
1.2 Break of Structure (BOS) – 84.07
Confirmed a bearish continuation, breaking below the previous support level.
Validates the downtrend structure following the CHoCH.
2. Supply & Demand Zones
2.1 Supply Zones (Resistance)
Zone A: 85.40–86.01
Major Supply zone created by distribution before the sharp sell-off.
Acts as strong resistance; sellers aggressively entered at this level.
Zone B: 84.80–85.20 (0.5 Level)
Intermediate Supply—likely a reaction zone for institutional sell limits.
Price could stall or reverse from this level before testing Zone A.
2.2 Demand Zones (Support)
Zone C: 83.45–83.80
First Major Demand—price reacted here previously with a strong bounce.
A break below could expose lower demand.
Zone D: 82.50–82.90
Deeper Demand—represents a high-probability buying area if Zone C fails.
3. Price Action in Bordered Region
Current Price (~84.69): Price is climbing toward supply after a local low.
Expected Move: Price is likely to:
Reach into Zone B (84.80–85.20).
Potentially reject from supply and continue downward.
If rejection occurs, price is expected to revisit Zone C (~83.50–83.80).
Bullish Scenario: If price breaks above 85.20 and sustains above 86.01, bullish continuation becomes likely.
Bearish Scenario: Rejection from current supply areas confirms continuation of the downtrend.
4. Structure & Momentum Outlook
Bias: Bearish, unless 86.01 is broken and flipped into support.
Momentum: Price is currently retracing with moderate strength. If supply absorbs buyers in Zone B, momentum will likely reverse to the downside.
Key Level to Watch: 85.00–85.20 area for reversal confirmation.
5. Supporting Financial Context
Sector Rotation: The Utilities sector (XLU) has seen recent inflows and outflows tied to market volatility and interest rate speculation.
Rate Sensitivity: Utilities are interest-rate sensitive, and the market is pricing in uncertainty around Fed cuts, adding pressure to the sector.
Recent Sentiment: Some analysts view defensive sectors like utilities as range-bound or underperforming during growth-driven rotations (CNBC, Bloomberg).

IWM Short1. Broader Market Structure 📉
1.1 Change of Character (CHoCH)
Occurred near the top (~226.70), breaking the prior higher low—signaling a shift from bullish to bearish momentum.
1.2 Break of Structure (BOS)
Confirmed by a move below that level, validating the bearish change and underlining a downtrend in progress.
2. Supply & Demand Zones
2.1 Demand Zones (Support)
Price zones where buyers have previously stepped in, marking potential reversal points:
Zone A (~223.00–223.50) – First layer of support; price tested this zone after the BOS.
Zone B (~221.80–222.20) – Mid-range demand area with historical buyer activity.
Zone C (~220.00–220.50) – Deeper support zone; last line before structural lows.
Key Takeaway: These zones represent probable stops for a short-term pullback and are ideal for long-entry decisions.
2.2 Supply Zone (Resistance)
~226.70–226.75 – Located at the level where BOS occurred; acts as near-term resistance where sellers may reassert control.
3. Price Action Inside the Bordered Area
Current Price (~224.55): Hovering between the supply and first demand zone.
Expected Movement:
A pullback into Zone A (~223.00–223.50).
If demand holds, look for a bullish reaction—forming a higher low, potentially pushing price back toward 226.70+.
Bearish Risk: A break below Zone A increases downside risk into Zone B or C, reinforcing the bearish structure.
4. Momentum & Structure Outlook
Bullish Scenario: A bounce from demand with structure preserved (~higher low) could lead to short-term upside into resistance.
Bearish Scenario: A drop below the bordered demand zone would confirm continuation of the downtrend.
Watch: Price structure around the 224–223 area and reversal cues (e.g., rejection candles, volume spikes).

XLY eyes on $198: Major resistance zone for recovery wave XLYXLY is a key etf/index to evaluate tariff sentiment.
Currently fighting a major resistance $197.88-193.23
Look for a Break-and-Run or Reject hard from here.

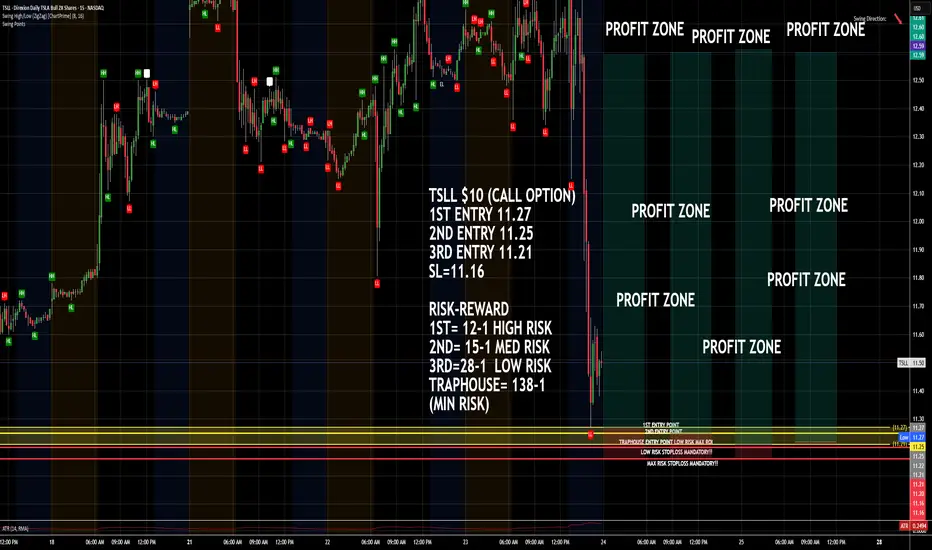
TSLL $10 CALL OPTIONIf price drops done into entry zone which is detailed on the chart, Enter the trade with a Call Option $10 or below!! Remember to set your stop loss!! Trap has potential!
P.S. If when market opens and share price doesnt drop but continue to rise from that point, then just enter in on a call and cross your fingers lol!!! But price should go up because of that dramatic drop !!!
CYMPLE
PSIL Daily bullflag approaching next monthly resistanceGreat looking chart, very nice setup indicating sector bullish continuation is likely. 4hr uptrend remains our guide with the last 4hr HL off of EMA12.
Support: 16.19
Resistance: 17.00. 17.60, 18.20

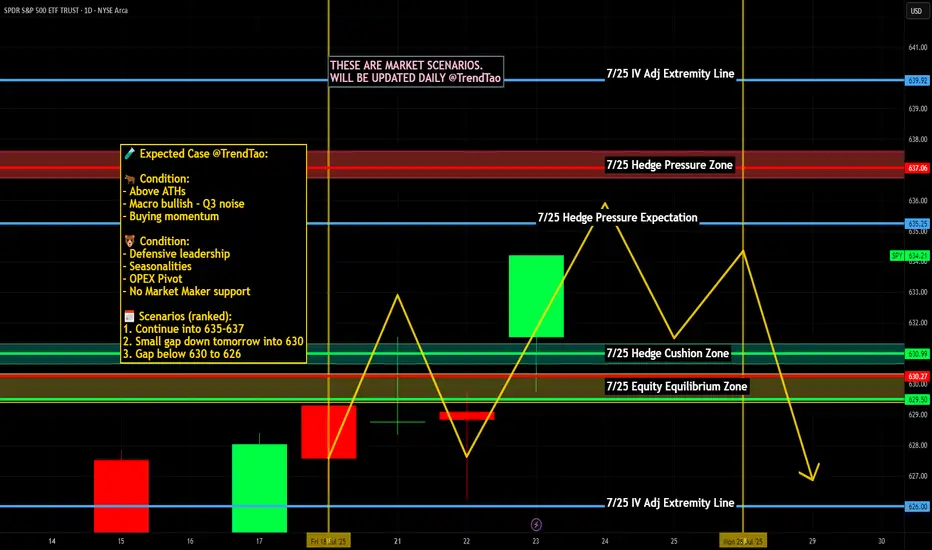
Nightly $SPY / $SPX Scenarios for July 24, 2025🔮 Nightly AMEX:SPY / SP:SPX Scenarios for July 24, 2025 🔮
🌍 Market-Moving News 🌍
🤝 U.S.–EU & U.S.–Japan Trade Optimism Lifts Sentiment
The S&P 500 and Nasdaq hit record-high closes on July 23, fueled by optimism over a potential U.S.–EU trade deal mirroring the U.S.–Japan framework, with the EU-set tariff on autos potentially halved to 15%
💵 Dollar Retreats, Yields Climb
As markets shifted toward risk assets, U.S. Treasury yields increased and gold softened, while the dollar eased—highlighting growing confidence in trade-driven growth news
🏦 Fed Independence Under Pressure—But No July Cut Expected
A Reuters poll shows economists see heightened political pressure on the Fed jeopardizing its independence, though the consensus remains that rates will stay unchanged this month
📊 Key Data Releases & Events 📊
📅 Thursday, July 24:
8:30 AM ET – Initial Jobless Claims
Weekly tally of new unemployment benefit applications—key indicator of labor-market conditions.
10:00 AM ET – New Residential Sales (June)
Tracks signed contracts for new homes, offering insight into housing demand under tightening mortgage rates.
All Day – Trade Headlines & Fed Watch
Continued focus on U.S.–EU trade developments and any follow-up to Fed independence concerns from policy circles.
⚠️ Disclaimer:
This information is for educational and informational purposes only—not financial advice. Please consult a licensed financial advisor before making investment decisions.
📌 #trading #stockmarket #trade #economy #Fed #housing #jobs #technicalanalysis
SLV 1H OTE food for thoughts hereLooks like it’s gone for good, but hey—I’m still waiting on that 1H pullback before I touch it.

IWM short 224 and 224.25Shorted IWM going into resistance
on daily. Target is 216 I will take 3/4 off re add when breaks
the 50 day 212.57 and 100 day 205.12 watch daily stoch see they roll over
Look weekly rolling over but needs break 68%. Look weekly making lower highs
See we can get a follow thru selling today with more selling vol
Have trailing stop in place

SOXL; bearish for next few daysthe strongest prior support is now providing pretty strong resistance over the past several days .. seems very possible for SOXL to pull back for a few days (maybe dropping to around $24-25

What mind are you bringing to the trading desk?This channel is not providing individualized trading or investment advice, nor is it a banking service, brokerage service, trading service, investment service or money management service

ARKK: when a breakout isn’t just a breakout-it’s a runway to $91On the weekly chart, ARKK has broken out of a long-standing ascending channel, ending a year-long consolidation phase. The breakout above $71.40, with a confident close and rising volume, signals a transition from accumulation to expansion. The move came right after a golden cross (MA50 crossing MA200), further confirming institutional interest. Price has already cleared the 0.5 and 0.618 Fibonacci retracements — and the 1.618 extension points to $91.40 as the next technical target.
Momentum indicators like MACD and stochastic remain bullish with room to run. Volume profile shows low supply above $75, which could fuel an acceleration toward the target zone.
Fundamentally, ARKK remains a high-beta, high-risk vehicle — but one with focus. The ETF is positioned around next-gen tech: AI, robotics, biotech, and automation. Assets under management now exceed $9.3B with +$1.1B net inflow in 2025. YTD return stands at 37%, and its top holdings (TSLA, NVDA, COIN) are back in favor. This isn’t just a bet on innovation — it’s diversified exposure to a full-blown tech rally.
Tactical setup:
— Entry: market $69.50 or on retest
— Target: $80.21 (1.272), $91.40 (1.618 Fibo)
Sometimes a breakout is just technical. But when there’s volume, a golden cross, and billions backing it — it’s a signal to buckle up.

A potential chance to get long position of Korean equity marketsKorean economy and stock market emotion are well boosted by their regulation reform and new president elect. Many global traders miss the previous uptrend and the price is about to test the current resistance again.
Imma use a buy stop order @73.67 to try to get in the train to diverse my long position on equity market.
If you only do swing trades, there's a long swing trade plan on my chart. I may use the latest to take half of profit once the price hit the first or second resistance @77.43 above the current trading area to control the position size that can fit for long term trade.

Nightly $SPY / $SPX Scenarios for July 23, 2025🔮 Nightly AMEX:SPY / SP:SPX Scenarios for July 23, 2025 🔮
🌍 Market-Moving News 🌍
📈 Morgan Stanley Stays Bullish
Morgan Stanley reaffirmed its optimistic view, forecasting the S&P 500 will reach 7,200 by mid‑2026. They cited strong earnings and anticipated rate cuts as key drivers, though warned of risks from rising Treasury yields and tariff-related cost pressure
📉 Inflation Debate Reignites
A renewed debate is underway regarding whether tariffs are "transitory" or persistent inflation drivers. Treasury counselor Joseph Lavorgna argued tariff impacts will be one-off, while others caution long-term price pressures may persist, complicating Fed policy directions
🏛️ Calls for Fed Reform Intensify
Treasury Secretary Scott Bessent suggested structural reforms to the Federal Reserve could have greater long-term impact than removing Chair Powell, highlighting ongoing concerns over central-bank governance amid political criticism
💳 Investors Shift to Corporate Bonds
As equity valuations have surged, investors are reallocating toward investment-grade corporate bonds, reducing credit spreads to the tightest levels since 1998—a sign of elevated risk appetite balanced with caution
📊 Key Data Releases & Events 📊
📅 Wednesday, July 23:
(No major U.S. economic releases)
Market focus remains on tech earnings (Tesla, Alphabet) and Fed signals following Tuesday’s Powell address.
⚠️ Disclaimer:
This information is for educational/informational purposes only and does not constitute financial advice. Please consult a licensed financial advisor before making investing decisions.
📌 #trading #stockmarket #economy #tariffs #Fed #earnings #corporatebonds
SPY "SP500 ETF" 1️⃣ Market Structure Overview
Change of Character (CHoCH) – Level: 626.19
The market printed a clear CHoCH at 626.19, breaking below a recent higher low. This shift signals the end of bullish dominance and marks the first warning of potential trend reversal. It’s a critical structure break indicating weakness in prior buy-side momentum.
Break of Structure (BOS) – Level: 631.54
A firm Break of Structure followed at 631.54, confirming the downtrend. This BOS came after price failed to establish a new high and instead reversed from the premium area, solidifying bearish continuation. It now acts as a key upper boundary for sellers.
2️⃣ Demand Zone Analysis (Support Levels)
The demand zones (green areas) are historical locations where price previously reacted strongly to the upside—suggesting institutional buying or significant liquidity absorption. These zones act as potential long-entry areas and support during pullbacks:
625.50: Immediate demand zone; price has hovered above this level recently, signaling short-term support.
624.80: Strong base formed after earlier accumulation; minor rally originated here.
623.80: Clear area of bullish imbalance; look for wick rejections here.
622.75 & 621.90: Deeper demand zones—likely to hold if the market retraces further and volatility spikes. These levels represent high-probability reversal points if liquidity sweep occurs below 624.
Each zone increases in risk/reward the deeper price pulls back, but also carries a higher chance of forming strong bullish reaction.
3️⃣ Supply Zone Analysis (Resistance Levels)
The supply zone (red area) at 628.85–631.54 was the origin of the last sharp bearish move following the BOS. It now acts as a potential reversal or distribution zone:
628.85 – 631.54:
This area previously held heavy sell-side interest and rejected bullish advances. It overlaps with a structural BOS and sits near the high of the prior rally. Watch for bearish price action or lower-timeframe exhaustion here. A break and close above 631.54 would invalidate this zone and indicate a major structural reclaim.
4️⃣ Current Price Action (Inside the Marked Border)
Price is currently reacting around 627, just above the CHoCH level (626.19). This zone lies between the upper boundary of the nearby demand and the lower edge of the supply. Within this boxed region:
Price is showing temporary consolidation, suggesting indecision.
A short-term dip into the 625.50–624.80 demand cluster is expected before any bullish leg.
If price holds above 626.19 and shows reversal signals (like bullish engulfing, hammer, or low-volume rejection), we may see continuation to test the 628.85–631.54 supply zone.
If structure fails and price breaks below 626.19 with conviction, the next downside targets are deeper into the 622–624 range.
This bordered zone represents a transitional area where the next directional move will likely be decided.
5️⃣ Momentum & Structure Bias
Structure remains bearish after the BOS, but current price is attempting to build a base.
If price maintains above CHoCH (626.19) and demand levels begin to hold, we may enter a bullish corrective phase.
Watch for rising volume on bullish candles or absorption wicks in demand zones as confirmation.
6️⃣ Macro/Fundamental Context (as of July 22, 2025)
While the chart is technical, the SPY ETF (S&P 500) is influenced by broader economic data. Around this date, watch for:
Earnings Season: Mid to late July often brings earnings from major S&P 500 companies. Positive tech earnings can fuel bullish momentum.
FOMC Speculation: If investors expect no rate hike or a dovish Federal Reserve stance, demand zones are more likely to hold.
Economic Reports: Look out for PMI or consumer confidence reports this week. A weak reading may drive SPY lower into demand, while a strong reading could help push it toward the supply zone.
If any bullish macro surprise occurs this week, it would support the bounce from the demand zone.

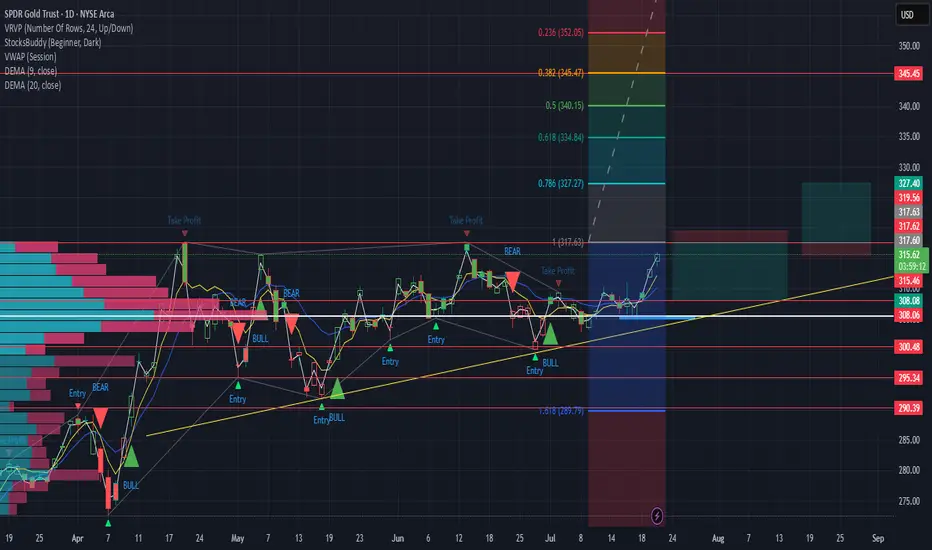
GLD up or down plan OK, tell me if this makes sense. if it rejects off of the 317.60ish area i would trade back to the down side to $308.10 ish - 4.80 R/R. If it breaks out and retests I would be trading to 327 area. 4.5 R/R - Let me know what you see and your thoughts. i'll try to share what i did.
DIA "Dow Jones Ind Ave. ETF"DIA 15-Minute Technical Outlook
The DIA chart reflects a short-term corrective structure within a broader bullish sequence. Recent price action has established new break-of-structure (BOS) highs, followed by a pullback toward a key internal liquidity zone. Your zones (supply and demand borders) are strategically placed and suggest an imminent inflection point.
🔍 Market Structure Overview:
A Bullish Break of Structure (BOS) occurred at 446.91, confirming bullish control in the short term.
Price has since retraced from this high, forming a local lower high near the 0.5 fib level of the last impulse, indicating a healthy pullback phase.
The recent Change of Character (ChoCH) at 442.12 aligns with a potential short-term retracement target and serves as a key validation level.
🟩 Demand Zone Analysis
Level: ~440.60–442.00
This green zone is supported by multiple confluences:
A prior liquidity sweep and bullish impulse, signaling strong buyer interest.
Proximity to the ChoCH, adding structural significance.
A demand imbalance that remains unmitigated, making it a likely reaction zone.
📌 Expectations: A retracement into this zone may provide a low-risk long opportunity targeting a retest of the 446.00–447.50 supply cluster.
🟥 Supply Zone Analysis
Level 1: ~446.00–446.91 (short-term supply near BOS)
Level 2: ~447.60–449.00 (higher-timeframe unmitigated supply)
These zones represent areas of historical selling pressure and potential liquidity traps where price may encounter resistance. The stacking of zones increases the potential for a reaction or short-term rejection.
📌 Expectations: Should price approach these levels post-demand bounce, tight management or scaling out is advised.
📈 Technical Confluence Points:
Fib Retracement (0.5): Price is hovering near the 0.5 level of the recent bullish leg (~444.05), acting as interim support.

SPY Options Analysis Summary (2025-07-22)
🔻 AMEX:SPY Weak Bearish Put Setup (0DTE) – 07/22/25
All models agree: price is weak, momentum is limp, and VWAP is above.
But conviction? Not unanimous. High-risk, high-reward 0DTE scalpers only.
⸻
📉 Trade Setup
• 🟥 Direction: PUT
• 🎯 Strike: $626.00
• 💵 Entry: $0.57
• 💰 Target: $1.70 (+200%)
• 🛑 Stop: $0.28 (–50%)
• 📅 Expiry: Today (0DTE)
• ⚖️ Confidence: 65%
• ⏰ Entry Timing: Market Open
⸻
🧠 Multi-AI Consensus
Model Bias Action
Grok/xAI Weak Bearish ⚠️ No Trade
Claude Weak Bearish ⚠️ No Trade
Gemini Bearish ✅ $627 Put
Llama Moderately Bearish ⚠️ Conservative Put
DeepSeek Bearish ✅ $626 Put
🔹 VWAP < Price = Bearish bias
🔹 RSI = Neutral → watch for fakeouts
🔹 VIX favorable (<22)
🔹 Volume = weak = risk of whipsaw
⸻
⚠️ Risk Notes
• Bounce risk off session lows is real
• Lack of momentum may cause theta burn
• Best for scalpers who react fast — not a swing trade
• No conviction = smaller size, tighter leash
⸻
📢 Tagline (for virality):
“ AMEX:SPY is limping, not bleeding. But if it breaks, 200% comes fast. 0DTE scalpers: this is your window.” 💣

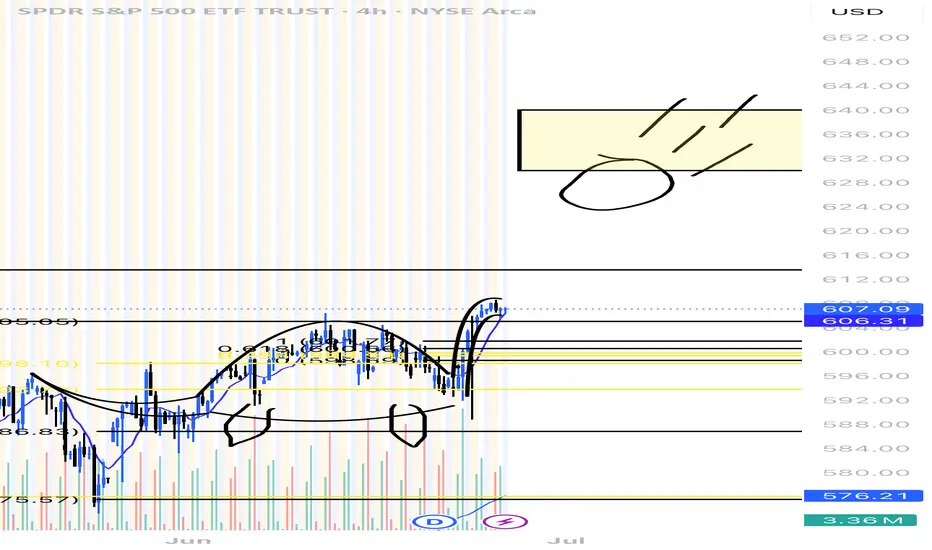
Dinosaur gets hit by a meteor We can see a clear breakout from previous lows only target left is that meteor at 630-640.
We will see this by the end of july!
Bearish DivergencesWe could be running out of steam here. This to me looks like the final leg of the grand supercycle in semis. Bearish divergences on the RSI and a final 5th wave move up. If we reach $300 I’d expect a rejection and possible roll over. Keep an eye on this, retail are loading up but the charts don’t support the hysteria at these levels.
Not financial advice
