XAU/USD 08 June 2025 Intraday AnalysisH4 Analysis:
-> Swing: Bullish.
-> Internal: Bullish.
You will note that price has targeted weak internal high on two separate occasions forming a double top which is a bearish reversal pattern. This is in-line with HTF bearish pullback phase.
Remainder of analysis and bias remains the same as analysis dated 23 April 2025.
Price has now printed a bearish CHoCH according to my analysis yesterday.
Price is now trading within an established internal range.
Intraday Expectation:
Price to trade down to either discount of internal 50% EQ, or H4 demand zone before targeting weak internal high priced at 3,500.200.
Note:
The Federal Reserve’s sustained dovish stance, coupled with ongoing geopolitical uncertainties, is likely to prolong heightened volatility in the gold market. Given this elevated risk environment, traders should exercise caution and recalibrate risk management strategies to navigate potential price fluctuations effectively.
Additionally, gold pricing remains sensitive to broader macroeconomic developments, including policy decisions under President Trump. Shifts in geopolitical strategy and economic directives could further amplify uncertainty, contributing to market repricing dynamics.
H4 Chart:
M15 Analysis:
-> Swing: Bullish.
-> Internal: Bullish.
H4 Timeframe - Price has failed to target weak internal high, therefore, it would not be unrealistic if price printed a bearish iBOS.
The remainder of my analysis shall remain the same as analysis dated 13 June 2025, apart from target price.
As per my analysis dated 22 May 2025 whereby I mentioned price can be seen to be reacting at discount of 50% EQ on H4 timeframe, therefore, it is a viable alternative that price could potentially print a bullish iBOS on M15 timeframe despite internal structure being bearish.
Price has printed a bullish iBOS followed by a bearish CHoCH, which indicates, but does not confirm, bearish pullback phase initiation. I will however continue to monitor, with respect to depth of pullback.
Intraday Expectation:
Price to continue bearish, react at either M15 supply zone, or discount of 50% internal EQ before targeting weak internal high priced at 3,451.375.
Note:
Gold remains highly volatile amid the Federal Reserve's continued dovish stance, persistent and escalating geopolitical uncertainties. Traders should implement robust risk management strategies and remain vigilant, as price swings may become more pronounced in this elevated volatility environment.
Additionally, President Trump’s recent tariff announcements are expected to further amplify market turbulence, potentially triggering sharp price fluctuations and whipsaws.
M15 Chart:
Futures market

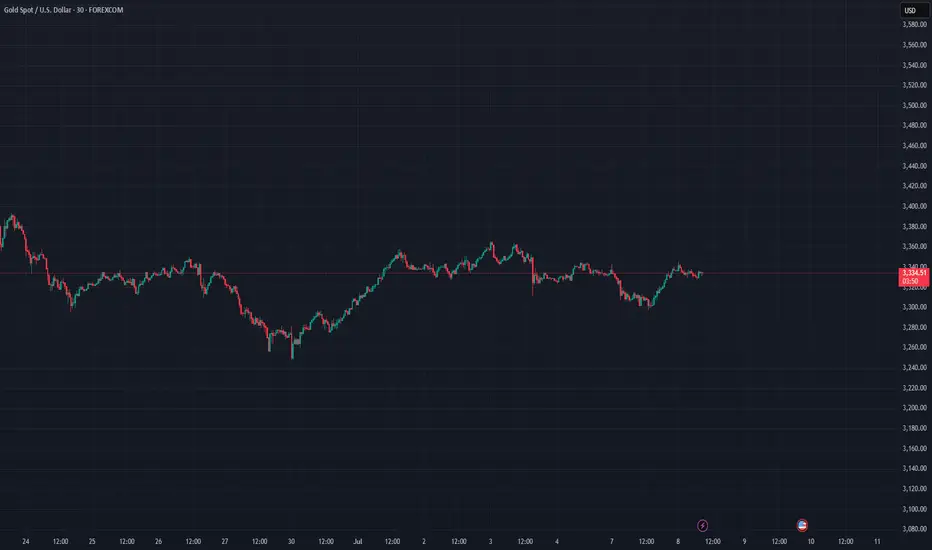
XAUUSD SELL OR BUY (READ CAPTION)Hi trader's what do you think about gold
current price: 3340
gold is rest now in resistance zone i think gold retest down side and giving retrcement
resistance zone 3345_3350
target point :3316_3310
stop loss 3362
please like comment and follow thank you

Report - 8 jully, 2025Trump Grants Three-Week Tariff Reprieve
President Trump has extended the pause on sweeping reciprocal tariffs from July 9 to August 1, providing critical breathing room for US trading partners to negotiate. While this delay briefly steadied sentiment, his renewed threats — specifically a 25% tariff on Japan and South Korea — have reignited global trade fears.
S&P 500 fell 0.9% after the announcement, Nasdaq dropped 0.8%, and the Dow retreated similarly.
Japanese yen and Korean won weakened 1.1% against the USD, underscoring capital flight and potential export growth fears.
Analysts expect continued volatility, but ING suggests the fallout should not match April’s sharp correction when tariffs first roiled markets.
Ukraine Reshuffle: Diplomatic Realignment
Ukrainian President Zelenskyy agreed to replace Ambassador Markarova after criticism from Republicans about her close ties to Democrats. The reshuffle is framed as an effort to "appease" Trump amid paused US arms deliveries.
Zelenskyy also plans to restructure his cabinet next week, emphasizing consolidation of control by his chief of staff, Andriy Yermak.
Potential ambassador candidates include Prime Minister Shmyhal and senior ministers, signaling strategic alignment with US interests.
Russian Transport Minister’s Apparent Suicide
Russia's transport minister, Roman Starovoyt, was found dead in a suspected suicide after his dismissal by President Putin amid a corruption probe.
The case highlights severe internal pressures and the Kremlin’s tightening control.
The Kursk region scandal has drawn public criticism over failed defense construction during Ukraine’s advances.
Germany’s AfD Attempts Image Moderation
The far-right Alternative for Germany (AfD) party introduced a new code of conduct to improve its parliamentary image and broaden voter appeal.
With AfD declared a right-wing extremist group by domestic intelligence, any moderation effort reflects broader attempts to legitimize and normalize extremist platforms before 2029 elections.
China-EU Climate Standoff
The EU declined China’s push for a joint climate declaration ahead of Xi–von der Leyen meetings. Brussels demands firmer emission reduction commitments, reflecting tensions around trade and Russia policy.
The EU proposed a 90% emission reduction by 2040 but faces pushback internally amid fears of economic competitiveness loss.
China remains the world’s largest emitter, and the EU is wary of soft pledges lacking concrete policy changes.
LG Energy Solution Surges on Biden Tax Incentives
LGES posted a 152% YoY surge in Q2 operating profit (₩492bn), defying lower EV demand, largely due to advanced manufacturing tax credits from the US Inflation Reduction Act.
Despite falling sales (-9.7% YoY), early front-loading by automakers helped offset volume risks.
Trump’s new budget plan scraps consumer EV credits but retains production incentives to 2032, which supports battery manufacturers like LGES but may soften downstream demand.
Royal Gold’s $3.7bn Acquisitions Signal Gold M&A Wave
Royal Gold is acquiring Sandstorm Gold and Horizon Copper, expanding its portfolio to 80 producing assets and 266 exploration-stage properties.
Gold’s price strength has fueled an "animal spirits" surge in mining M&A.
Royal Gold’s market cap is projected to rise to ~$15.4bn, reinforcing its position as the only US-based large-cap pure gold streaming and royalty company.
Sibanye-Stillwater Calls for Western Price Support
CEO Neal Froneman advocated for price guarantees on critical minerals to offset Chinese competitive advantages.
He warned that de-globalization trends require Western miners to receive direct support to stay viable.
Sibanye’s expansion into lithium and nickel (Finland and France) reflects the shift to battery metals, but profitability is challenged by higher capital costs and lower platinum/palladium prices.
BP Strengthens Board with Ex-Shell CFO
Simon Henry joins BP’s board to bolster oil & gas expertise amid renewed investor pressure and possible takeover speculation.
BP recently pivoted back to traditional hydrocarbons after Elliott Management took a large stake and pushed for strategic shifts.
BP’s shares have lagged peers, making governance and board composition critical to fend off activist threats.
------------
US Equity Market Sector Trends
From your dashboards:
Utilities (+0.21%) and Staples (+0.07%) were the only positive sectors, highlighting defensive repositioning.
Tech (-0.73%), Discretionary (-1.27%), and Communications (-0.96%) led the declines, reflecting tariff fears and profit-taking in high-beta growth stocks.
Industrials (-0.52%) and Materials (-0.88%) were under pressure, signaling investor concerns over input costs and global demand.
Factors and Style Performance
Low volatility (+0.41%) and momentum (+0.41%) factors outperformed, indicating a flight to stability.
Small caps underperformed sharply (down ~1%), reflecting their greater sensitivity to domestic and policy risks.
Value and high dividend yield factors were slightly negative, reinforcing cautious sentiment.
Currency and Rates Moves
US dollar gained 0.2% against a basket of major currencies, driven by safe haven flows.
EUR/USD slipped 0.5%, and GBP/USD declined 0.3%.
USD/JPY climbed, reflecting yen weakness.
US 10-year Treasury yield rose to 4.39% (+0.05 pp), signaling investor rotation from bonds to cash amid tariff fears.
Global yields mostly edged higher; UK 10-year gilt rose to 4.59%.
Commodities
Gold slipped slightly (-0.1%), despite general risk-off sentiment, reflecting dollar strength and potential profit-taking after recent highs.
Crude oil gained ~1.7% (WTI at $67.97), supported by geopolitical tension and potential supply disruptions.
Industrial metals broadly fell, notably copper (-2.4%), due to China rerouting exports and tariff concerns.
Agricultural commodities showed mixed performance; soybeans and wheat fell (~-2.4%), reflecting improved harvest outlooks.
Global Equity Markets & Country ETFs
European equities showed resilience: DAX +1.2%, CAC 40 +0.4%.
Asia-Pacific mixed: Nikkei -0.8%, China slightly positive, reflecting capital reallocation and local policy adjustments.
Emerging markets underperformed slightly (MSCI EM down ~1.4%), as USD strength pressured flows.
Notably strong YTD performers include Brazil (+16%) and Mexico (+13%), while China and Japan remain subdued.
Fixed Income and Credit Conditions
US fixed income ETFs mostly red; long-duration Treasuries (20+ years) underperformed sharply (-1.0%), reflecting rate sensitivity.
High-yield spreads narrowed slightly, but issuance remains cautious given tariff-related macro risks.
Municipal bonds and short-term corporates showed slight positive performance, reflecting defensive rotation.
Macro Themes & Outlook
Trade Policy Risks Intensify: Extension to August 1 provides temporary relief but does not remove risk. Markets fear escalation with Japan, South Korea, and potentially the EU.
Rotation to Defensives: Investors shifted into utilities, staples, and low-volatility plays, anticipating higher volatility and lower global growth.
Dollar Strength & Rate Adjustments: Strength in USD and higher yields could challenge risk assets, especially in emerging markets.
Commodity Divergence: Energy remains firm on geopolitical concerns; metals weak amid China rerouting and uncertain demand.
Corporate Actions and M&A: Gold sector consolidations continue (e.g., Royal Gold’s $3.7bn acquisitions), indicating bullishness in precious metals, contrasting weakness in industrials and agriculture.
Conclusion & Strategy View
In the near term, we expect continued volatility around August 1 as the tariff deadline nears. Defensive positioning remains prudent, favoring cash, high-quality bonds, and low-volatility equities. For commodities, energy and precious metals are relatively better supported, while industrial metals and agriculture face demand and trade headwinds.
Currency-wise, the USD strength may persist, pressuring EM assets and riskier FX pairs.
We recommend closely monitoring further White House communications and bilateral trade talks, particularly involving Japan and South Korea, to reassess global risk exposure and sector allocations.
#XAUUSD – H1 High Probability Setup
📊 **#XAUUSD – H1 High Probability Setup** 🔍
If you recall our **morning analysis**, we clearly mentioned that price is likely to **mitigate the zone below 3300** —
and as expected, **price tapped into 3296**, which aligned with both the **H1 Order Block** and **Golden Fibonacci zone** 🎯📉
---
📈 **Current Setup in Progress:**
We're now watching for a **bullish H1 candle close above 3353** 🔼
Once confirmed, we’ll execute a **layered buy strategy**:
🔹 **50% entry at activation** (above 3353)
🔹 **30% on retracement** (if price dips 50–60 pips below entry)
🔹 **Remaining 20%** if price dips **70+ pips** below entry zone
---
🛡️ **Stoploss:** 3338–3337 (slightly wide due to structure)
This is why we **scale into the trade** — for **better risk management** and **position control** ✅
🎯 **Minimum Target:** 100–150 pips
🏁 **Extended Target (Optional):** 3396 – for those who can hold with conviction 📊💰
---
🧠 *Follow structure, manage risk, and trust the plan. High probability setups don’t need to be rushed.*

Gold will continue with its bullish breakoutLooking for new highs to be made. Price has pushed bullish as trump started talking about the tariffs early today. Even though they are not supposed to discuss till the 9th. We can get a early move for the week. Monitoring the price action to see if I can get in where I fit in!

XAU / USD 1 Hour ChartHello traders. Here is my hourly chart showing my current area of interest for scalp buys/sells. Watching to see if we reject, form some support and keep moving up after the pullback, or do we keep going lower to take out the current long positions in profit? Patience is key. Big G gets a shout out. Be well and trade the trend. Safe trading.

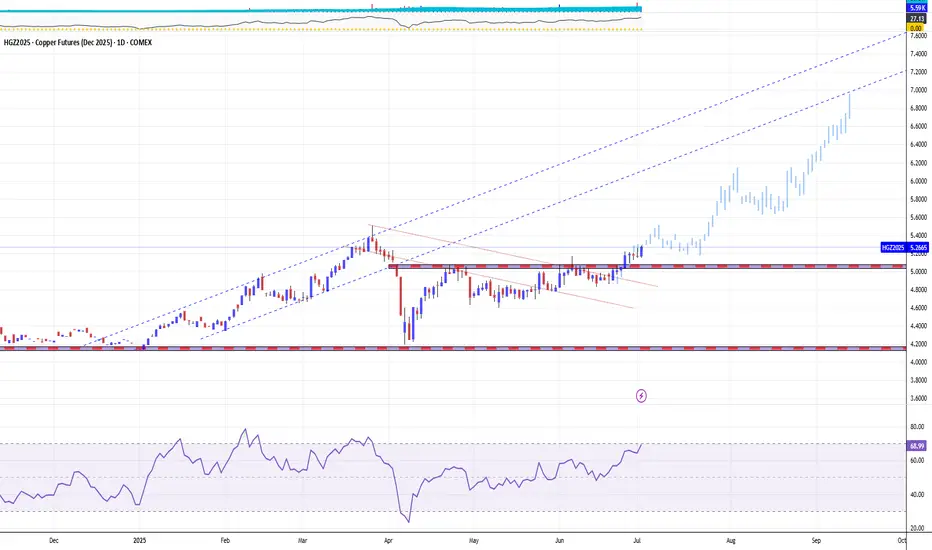
MR. COPPER GOES FUN. WITH DONALD TRUMP — IT IS A BULL RUNCopper prices in 2025 are up about 27 percent year-to-date, driven by a complex interplay of technical and fundamental factors, with geopolitical events such as the Trump administration's tariff policies and the escalation of geopolitical tensions in the Middle East having a significant impact.
Fundamental Outlook:
The main driver of copper prices in 2025 is the ongoing global surge in demand driven by the transition to clean energy. Copper is essential for electric vehicles (EVs), renewable energy infrastructure, and grid upgrades, all of which require extensive use of copper due to its superior electrical conductivity.
For example, EVs use about 2-4 times more copper than traditional vehicles, and renewable installations such as wind turbines contain several tons of copper each. This structural growth in demand underpins the optimistic outlook for copper in the medium to long term.
On the supply side, however, copper production is growing. The International Copper Study Group (ICSG) forecasts a global copper surplus of 289,000 tonnes in 2025, more than double the 2024 surplus. This surplus is driven by rising production, particularly from new or expanded operations in the Democratic Republic of Congo, Mongolia, Russia and elsewhere.
Capacity increases in these regions, coupled with smelter growth, could contribute to a supply glut despite strong demand.
Conversely, geopolitical tensions in the Middle East could disrupt bauxite and alumina supply chains, a region that is a strategically important supplier of raw materials.
Impact of Trump Tariffs:
The Trump administration’s threats and actions to impose tariffs on U.S. copper imports have added volatility and complexity to the market. The tariff announcement triggered a sharp sell-off in early April 2025 as concerns about the impact on US manufactured demand and global trade flows grew. London Metal Exchange (LME) copper prices fell to one-month lows following China’s retaliatory tariffs, before partially recovering after some tariff exemptions and reductions were announced.
The tariffs also distorted physical supply chains. Traders rushed to deliver copper to the US ahead of the tariffs, reducing copper availability in other regions such as China. This arbitrage resulted in a significant widening of the price differential between US CME copper contracts and LME copper prices, with US prices trading at a premium of over 10% to London. This premium reflects the tariff risk embedded in the US copper price and expectations of temporary domestic market tensions.
Technical Outlook:
Technically, copper prices have shown resilience despite the tariff shocks. Copper prices sold off after peaking in late March 2025 before the tariffs were announced, but have since begun to recover.
Long-term trendlines and moving averages remain supportive, with the 100-week and 200-week moving averages trending higher and forming a bullish crossover earlier in the year.
Long-term copper prices are once again attacking the 18-year resistance around $4.50/lb ($10/kg) that capped the upside in 2008 and again in the 2010s and first half of the 2020s, with a 1.5x rally in the next 1 to 3 years.
The technical main chart of the COMEX December 2025 copper futures contract COMEX:HGZ2025
points to the possibility of an upside move, all the way to the $7 mark (around $15/kg) as early as H2 2025.
Conclusion
Going forward, copper prices are expected to remain volatile but supported by long-term structural demand growth, with the impact of tariffs likely to cause episodic disruptions rather than a sustained suppression of increasingly hot prices.
--
Best wishes,
@PandorraResearch Team😎
NQ Range (07-02-25)NAZ will have to get some help with a Tweet or two in order to get above KL 22,881. This Post will have Monday close as end point. Look for the long weekend to use the Pop Trick into Monday and if not, we have a decent short developing. BTD/FOMO Forever, you don't even need much volume or fundamental/technical reasons.

Where’s the Oil Price Heading Amid Rising Supply and Weak DemandThe eight oil-producing nations of OPEC+ agreed to raise output in August, opting for a larger-than-expected increase. OPEC+ cited a steady global economic outlook and healthy market fundamentals. The crude oil market remains under pressure from subdued prices, persistent supply growth, and uncertain demand prospects.
WTI SOARED ON CONFLICT, SANK JUST AS FAST ON CEASEFIRE
June saw heightened volatility in WTI crude prices, driven by a short-lived conflict between Israel and Iran. Prices surged from USD 68/b on 12/Jun (one day before Israel struck Iran) to a five-month high of USD 78.40/b on 23/Jun, following the U.S. strike on three Iranian nuclear facilities.
Fears of a potential closure of the Strait of Hormuz, a critical chokepoint for ~20% of global oil flows, amplified the rally.
However, prices swiftly retreated as a ceasefire was announced within 24 hours. The rapid de-escalation erased most of the geopolitical risk premium, pushing crude back toward pre-conflict levels. Implied volatility and skew also dropped.
Source: CME CVOL
While flare-ups like Iran halting cooperation with the U.N. nuclear watchdog on 02/Jul (Wed) briefly lifted WTI prices but a surprise U.S. inventory build quickly capped the gains.
Overall, June’s rally was driven by geopolitical shocks, not sustained fundamentals. Oversupply concerns remain dominant.
OPEC+ ACCELERATES OUTPUT RESTORATION EVEN AS DEMAND WORRIES LOOM
With geopolitical tensions easing, market attention has shifted back to supply-demand fundamentals. Global oil demand remains sluggish, heightening concerns of a potential oversupply, especially as OPEC+ continues to unwind its production cuts.
On 05/Jul (Sat), eight key members of the OPEC+ alliance—Saudi Arabia, Russia, the UAE, Iraq, Kuwait, Kazakhstan, Algeria, and Oman met virtually and agreed to raise oil output in August. Instead of the anticipated 411,000 bpd increase, the group opted for a steeper hike of 548,000 bpd.
OPEC+ has been curbing output since 2022 to support prices. However, the alliance began reversing course this year to regain market share, amid rising competition from non-OPEC producers and pressure from Washington to help ease fuel prices.
This group began unwinding the voluntary cut of 2.2 million bpd in April. The original plan was to gradually increase production by 137,000 bpd each month through September 2026. Yet, after only one month at that pace, the group accelerated the process, tripling the monthly hike to 411,000 bpd for May, June, and July.
As of August, OPEC+ will have restored 1.92 million bpd of the 2.2 million bpd initially cut, leaving just 280,000 bpd to be brought back.
Following years of output cuts to stabilize prices, OPEC+ is now focused on expanding its market share as global supply competition intensifies.
DEMAND SIGNALS FLASH UNSEASONAL SUMMER WEAKNESS
Recent data paints a bearish demand picture. U.S. crude inventories unexpectedly rose by 3.8 million barrels in the week ending 27/Jun, defying forecasts of a 3.5 million-barrel draw.
A build during peak summer signals weak consumption. Gasoline demand fell to 8.6 million bpd, while stockpiles surged by 4.2 million barrels exceeding expectations of a 0.7 million barrel build.
Source: EIA and Investing.com
Adding to concerns, the U.S. labour market showed signs of strain, with private payrolls unexpectedly dropping by 33,000 in June, according to the ADP report . Analysts had expected private payrolls to rise by 99,000. The soft employment data suggests broader economic weakness that could further dampen fuel use.
China offered a rare positive note, with its Caixin Manufacturing PMI returning to expansion (above 50) in June on stronger orders and output. However, the rebound is unlikely to meaningfully shift the global demand narrative.
WTI TECHNICALS SIGNAL SUSTAINED BEARISH MOMENTUM
As prices retreated from five-month highs post-ceasefire, technical signals turned bearish, a death cross formed on 02/Jul as the 21-day DMA crossed the 9-day DMA, reinforcing downside momentum.
Meanwhile, uncertainty over potential U.S. tariffs after the 09/Jul (Wed) deadline continues to cloud trade and demand outlooks.
Prices slipped below the 150-day SMA on 24/Jun and have held beneath it since, reinforcing the bearish trend.
A bearish MACD and fading RSI underscore continued weakness in WTI prices.
HYPOTHETICAL TRADE SETUP
While the medium-term outlook for WTI remains bearish, the coming week could see heightened volatility driven by two key factors: OPEC+’s larger-than-expected production increase and the U.S. tariff decision due on 09/Jul (Wed).
Although the accelerated OPEC+ supply hikes are priced in, downward pressure on prices is likely to persist. Meanwhile, the U.S. tariff decision adds a layer of uncertainty; any escalation or renewal of tariffs could weigh further on oil prices, while a rollback might offer temporary support.
Aside from another geopolitical shock, upside risks remain limited. In this context, a long straddle is a prudent strategy to capture potential sharp price swings in either direction.
Source: CME QuikStrike
This paper proposes a long straddle strategy using the Monday weekly WTI crude oil options expiring on 14/Jul (ML2N5), designed to benefit from heightened volatility regardless of price direction.
The position involves purchasing a USD 66.50/b call and a USD 66.50/b put, resulting in breakeven levels at USD 63.58/b and USD 69.42/b. The total cost of the trade is a net premium of USD 2.92/b, or USD 2,920 per contract.
The strategy offers unlimited upside potential if prices move beyond the breakeven levels, while the maximum loss is limited to the premium paid.
The accompanying chart, generated via CME Group’s QuikStrike Strategy Simulator , provides a detailed visualization of the strategy’s performance under various market scenarios.
MARKET DATA
CME Real-time Market Data helps identify trading set-ups and express market views better. If you have futures in your trading portfolio, you can check out on CME Group data plans available that suit your trading needs tradingview.com/cme .
DISCLAIMER
This case study is for educational purposes only and does not constitute investment recommendations or advice. Nor are they used to promote any specific products, or services.
Trading or investment ideas cited here are for illustration only, as an integral part of a case study to demonstrate the fundamental concepts in risk management or trading under the market scenarios being discussed. Please read the FULL DISCLAIMER the link to which is provided in our profile description.

GOLD UPDATE – Market Consolidating Below Key LevelXAUUSD GOLD UPDATE – Market Consolidating Below Key Level
Gold prices are currently consolidating just below the critical range. This behavior suggests a potential downside move toward the 3300 / 3295 support levels if the price fails to hold above nearby resistance.
🔹 Technical Outlook:
If the market manages to consolidate above 3340, we can anticipate bullish momentum to potentially targeting 3365 and 3400
However, a weak reaction around 3295 could lead to another retest of the 3275 zone, but likely within a selling pressure environment.
You may see more details in the chart Ps Support with like and comments for better analysis.

XAU/USD) support level back bullish trend Read The captionSMC trading point update
Technical analysis of Gold (XAU/USD) on the 3-hour timeframe, suggesting a long trade idea with a clearly defined support zone and target projection. Here's the detailed breakdown:
---
Chart Breakdown (3H - XAU/USD)
1. Support Zone (Yellow Box):
Price reacted strongly to the 3,244–3,300 area, which is identified as a key support level.
This area has historically seen demand and is now acting as a base for potential bullish continuation.
2. Falling Wedge Breakout:
A falling wedge pattern has been broken to the upside, which is typically a bullish reversal signal.
The breakout indicates a shift from the previous bearish momentum into bullish strength.
3. EMA 200 Confirmation:
Price is now above the 200 EMA (3,333.347), supporting a bullish bias.
This can act as dynamic support going forward.
4. RSI Momentum:
RSI at 62.00, indicating growing bullish momentum without being overbought.
The RSI has also broken above a previous local high, confirming strength.
5. Target Projection:
The projected move (blue arrowed box) suggests a potential rally of +105.305 points (3.20%), targeting the 3,394.503 level.
This level aligns with previous price structure and acts as the next major resistance.
6. Anticipated Price Path (Black Zigzag Line):
Price is expected to pull back slightly, retesting the wedge breakout or support zone.
After this retest, a bullish continuation toward the target point is projected.
Mr SMC Trading point
---
Summary:
Bias: Bullish
Pattern: Falling wedge breakout + support retest
Entry Zone: Around 3,300–3,320 on a retest
Target: 3,394.503
Invalidation: Strong break and close below 3,244.166
Confirmation: Bullish price action near support + sustained RSI strength
Please support boost 🚀 this analysis)

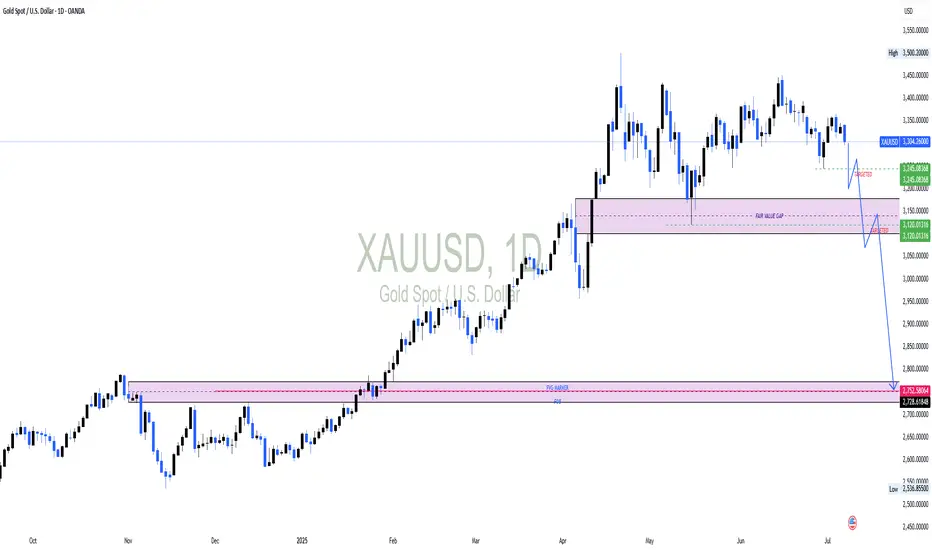
Could Gold slide below 3000?Could Gold slide below 3000?
On the monthly charts, price action shows an imbalance when Gold surged to 3500. Equilibrium must be restored and price action suggests, Gold has to correct by mitigating demand at 2700 price levels. On the weekly and daily charts, there are signs of price weakening suggesting a reversal is not so far. On the daily chart, Gold has mitigated a short term FVG and formed an intermediate low. Once this low is broken, it will confirm our reversal of Gold targeting the monthly FVG at 2760
Psychology 2025 7/7/7In this video I break down my psychology around trading we all in this game for the same reason but you must understand yourself first before you understand the market..... blessed week everyone have a successfully trading week


XAUUSD is getting ready to explode to $4000Gold (XAUUSD) is trading around its 1D MA50 (blue trend-line) having practically been accumulating since the April 22 High. Ever since the 1D MA100 (green trend-line) turned into a long-term Support (2023), Gold has experienced similar Accumulation Phases another 3 times.
On all of those occasions, the price broke out to the upside in the form of a Channel Up, reaching at least the 2.5 Fibonacci extension.
With the 1D MACD close to forming a Bullish Cross around the 0.0 mark, which is the level that always started the Channel Up during those 3 previous Accumulation Phases, we expect the market to start breaking upwards and towards the end of the year hit at least $4000.
-------------------------------------------------------------------------------
** Please LIKE 👍, FOLLOW ✅, SHARE 🙌 and COMMENT ✍ if you enjoy this idea! Also share your ideas and charts in the comments section below! This is best way to keep it relevant, support us, keep the content here free and allow the idea to reach as many people as possible. **
-------------------------------------------------------------------------------
💸💸💸💸💸💸
👇 👇 👇 👇 👇 👇

GOLD GOLD ,London session is giving a 30min buy signal from London gold market in 3309-3304 zone .
if they hold that zone it will be 3321 -3325 target.
and i see sell from that zone which will sweep into the descending trendline and activate a lower level buy at 3288-3295 zone .
trading is logical probability's ,pls stay cautious at all time. Any key level can fail because you dont have the money to move market.

H1 pullback in bullish H4 marketThe market is at a point where we must sell, it's at a maximum of Elliott Waves, wave 5 is already extremely extended, so prepare for a mega drop of several weeks while everyone continues to buy at the lows, it will continue to go down. In summary, we have a bullish market on H4, now there will be a correction on H1, that is, a bearish trend on H1 for several weeks; it is not an ABC, but 5 bearish waves.

CRUDE OIL (WTI): Move Up Ahead!
Last week, I already shared a bullish setup on WTI Crude Oil
on a daily time frame.
I see a strong intraday bullish confirmation today.
After a test of an underlined blue support area,
the price went up strongly and violated a resistance line
of a bullish flag pattern on a 4H time frame.
The market is going to rise more.
Goal - 68.2
❤️Please, support my work with like, thank you!❤️
I am part of Trade Nation's Influencer program and receive a monthly fee for using their TradingView charts in my analysis.

XAU/USD – 45-Minute Chart Breakdown **Date:** July 7, 2025 # 📊 XAU/USD – 45-Minute Chart Breakdown
**Date:** July 7, 2025
**Current Price:** $3,326.97
**Bias:** 📈 Bullish Breakout
---
## 🔹 Key Market Structure:
- **Trendline Breakout**: ✅
Price broke cleanly out of the descending trendline that had held since the $3,362 high.
- **LL → HL Shift**:
The structure is transitioning from Lower Lows to potential Higher Lows (HL) – a strong sign of **reversal**.
- **BOS Zone** (Break of Structure):
BOS has been confirmed; further upside is now **probable**.
---
## 🔸 Trade Zone:
| Type | Level | Description |
|------------|------------|--------------------------|
| **Entry** | ~$3,326 | Breakout confirmation 🔓 |
| **SL** | ~$3,319 | Below recent HL 🛡️ |
| **TP1** | $3,362 | Top of previous range 🎯 |
| **TP2** | $3,385+ | Momentum extension 📈 |
---
## 📌 Indicators & Labels:
- **Structure:** `Bullish` 🟢
- **Efficiency:** `Efficient` ✅
- **MSU:** Bearish (short-term countertrend, being invalidated)
- **VTA:** Active ⚡️
---
## 🧠 Strategy Note:
This breakout is occurring **after a full liquidity sweep** and a **strong bullish reaction** off the $3,290s. Volume is supporting the move and **confluence** builds toward continuation.
> 💬 *"The best trades come when structure, liquidity, and timing converge."* – Let's ride this wave with confidence.
---
### 👑 For Persian Princes of the Market 🇮🇷
We don’t guess. We **track, adapt, and lead**.
---
## 🟢 Potential Breakout from the Descending Channel
As observed in the **45-minute timeframe**, Gold (XAU/USD) has been respecting a classic **descending channel** formed by a sequence of Lower Highs (LH) and Lower Lows (LL), leading to an overall bearish structure.
However, in the latest candles, price has **broken above the upper boundary of the channel**, signaling a potential shift in market structure.
---
### 🔍 Technical Highlights:
- ✅ **Breakout above the channel** = First sign of bullish reversal
- ✅ **Formation of Higher Low (HL)** after a strong rally = Added confirmation
- ✅ **Efficient bullish move** with momentum pushing toward previous Highs
---
### 🎯 Forecast Scenario:
If price holds above the breakout zone (around **$3,327**), we can expect a bullish continuation toward:
- 🥇 **Target 1:** $3,362
- 🥈 **Target 2:** $3,385+
A **successful retest** of the broken channel would serve as a powerful confirmation for this setup.
---
> ⛳️ *This move reflects not just a breakout — but a disciplined journey through structure, liquidity, and price behavior. Pure technical elegance.*
> — *Mohsen Mozafari Nejad*
---
📈 **Structure:** Bullish
⚡️ **Momentum:** Efficient
🕰 **Timeframe:** 45 Min
💰 **Current Price:** ~$3,327

SILVER: Will Go Up! Long!
My dear friends,
Today we will analyse SILVER together☺️
The in-trend continuation seems likely as the current long-term trend appears to be strong, and price is holding above a key level of 36.696 So a bullish continuation seems plausible, targeting the next high. We should enter on confirmation, and place a stop-loss beyond the recent swing level.
❤️Sending you lots of Love and Hugs❤️

Weekly Market Outlook: E-mini Nasdaq 100 Futures NQCME_MINI:NQ1!
It’s a quiet week for US economic news. However, the RBA and RBNZ are scheduled to announce interest rate decisions.
As has been the theme this year, markets remain highly sensitive to headline news and associated risks.
US President Trump signed the One Big Beautiful Bill Act into law at the White House.
Treasury Secretary Bessent is currently giving an interview on CNBC as we write this outlook. Explanation of the near-term impact of Trump’s BBB Act, tariffs, and trade deals will be key to monitor, as this may be fuel for further movement. The US is set to announce more trade deals in the next 48 hours, while trading partners who did not reach a deal will revert to April 2nd tariff levels, with the tariffs to take effect on August 1st.
As many as 100 smaller countries will get a set tariff rate.
How does this all translate into price action and expectations for the market?
NQ and ES are currently trading near all-time highs. RTY has potential upside as it plays catch-up. With the BBB Act signed into law, many of the investment banks anticipate a near-term positive impact on GDP.
In NQ, we are looking at the following scenarios:
Key LIS zone: 22860.50 – 22825.50
Support Zone: 22600 – 22582.25
Key Support Zone: 22000 – 22050
Scenario 1: Hold above key LIS
In this scenario, we expect new ATHs and continuing price discovery higher.
Scenario 2: Hold below key LIS
In this scenario, we expect the price to re-test the support zone at 22600 – 22582.25 and consolidate to build value higher. A break below support may lead to further short opportunities to retest the 22000 level.

Tuesday Outlook on Gold (XAU/USD)
After Monday’s move into the 4H Fair Value Gap and rejection near the trendline and Asia High, I’m expecting a corrective move to start Tuesday.
I’m currently watching two possible downside targets:
🔸 Scenario 1: A short-term drop into the upper part of the 4H FVG (around 3320–3310) – this zone could act as intraday demand and cause a quick bounce.
🔸 Scenario 2: A deeper retracement toward the unfilled imbalance around 3290–3280, lining up with the London Low and completing the 4H FVG.
This would be a more significant liquidity sweep before a potential bullish reaction.
From both zones, I’ll be looking for price action to confirm a possible long setup back toward the trendline and above.
Let’s see how Tuesday plays out.

US tariff deadline, GOLD expected to fluctuate very stronglyInvestors will be keeping an eye on tariff news from Washington this week as the temporary suspension of punitive import duties is set to expire. If trade tensions do not escalate further after Wednesday’s deadline, that could be good for the market, while downside risks are also a negative for OANDA:XAUUSD in particular.
News Around US Tariffs
To avoid higher tariffs, negotiators from more than a dozen major US trading partners are racing against time to negotiate with the Trump administration, trying to reach a deal before July 9. Trump and his team have continued to apply pressure in recent days.
Trump announced a deal with Vietnam to lower the 20% tariffs he had promised on many Vietnamese exports, while talks with Japan, the United States’ most important ally in Asia and sixth-largest trading partner, appeared to be stalled, even as Washington hinted it was close to a deal with India.
In data
Nonfarm payrolls data released Thursday showed the U.S. added 147,000 jobs in June, beating market expectations, and the unemployment rate fell to 4.1%.
Despite the slowdown in private-sector hiring, the overall strong report prompted markets to lower expectations for a Federal Reserve rate cut in July.
According to the CME FedWatch Tool, the probability of a rate cut has dropped sharply from 24% to 4.7%. Fed Chairman Powell reiterated that the central bank will not ease its stance until there are more signs of cooling in employment and inflation.
Personal Comments
The market is following a number of factors:
On the one hand, there is a countdown to Trump's "final blow" on tariffs, and on the other hand, the non-farm data has poured cold water once again. As the Fed's stance fluctuates, the US Dollar faces a tug-of-war between long and short positions, while gold continues to stabilize technically or has had significant price increases. July 9 of this month could be a key moment to really test the sustainability of gold in this recovery.
Technical Outlook Analysis OANDA:XAUUSD
Gold has recovered significantly over the past week, since finding support from the $3,250 area, but the temporary recovery is still limited by the EMA21 followed by the 0.236% Fibonacci retracement level.
However, sustained price action above the $3,300 raw price point should be viewed as a positive signal as it helps gold stabilize within the price channel.
If gold rises and breaks above the 0.236% Fibonacci retracement level, it will be eligible to continue rising with a short-term target of around $3,400 rather than a horizontal resistance of $3,430.
The indecision sentiment is shown by the RSI activity, which is mostly moving around the 50 level. RSI above 50 is considered a positive signal, while RSI below 50 is considered a negative signal, but gold is currently in the middle of this point.
Overall, gold has not yet had a short-term trend, but in the long-term, gold prices are still in an upward trend, which is noted by the price channel.
Finally, the notable positions will be listed as follows.
Support: 3,300 – 3,292 – 3,250USD
Resistance: 3,350 – 3,371 – 3,400USD
SELL XAUUSD PRICE 3334 - 3332⚡️
↠↠ Stop Loss 3338
→Take Profit 1 3326
↨
→Take Profit 2 3320
BUY XAUUSD PRICE 3275 - 3277⚡️
↠↠ Stop Loss 3271
→Take Profit 1 3283
↨
→Take Profit 2 3289
