XAUUSDThe current short setup on XAU/USD (Gold vs US Dollar) highlights a potential downside move from the entry zone of 3336–3340, targeting progressive profit levels down to 3313. This trade suggests that gold is encountering resistance in the specified entry area, likely due to previous price rejections, supply pressure, or alignment with a key Fibonacci retracement level or bearish trendline. The stop loss at 3352.00 is positioned above a key resistance zone, offering a buffer of approximately 12–16 points, which helps guard against short-term volatility or false breakouts before price possibly resumes its downward trajectory.
The risk-to-reward ratio on this setup is favorable, potentially offering 2:1 or better depending on entry execution. Moreover, the setup allows for flexibility; traders can trail the stop once TP1 is hit to reduce risk exposure and lock in profit. It's crucial to monitor price action closely at the entry zone—any bullish breakout above 3344–3348 with volume could invalidate the setup, while rejection candles or long upper wicks would confirm bearish strength.
Futures market

False breakout? Gold reverses sharply after news surgeBecause of the news that Trump hinted at firing Powell, gold surged strongly in the short term and passed to 3377, recovering the recent decline in one fell swoop. We went long on gold near 3323 in advance, and went long on gold near 3340 again after gold retreated, hitting TP: 3345 and 3355 respectively. The two long trades successfully made a profit of 370pips, with a profit of more than $18K.
Although gold has risen sharply in the short term and effectively destroyed the downward structure, it is mainly news that drives the market. After Trump denied firing Powell, gold rose fast and fell fast. So we can't chase long gold too much. First, the sustainability of the news-driven market needs to be examined, and second, the certainty of Trump's news is still unreliable. He always denies himself the next day.
After the gold price retreated quickly, a long upper shadow appeared in the candlestick chart, indicating that the upper resistance should not be underestimated. Therefore, we should not rush to buy gold. We can still consider shorting gold in the 3355-3365 area. We should first focus on the area around 3340. If gold falls below this area during the retreat, gold will return to the short trend and test the area around 3320 again, or even fall below this area after multiple tests and continue to the 3310-3300 area.
XAUUSD Trade Setup: Buying Opportunity at 3,322 Support ZoneGold (XAUUSD) is currently testing a critical support zone between 3,322 and 3,323 USD. This area represents a confluence of the previous swing low and the 0.618 Fibonacci retracement level, which is historically known to trigger technical bullish reactions. If a confirming signal appears on the H1 chart, this may offer a favorable short-term buy opportunity.
Trade setup details:
Entry (Buy limit): 3,323 – 3,322 USD
Stop loss: below 3,318 USD
Take profit: 3,331 – 3,340 USD
Risk-to-reward ratio: approximately 2:1
Technical rationale for the trade:
The 3,322 level has acted as a strong support in recent price structure
Aligns with the 0.618 Fibonacci retracement, often seen as the last line of defense in bullish setups
RSI on the lower time frame is nearing oversold, signaling potential bullish momentum
Risk management notes:
If price closes below 3,318 USD, the long idea becomes invalid
Best entries should be supported by price action signals such as pin bar, bullish engulfing, or other reversal candles near support
Conclusion: A buy position in the 3,322 – 3,323 USD zone presents a reasonable strategy as long as the support holds. If bullish reaction occurs, price may revisit the 3,340 resistance area in the short term.
Save this strategy if you find it useful, and stay tuned for more real-time trade ideas and insights.

BuyRejection Level
Daily Volume
Market Structure Shift
London Session
Trend Line Break
Untapped Order Point
XAUUSD Will BIG FLYXauusd buy from 3320
Tp1 3330
Tp2 3340
Tp3 3350
Stope lose 3312
Trade at your own risk

Gold - 1 Hour Analysis (Long)After a series of dump , now we are seeing some bullish pattern. The most recent candle failed to close above 3375 , therefore I am anticipating the price will be targeting the SSL to continue higher.
I am anticipating that the price will move to the 4H OB , and I will be looking for bullish confirmation to enter the trade. Price may not reach to my target after mitigating the 4H OB , therefore manage the trade properly.
How I will take the trade?
If price is respecting the 4H OB , I will be taking multiple trades. For example , 1:2 or 1:3 along the way until it reach to my target. I will not be holding through the whole process.

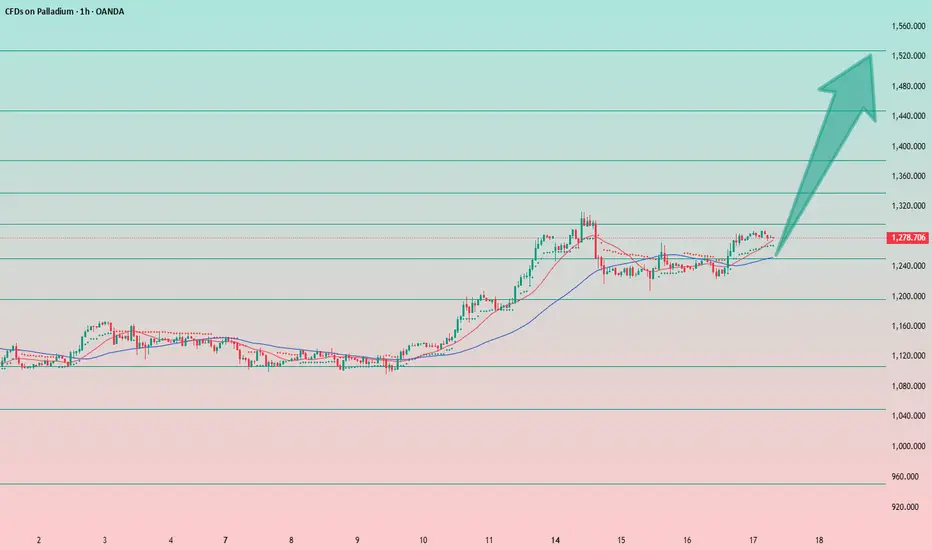
Palladium: Bullish Structure IntactThe long setup remains valid.
The structure on the daily, weekly, and monthly charts is clearly bullish, and I expect the uptrend to continue.
Entering from the current level is tricky, as the stop-loss would need to be placed below the local low — around the 1200 area.
A better approach would be either:
– Wait for a breakout above the local high at 1314 and go long from there, or
– Wait for a pullback at least to the 1250 level.
📝Trading Plan
I already have a position in palladium. I plan to add more at the levels mentioned above.
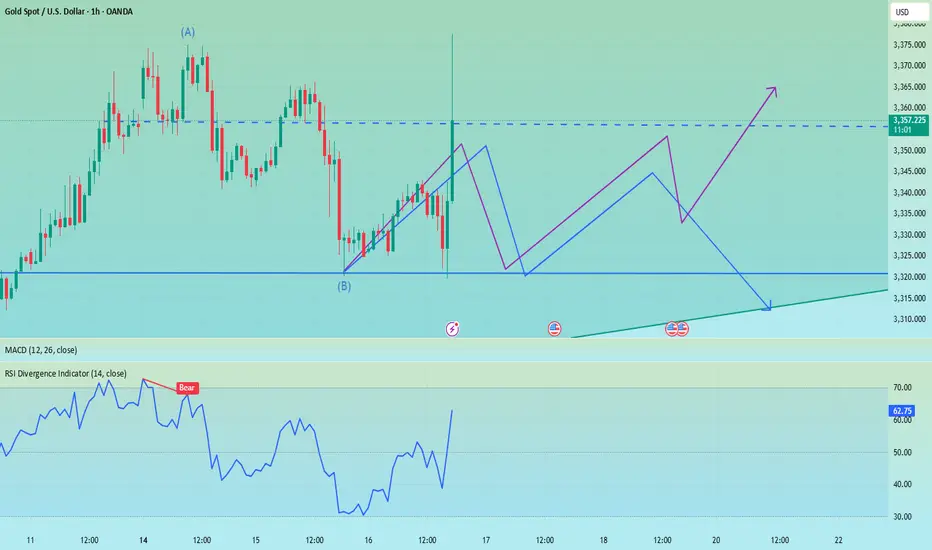
The firing of Powell set off the market, don't chase the longsTrump showed a draft of the letter to fire Powell, but whether Powell will be fired in the end remains to be seen, but the impact on the gold market is undoubtedly huge. The wolves have now smelled a very dangerous scent. Don’t chase high prices. Don’t chase high prices! ! ! After all, the impact of the news comes and goes quickly, and there is a high possibility of a reversal later in the evening. The final suppression position of the current gold daily line is 3340. If the closing line today can maintain above 3340, then gold will usher in a real bullish trend in the future.
OANDA:XAUUSD
Gold
⸻
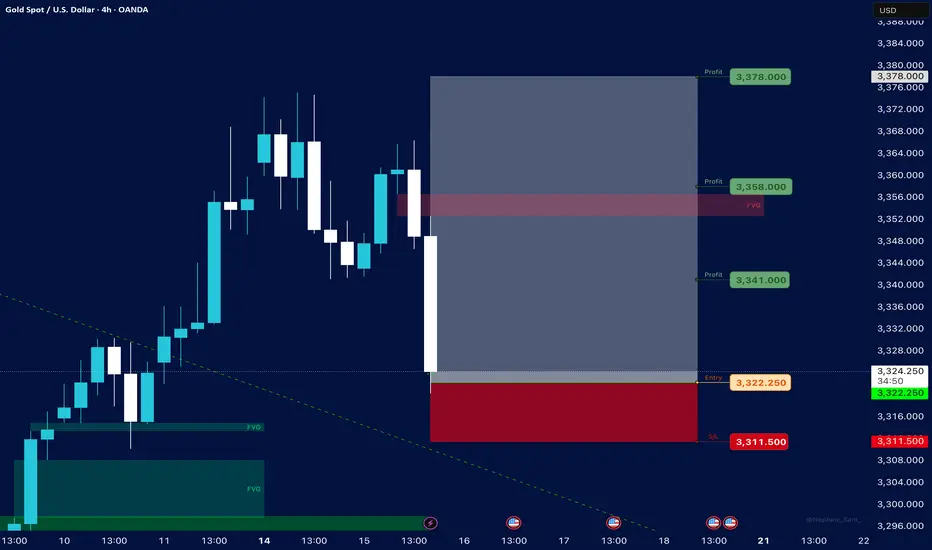
1. Trade Setup Summary
✅ Trade Type: Long (Buy)
✅ Entry: 3,322.250
✅ Stop Loss (SL): 3,311.500
✅ Take Profits (TP):
• TP1: 3,341.000
• TP2: 3,358.000
• TP3: 3,378.000
⸻
2. Chart Context Analysis
🔷 Structure:
• The market had a strong bullish push before a correction phase.
• Current candle is aggressively bullish from the zone near your entry, suggesting buyers are reclaiming control.
🔷 Fair Value Gaps (FVG):
• There is an FVG area marked just above TP2 (around 3,358.000) indicating a price imbalance likely to be filled.
• Previous unfilled FVGs below acted as strong demand zones, supporting bullish continuation.
🔷 Trendline Observation:
• A dotted descending trendline was broken and price consolidated above it, suggesting a shift in market structure from bearish to bullish on lower timeframes.
⸻
3. Risk Management
• SL Placement: Below recent structural lows at 3,311.500, providing safety against liquidity sweeps while avoiding premature stop-outs.
• RR Ratio: Approximately 1:2 to 1:5 if all TPs are hit, making the setup favorable.
⸻
4. Overall Probability and Caution
✔️ Strengths:
• Confluence with FVG targeting.
• Strong bullish engulfing candle.
• Multi-TP strategy for secured partial profits.
⚠️ Risks:
• Potential rejection near TP2 due to previous supply reaction.
• High volatility can cause stop-out if market seeks liquidity deeper before continuation.
⸻
5. Conclusion
This setup aligns with smart money concept-based trades focusing on:
• Market structure shift
• FVG imbalance fills
• Clear SL protection with sequential TP levels
If you want, I can:
• Break this down into a daily plan for tomorrow’s session.
• Integrate it with your NAS100, US30, and Forex analysis for the week.
• Prepare similar structured breakdowns for your upcoming charts in your strategy refinement routine tonight.
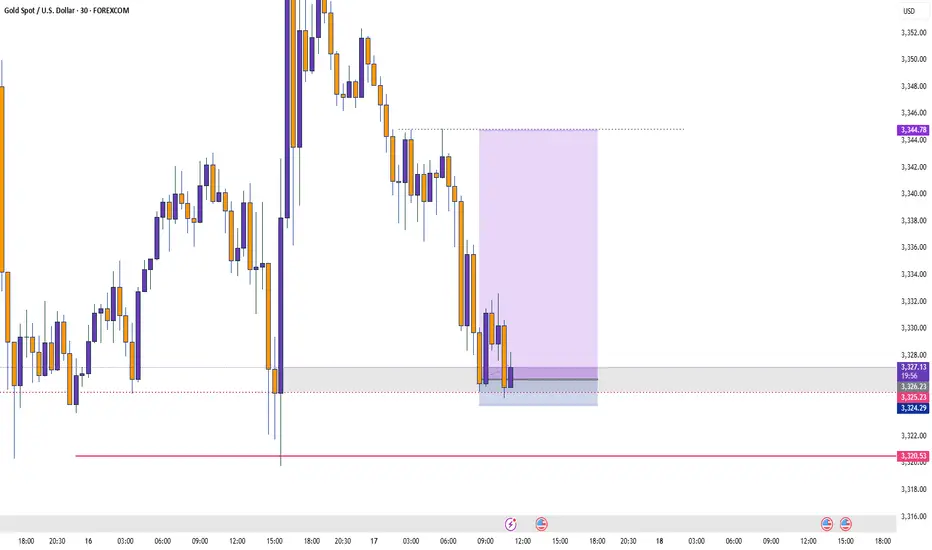
Gold Slips in London – $3,296 Incoming?📉 XAUUSD 1H Bearish Analysis – July 17, 2025
Gold (XAUUSD) is showing clear signs of bearish momentum on the 1-hour chart. After forming a local high around the $3,346–$3,347 region, price was sharply rejected and has since maintained a lower high structure. This rejection came right after the London session began, confirming that institutional volume is likely favoring the downside for now.
The previous few sessions show multiple failed attempts to break above the $3,346–$3,365 range. Sellers are consistently stepping in near those zones, marking a strong supply area. Meanwhile, recent candles have broken below the intraday support around $3,327.74, showing bearish continuation is underway.
Session activity is also in favor of the bears. The current London session opened weak, following a failure to hold above the previous session highs. Typically, gold experiences volatility during London and New York overlaps, and given the current structure, the pressure seems tilted to the downside.
From a broader perspective, the lower highs and lower lows on the 1-hour chart confirm a short-term downtrend. Price is now hovering just above $3,319 support—if this level is taken out cleanly with volume, it opens the path to deeper targets.
________________________________________
📌 Trading Setup (Short Bias)
• Entry: $3,327.74 (breakdown zone)
• Stop-loss: $3,346.29 (above last supply rejection)
• Take-Profit 1: $3,319.69
• Take-Profit 2: $3,311.62
• Take-Profit 3: $3,296.28
• Take-Profit 4 (extended): $3,282.66
________________________________________
If price manages to hold below $3,328 with consecutive rejections on any pullback, this bearish thesis remains valid. A breakdown below $3,311 would likely trigger momentum-driven selling toward $3,296 and potentially $3,282. However, any 1H close back above $3,346 would invalidate the current setup and favor a temporary bullish retracement.

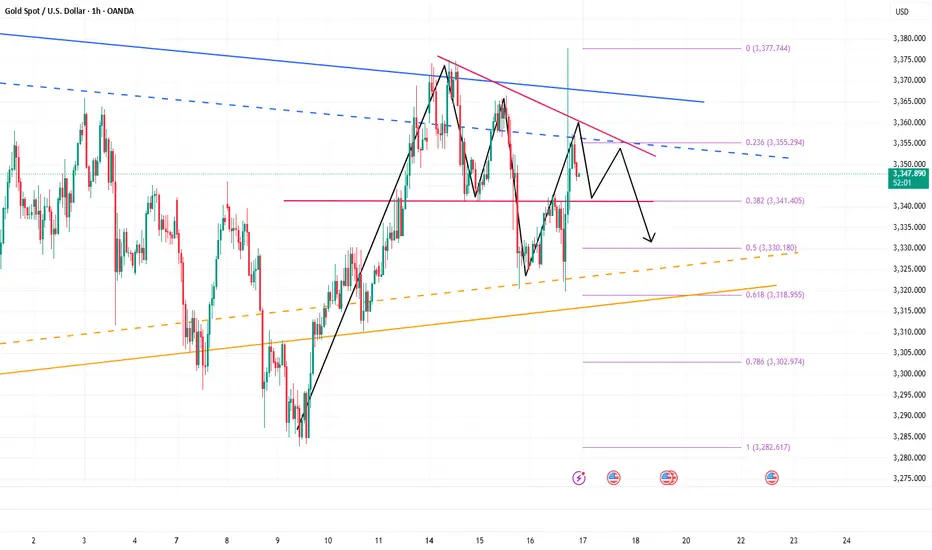
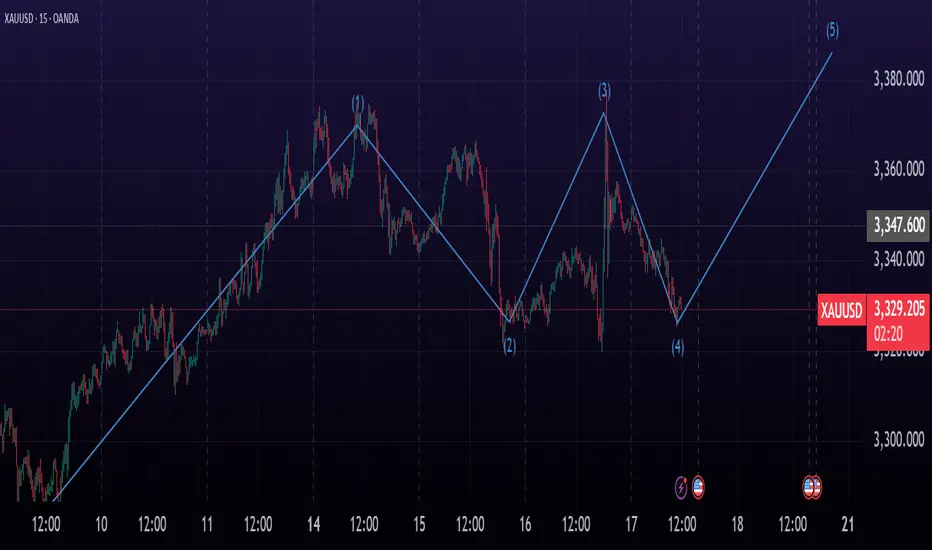
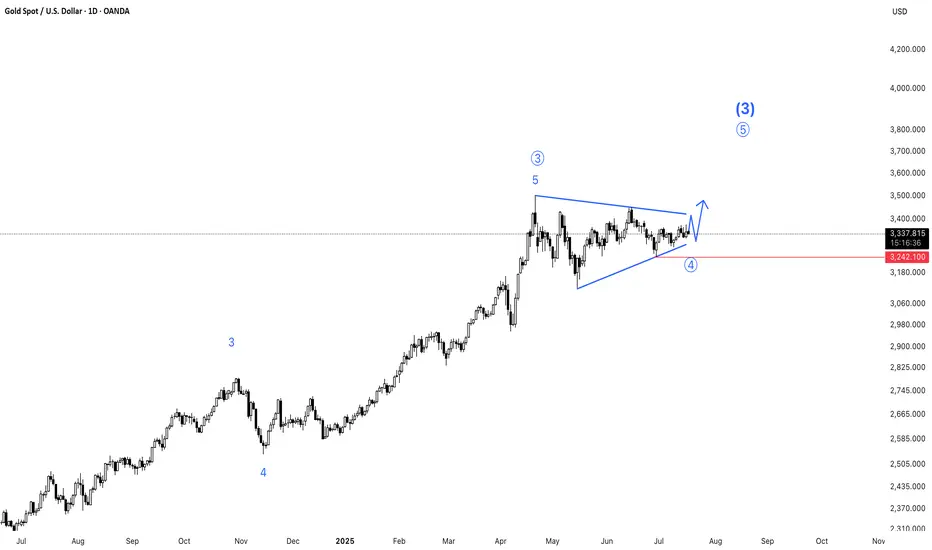
Gold (XAU/USD) - Elliott Wave Suggests Wave 5 Upside Starting!📊 Current Wave Count:
Wave 1 (Complete): Rally from to .
Wave 2 (Corrective): Pullback to (held 50%/61.8% Fib).
Wave 3 (Extended): Strong impulse to .
Wave 4 (Corrective): ABC pattern ending near (e.g., 38.2% Fib of Wave 3).
🎯 Wave 5 Projection:
Target: Typical 0.618–1.0 extension of Wave 1-3 → $ .
Invalidation: Break below Wave 4 low ($ ).
📈 Why Now?
Wave 4 completed as a shallow correction (flat/triangle).
MACD/RSI shows bullish divergence on lower timeframes.
Fundamental drivers (e.g., Fed dovishness, inflation) align.
⚡ Trading Plan:
Entry: Near current pullback (~$ ).
Stop Loss: Below Wave 4 low.
Take Profit: Scale out at 0.618 and 1.0 extensions.

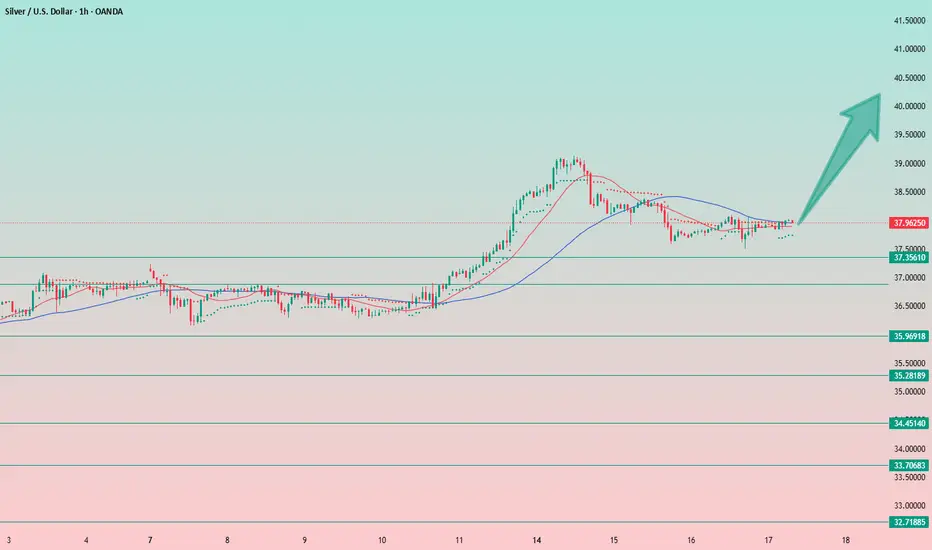
Silver: Bullish Setup from Accumulation ZoneSilver touched its support level at $37.50 and quickly bounced back into the accumulation zone.
From the current levels, I expect an upward breakout. The setup looks very bullish.
I'm going long from the current price of $38. Stop-loss is placed just below the local low at $37.50. A break below $37.50 would signal further downside toward the next strong support around $36.75–$37, where I’d reassess the long opportunity. But honestly, I see this scenario as unlikely.
Targets are all the round numbers: $40, $41, and so on (classic—markets are psychological, and people tend to focus on clean, round numbers). Additional targets include $43.50 and $48.25, which align with levels from 2011–2012.
And look at how harmonious the chart looks.
Volatility is decreasing, the entire structure is stretching out on the hourly timeframe.
We're seeing accumulation followed by an expected breakout, and based on all external factors, an upward move seems likely.
📝Trading Plan
Entry: Entry at current prices and in the 37.75–38.25 range — the long position remains valid.
In fact, the long setup remains valid even at slightly higher levels (but not below), although the stop-loss starts to widen and exceeds 2%. If you're okay with that, then it's still a viable long opportunity.
Stop Loss: Below yesterday's low at $37.50
Target: The first target is $40, and the global target is $ 48.25.
However, it's unlikely we'll reach that level in one move — there will likely be re-entries along the way.
FOR KHANsome leves we will wait to tap and we will go for long and in some zones we wait for pull back to make a short postion
Post CPI analysisHello traders here is my post CPI analysis. Thankyou very much, I shall update from time to time in the notes.

Gold Market Analysis (XAU/USD) – MMC Analysis + Liquidity Target🧠 Market Context Overview:
Gold recently experienced a highly impulsive move from a major demand zone, suggesting strong smart money activity. The market is currently in the redistribution phase of the MMC (Market Maker Cycle), transitioning between a reversal impulse and a liquidity targeting move.
Let’s dissect the key zones, structure, and confluences that support the ongoing market narrative.
📍 1. Strong Demand Reaction (3X Demand Spike):
We start with a triple-tap demand rejection, where the price sharply reversed to the upside. This kind of movement typically represents:
Institutional Entry Points
Stop-Hunt Below Previous Lows
Liquidity Grab Before Expansion
This strong bullish engulfing candle signifies position building by smart money, often the beginning of a significant leg up.
🧱 2. Reversal Zone & Liquidity Imbalance:
The highlighted green zone between $3,370–$3,375 is crucial. Why?
It’s an inefficiency zone where price moved too fast with low resistance.
This created a liquidity void that typically needs to be revisited (also known as FVG – Fair Value Gap).
The area also coincides with structural resistance, making it a high-probability target for price to revisit and reject again or break through with intent.
📌 Smart money always returns to areas of unfilled liquidity to close their positions or trap late retail entries.
🔺 3. Volume Contraction (Wedge Pattern Formation):
After the explosive push upward, the market started compressing, forming a descending wedge — a classical volume contraction pattern.
What does this mean?
Volatility is decreasing
Liquidity is building up
Big breakout is expected
It’s like pulling a slingshot — the more it contracts, the stronger the release will be. The direction will depend on which side breaks first.
🔁 4. Previous Structure Flipped (Support turned Resistance):
You’ll notice a key level around $3,353–$3,355 acting as a flipped structure.
This was previously a support zone that got broken.
Now it’s acting as resistance — a classic example of support/resistance flip.
This adds confluence to the idea of a possible rejection or reaction in this area.
🧠 Structure flipping is a smart money trick — break structure, retrace to trap liquidity, and then run the opposite direction.
📊 5. MMC Logic – Market Maker Cycle in Play:
Here’s how the MMC is flowing:
Accumulation (bottom consolidation)
Manipulation (liquidity sweep below demand)
Expansion (aggressive upward move)
Contraction (volume dies, price slows down)
Now we’re waiting for the next manipulation or expansion phase.
The current wedge is the pause before the next move, which could fill liquidity in the reversal zone or go lower to sweep resting sell-side liquidity.
🎯 Trading Scenarios:
✅ Bullish Bias (if breakout happens):
Break and close above the wedge
Retest previous flipped structure successfully
Target: Liquidity zone at $3,370–$3,375
🎯 This move would fill the imbalance and potentially tag sell-side liquidity sitting at the top.
❌ Bearish Bias (if rejection holds):
Failure to break above flipped structure
Breakdown from the wedge
Target: Demand origin around $3,325–$3,315
🧲 A move lower would make sense if liquidity remains uncollected beneath the range.
🧵 Final Thoughts:
Gold is currently in a high-probability setup zone. We have:
✅ Clear demand reaction
✅ Imbalance above
✅ Volume contraction
✅ Flipped structure
✅ Strong MMC confluence
Now it's a waiting game. Let the market show its hand — either a clean breakout with volume or a fakeout/rejection and reversal.
📌 "Trade what you see, not what you think. Let the levels and liquidity guide your decision."

XAU Trade IdeaGold still bullish after yesterday's gingantic move?
Retracement to OTE + OB while sweeping Asian Low targeting yesterday's high and beyond!

Gold Spot / U.S. Dollar (XAU/USD) 4-Hour Chart4-hour chart from OANDA displays the price movement of Gold Spot (XAU/USD) against the U.S. Dollar, showing a current price of $3,329.145 with a decrease of $18.455 (-0.55%). The chart highlights key levels including a sell price of $3,328.920 and a buy price of $3,329.370, with a recent trading range between $3,355.339 and $3,312.393. The data spans from late June to mid-July 2025, with notable price fluctuations and a shaded area indicating a potential trading zone.

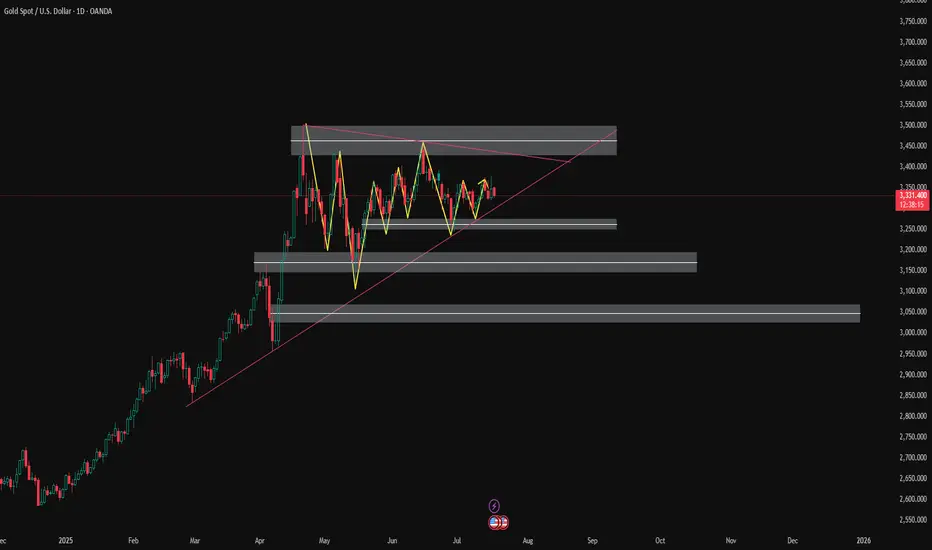
XAU/USD Daily Technical Outlook: Navigating Key Price LevelsThe Dominant Trend Profile
Gold has clearly maintained a robust uptrend on the daily timeframe since April, consistently finding dynamic support along a prominent, upward-sloping trendline. This strong underlying bullish structure has guided price action higher, forming a series of higher lows and highs within this established channel.
Immediate Price Dynamics & Overhead Resistance
The current price action indicates that Gold is encountering significant overhead supply, specifically challenging a critical zone labeled "Current Strong Resistance." This area appears to be a key juncture, where the market is consolidating, and a decisive break above this level would be required to signal a continuation of the rally.
Potential Bullish Continuation
Should buyers successfully overcome the immediate "Current Strong Resistance" zone, the pathway to higher valuations opens up. The next significant hurdle for Gold would be the "Next Resistance" level positioned around 3451.31, with the ultimate long-term target being the prior "All time high" at 3500.10.
Critical Support Zones & Downside Triggers
Conversely, the chart highlights a critical horizontal support line which, if broken to the downside, would serve as a key bearish trigger. Below this immediate support, the "3250 Key Area to focus" represents a substantial demand zone, followed by additional, deeper green-shaded areas that would come into play as important support levels where buying interest might re-emerge should the price decline further.
Disclaimer:
The information provided in this chart is for educational and informational purposes only and should not be considered as investment advice. Trading and investing involve substantial risk and are not suitable for every investor. You should carefully consider your financial situation and consult with a financial advisor before making any investment decisions. The creator of this chart does not guarantee any specific outcome or profit and is not responsible for any losses incurred as a result of using this information. Past performance is not indicative of future results. Use this information at your own risk. This chart has been created for my own improvement in Trading and Investment Analysis. Please do your own analysis before any investments.

GOLD is Sideways – Wave 4 in Progress (Daily Chart)Gold is currently moving sideways, reflecting a period of consolidation that appears to be Wave 4 in the Elliott Wave structure on the daily timeframe. This phase often represents a pause before the next impulsive move. Traders should stay patient and watch for clear breakout signals, as Wave 5 could bring strong momentum once the correction completes.
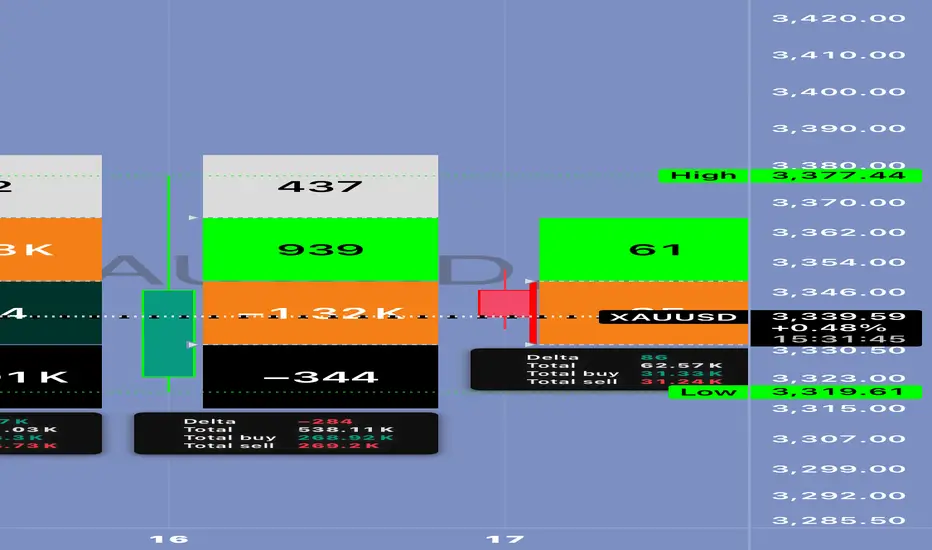
Is Gold Preparing for a Breakout — or a Trap? 🟡 Is Gold Preparing for a Breakout — or a Trap? Let’s break down the latest market data 👇
⸻
🟥 1. U.S. Inflation News (PPI & Core PPI)
Report Previous Forecast Actual
Monthly PPI 0.1% 0.2% 0.0%
Core PPI 0.1% 0.2% 0.0%
📉 Result: Very bearish for the U.S. dollar
→ Inflation is cooling
→ Fed may pause rate hikes
→ Interest rates could stabilize or drop
→ And gold loves that kind of setup 😍
⸻
🟫 2. U.S. Crude Oil Inventory Report
Report Previous Forecast Actual
Crude Oil Inventories +7.07M –1.80M –3.85M
🟢 Result: Very bullish for oil
→ Energy demand is higher than expected
→ Inflation could creep back up due to rising oil prices
→ That makes investors run to gold as a hedge against inflation 🔥
⸻
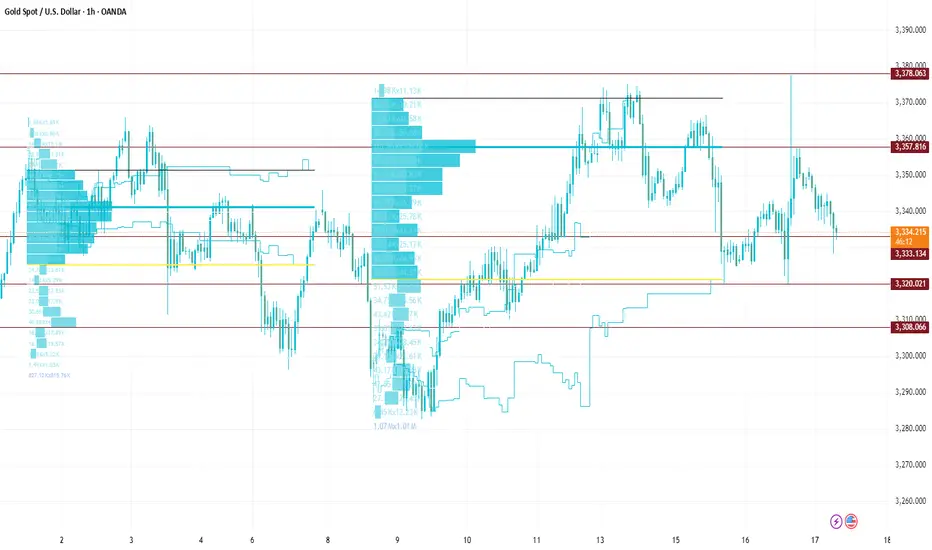
🧠 Technical & Market Outlook for XAU/USD:
📈 Gold pushed from $3,319 to $3,377
↩️ Now it’s in a pullback, testing Fibonacci levels:
• 38% retracement near $3,350
• 61% retracement near $3,339
📉 But… these pullbacks are happening with positive delta and absorption → which signals smart buying from below 👀
✅ Additional signs:
• VWAP is stable
• Volume is holding around the POC
• And macro data is clearly supporting upside momentum
⸻
🎯 Trading Plan:
• ✅ Entry Zones: $3,350 or $3,339
• 🛑 Stop Loss: Below $3,319 (recent low)
• 🎯 TP1: $3,377
• 🎯 TP2: $3,392 – $3,400
• ⚠️ Watch for a breakout above $3,377 with strong volume — that would confirm the real move.
⸻
🔄 Summary:
💥 Two major news events today are supporting gold:
1. Weak PPI = possible pause in rate hikes
2. Rising oil = renewed inflation risk
So gold is getting support from both angles.
But stay cautious — any surprise statement from the Fed or a sudden USD rally could change the game
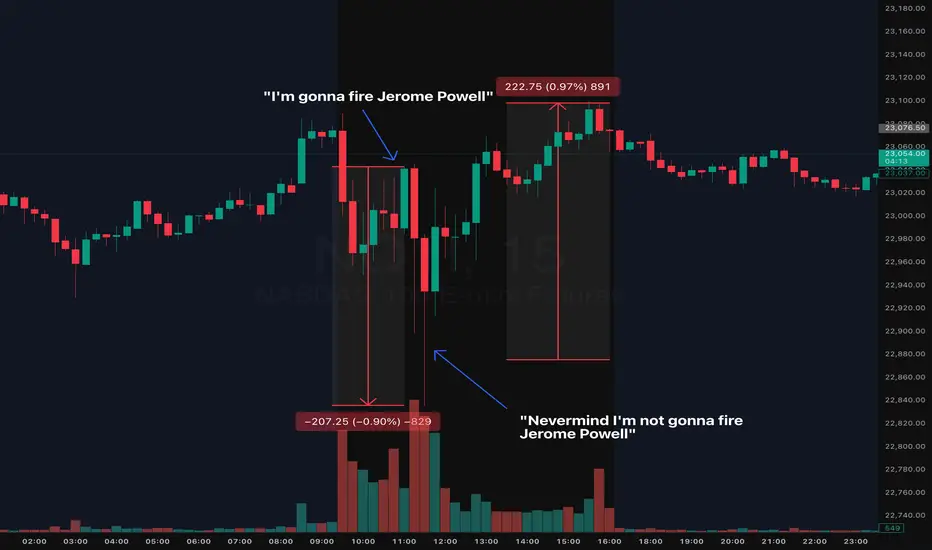
2025 Trading Final Boss: Daily Market Manipulation, The New NormMarking this point in history because we'll likely forget and move on.
During the early hours of the July 16th NYC session, we saw indices quickly flush ( CME_MINI:NQ1! CME_MINI:ES1! ) nearly 1% on the news that Trump will fire Jerome Powell. The dip was bought almost instantly.
Shortly after the dip was bought (roughly 0.50% recovery), guess what? Trump announced, he is "not considering firing Jerome Powell". The dip then recovered and achieved a complete V to finish the day somewhat green. Make what you want of it but always use a stop loss in these tough conditions.
Welcome to 2025 Trading Final Boss