DIYWallSt Trade Journal:$238 Lessons From Monthly Expiration07/18/25 Trade Journal, and ES_F Stock Market analysis
EOD accountability report: +238.75
Sleep: 5. hours
Overall health: Was working late last night and didn't get much sleep.
VX Algo System Signals from (9:30am to 2pm)
— 8:30 AM Market Structure flipped bullish on VX Algo X3!
— 10:30 AM Market Structure flipped bearish on VX Algo X3!
— 11:10 AM VXAlgo ES X1 Buy signal (didn't work that well)
— 12:10 PM VXAlgo NQ X1DD Sell Signal
— 12:19 PM Market Structure flipped bullish on VX Algo X3!
What’s are some news or takeaway from today? and What major news or event impacted the market today?
Today was monthly expiration for options and we got a lot of X7 Sell signals but structure was bullish so I tried to take a long at MOB and got burned. Flipped bearish and started shorting the rest of the day and ended up making money back.
News
*US STOCKS MOVE LOWER AFTER REPORT SAYS TRUMP PUSHES FOR 15-20% MINIMUM TARIFF ON ALL EU GOODS
What are the critical support levels to watch?
--> Above 6335= Bullish, Under 6315= Bearish
Video Recaps -->https://www.tradingview.com/u/WallSt007/#published-charts
Futures market

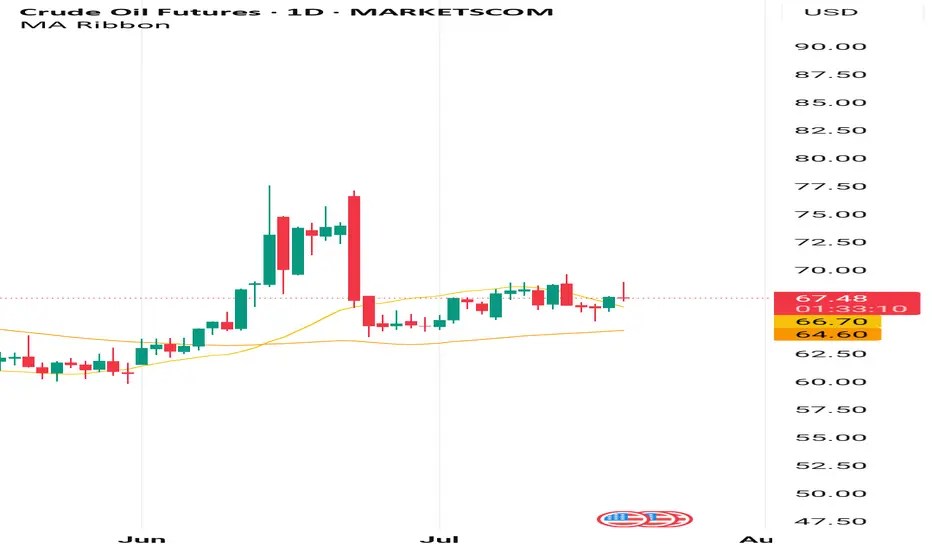
A very strong bullish trend is on the way!!!According to moving averages on daily time frame for oil , a very strong bullish signal is coming and it may leads the price to over 100$!!!!
$NQ Supply and Demand Zones 7/18/25 This is for SEED_ALEXDRAYM_SHORTINTEREST2:NQ chart only, not as many supply zones with the limited timeframes I can use for TradingView free plan. This is my chart coming into next week.
However, we have so far found rejection from new ATH and making our way to retest the imbalances and previous resistance-now support levels of past supply zones.
XAUUSD and gold was gontondown trend ✅ Professional Trading Idea (Gold - XAU/USD, 1H)
🔎 Market Structure & Bias:
Current Bias: Bullish on lower timeframes, ranging on higher timeframe.
Current Price: $3,352 — sitting above both EMAs, showing short-term strength.
Recent Lower High (LH) formed — indicates potential retracement or liquidity grab above.
---
🎯 Buy Setup (High-Probability, Smart Money Based):
Entry Zone (Buy from Demand/FVG):
📍 $3,345 to $3,341 — Clear Fair Value Gap (FVG) and previous Break of Market Structure (BMS) zone
Entry Condition:
✅ Look for bullish price action in this zone (e.g., bullish engulfing, strong rejection, or LTF ChoCH)
✅ EMAs (20 & 50) providing support = extra confirmation
Stop Loss (SL):
🛑 Below $3,341 or $3,338 — just under structure zone to avoid stop hunts
Take Profit (TP):
🎯 TP1: $3,358 — short-term FVG supply
🎯 TP2: $3,361–$3,362 — previous LH/liquidity zone
---
⚠️ Sell Setup (If Structure Breaks):
Only consider selling if:
Price breaks below $3,341 and confirms a bearish market structure
Then wait for a retracement and sell from $3,348–$3,352 FVG

bullish on golda retracement to lower support levels on h4 and h1 then price is expected to shoot to the weekly levels on this coming week

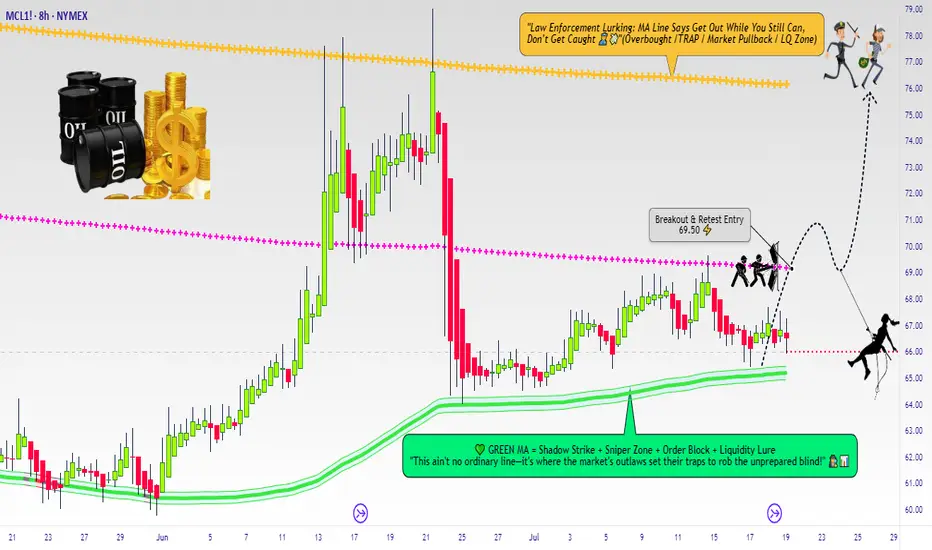
Micro WTI Swing Breakout Setup – Robbing Liquidity the Smart Way🛢️ "Crude Ops: The WTI Energy Vault Breakout Plan" 🛢️
(A Thief Trader Swing Setup | MA Breakout Trap Heist 💰💥)
🌍 Hola! Bonjour! Marhaba! Hallo! Hello Robbers & Market Movers! 🌟
Welcome to another high-voltage heist mission straight from the Thief Trading Den. This ain’t just a chart—this is an Energy Market Extraction Plan based on real smart money footprints 🔎.
🔥 Master Robbery Setup: MICRO WTI CRUDE OIL FUTURES 🎯
We got a bullish breakout alert from the shadows! This is not a drill.
💣 ENTRY STRATEGY
💼 "The Heist Begins Above 68.50"
Watch the Moving Average (MA) zone closely—this is where weak hands get trapped and we slide in with stealth limit or breakout orders:
🛠️ Plan of Entry:
Buy Stop Order: Just above 68.500 (after confirmation of breakout ✅).
Buy Limit Layering (DCA): On pullbacks around 15m/30m swing lows for precision entries.
🧠 Pro Tip: Use alerts to catch the exact entry ignition spark—don't chase, trap with patience like a true thief.
🛑 STOP LOSS (SL)
⚠️ "No SL? That’s a rookie mistake."
SL should only be placed post-breakout using the 8H wick-based swing low (around 66.50).
💡 SL is your personal vault door—set it according to:
Lot size
Risk appetite
Layered entry strategy
📌 Reminder: No SL or order placement before breakout. Let the market show its hand first.
🎯 TARGET ZONE (Take Profit)
Primary Target: 76.00 🏁
But hey... the smartest robbers escape before alarms ring — so trail that stop, secure your profits, and vanish like smoke 🥷.
💥 FUNDAMENTAL & SENTIMENT CATALYSTS
🔥 Current bullish energy comes from:
📉 USD weakness
🏭 Crude inventory drawdowns
⚖️ Geopolitical supply shocks
🐂 Hedge funds scaling long per latest COT data
📊 Intermarket cues from risk-on assets
🧠 Do your diligence: Go check fundamentals, COTs, and macro narratives before entering. Info = Edge.
📢 RISK MANAGEMENT NOTE
🚨 Don't go wild. Market is volatile, especially around:
News drops 📉
Fed or OPEC speeches 🎙️
Crude inventory reports 🛢️
Pause entries during news events. Use trailing SLs to lock the vault behind you.
❤️ SUPPORT THE ROBBERY MISSION
💣 Smash that BOOST button if this plan hits your nerve.
Let’s keep robbing liquidity zones together and growing the Thief Trader Brotherhood 🕵️♂️💰.
📡 Stay tuned for the next stealth heist drop. We rob the market with class. 💎🚀
Gold, what are you waiting for?At the end of gold shock convergence, 3310 defensive long orders are still the main theme!
Gold, what are you waiting for?
After three consecutive months of triangle convergence shock, the market is getting narrower and narrower, and the bulls and bears are tug-of-war. The market patience is being exhausted! But the more this time, the more calm you should be-the big market often breaks out after extreme depression!
Big cycle: 3420-3310 range shock, the lower track support gradually moves up, 3310 has become the last line of defense for bulls! As long as it is not broken here, any decline is a trap, and getting close is a low-long opportunity!
Key resistance: 3374 is still the watershed between longs and bears. Only by breaking through here can we open up the space to impact 3400-3420, otherwise continue to shock and wash the market!
👉 Core idea: 3310 is not broken, low-long is the main; 3374 is not broken, high-throw is the auxiliary!
Yesterday's US market staged a "fake fall" and then pulled back strongly, indicating that the buying in the 3310-3320 area is strong! But if the Asian and European markets continue to fluctuate weakly today, don't rush to chase the shorts-the US market is likely to rise again!
Key support: 3310-3320 (touch and buy in batches, defend 3300)
Short-term resistance: 3345-3350 (middle rail pressure), 3355-3360 (channel upper rail)
Ultimate suppression: 3374 (break through and turn strong, otherwise continue to sell high)
⚠️ Note:
If the Asian and European markets fall but do not break 3320, the US market may directly rise!
If it quickly drops to 3310 and then quickly recovers, the "golden needle bottoming" signal appears, close your eyes and buy more!
【Today's operation strategy: defensive low long, key position high short】
Steady long order: enter the market in batches in the 3310-3320 area, target 3335-3350, break to see 3370, strictly stop loss below 3300!
Aggressive short: 3366-3370 light position short, target below 3350, stop loss 3378 (only when under obvious pressure)
🔥 The breakthrough at the end of the shock is often very violent, be sure to bring a stop loss to prevent false breakthroughs!
The US market is the main battlefield, don't be fooled by the shock of the Asian and European markets, and wait patiently for the key position to take action!
【Finally concluded: Gold is accumulating strength, only the last fight is left! 】
If 3310 is not broken, the bottom-picking long order will be held firmly; if 3374 breaks through, increase the position to see 3400! The market is waiting for a fuse - either the Fed will release dovish, or Trump's tariffs will trigger risk aversion! Before that, sell high and buy low, and respond flexibly, but remember - the general direction, the bulls have not lost yet!
Gold, it's time to choose a direction, are you ready? 🚀

Gold Analysis and Trading Strategy | July 18✅ Gold prices are currently oscillating around the 3355 level. This area coincides with the emotional rebound high seen on Wednesday. The current stagnation between 3355–3358 reflects market hesitation to push prices higher.
✅ As we approach the end of the week, traders are inclined to avoid weekend risk and remain on the sidelines, waiting for a clearer direction next week. Both bulls and bears are cautious, preferring to enter only at price levels offering a favorable risk-reward ratio.
🔴 Breakout Resistance Zone: 3365–3375
A breakout above this level could open the way toward 3390–3400.
🔴 Key Resistance Zone: 3355–3358
This is the high formed by Wednesday's rebound and has repeatedly capped price action during the U.S. session.
🟢 Key Support Level: 3345
This is the critical level for the U.S. session and serves as a pivot between bullish and bearish momentum.
🟢 Secondary Support: 3320–3325
Further downside may test this region if bearish pressure continues.
🟢 Strong Support: 3307–3310
Losing this zone would significantly damage the medium-term bullish structure.
✅ Trading Strategy Reference:
🔰 If gold closes the day above 3345, it suggests that bullish momentum remains intact. Next week, focus will remain on a potential breakout above 3355–3358. A successful break could lead to targets around 3390–3400.
🔰 If price fails to hold above the 3345 key support, it indicates weakening bullish momentum. In that case, the preferred strategy for next week would be to sell on rallies, with 3355–3358 as a key resistance area.
🔥Trading Reminder: Trading strategies are time-sensitive, and market conditions can change rapidly. Please adjust your trading plan based on real-time market conditions. If you have any questions or need one-on-one guidance, feel free to contact me🤝

Euro LongsI've been waiting for euro to reach discount of its daily range and deliver into a daily BISI.
Mon - Wed trade lower into key arrays. Intraweek reversal confirmed with 4h and 1h CISD. Paired with Pound SMT at the daily lows.
LRLR built up from last weeks pullback. That bsl looks too obvious to me.
Entering off 1h cisd at 1.16650. Stop at Wednesday low. Targeting manipulation leg STD levels and relative equal highs at 1.19045
If the weekly draw on liquidity is to the upside, this intraweek reversal will hold. I know im wrong on direction if Wednesday low doesnt hold. The framework and logic line up with what I look for. Midweek Reversal daily profile. Thursday continuation in play.

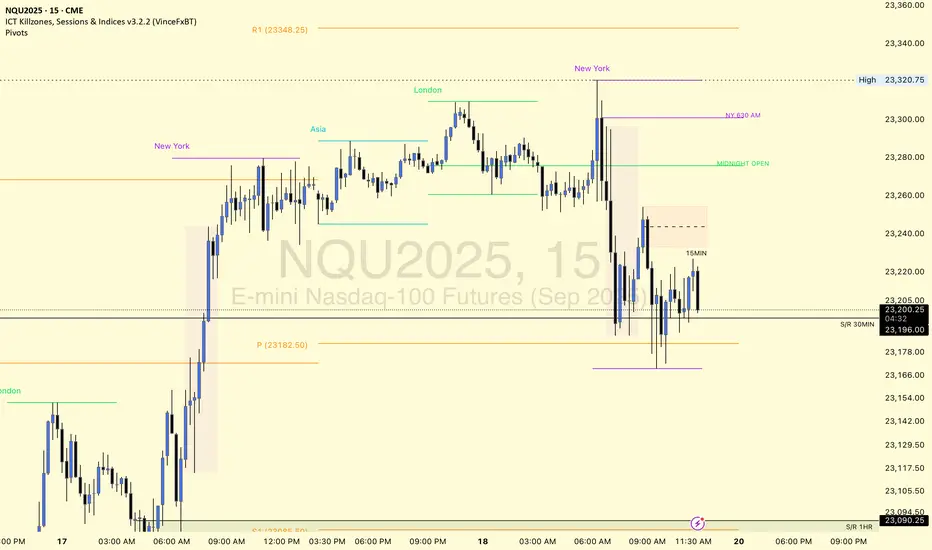
Trading Setup by Lord MEDZInstrument: MNQ (Micro E-mini Nasdaq-100 Futures)
Timeframe: 30s
Date: July 18, 2025
Setup Type: PO3 + Liquidity Sweep + CE Rejection
Status: Active – Stop Loss Moved to Break-Even (Risk-Free Trade)
🧠 Narrative:
Today’s price action offered a textbook setup aligned with smart money principles.
London High Swept:
New York session initiated with a liquidity grab above London’s high, triggering breakout traders and stops from early shorts.
Break of Structure (BOS):
Shortly after the sweep, price reversed with impulsive bearish structure, confirming the initiation of the expansion leg in a PO3 model.
NY Dealing Range Formed:
Range was established from the 9:30 to 10:30 AM EST window. High = Sweep of London; Low = Structural pivot post-BOS.
Retracement to 50% CE Level:
Price retraced into the 50% Consequent Encroachment of the NY Dealing Range — a known smart money rejection zone.
High Confluence Zone:
The entry area aligned with:
The Goldbach High
PO3 81% Extension
Historical inefficiencies and order block resistance
📌 Trade Details:
Entry: 23,237.75 (Sell Stop below CE Rejection)
Stop Loss: Initially above Goldbach High – now moved to break-even (BE)
Target 1: 23,180 (First liquidity pool)
Target 2 (Stretch): 23,166.00 (Premium-to-discount reversion / FVG)
🔒 Risk Management:
✅ Trade is now risk-free.
Stop has been moved to break-even after initial rejection confirmed the setup. No emotional exposure—only upside potential.
🧘🏽 Mindset:
This is where discipline pays. Setup aligned, confluences stacked, and execution clean. Let the market do the rest.
"No need to force the outcome. If it’s meant to pay, it will. I’ve already done my job. Now, I watch."
— Lord MEDZ

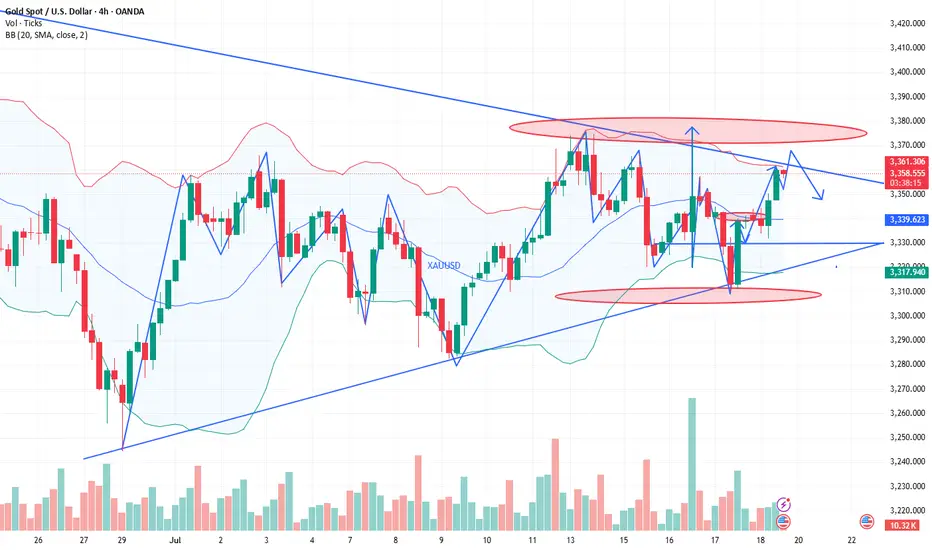
XAU/USD 18.07.25Bullish Pattern Active — Targeting 3409 and 3451
Market Overview:
Gold is moving within an ascending channel after rebounding from the BUY zone around 3300–3320. A bullish ABC pattern is forming, suggesting further upside momentum.
Technical Signals & Formations:
— Strong rebound from the 3300 BUY zone
— Higher lows indicate a bullish structure
— Breakout above 3375 opens the way to 3409 and 3451
— EMA(144) supports upward trend continuation
Key Levels:
Support: 3320–3309, 3297
Resistance: 3375, 3409, 3451 (D1), 3500 (MN)
Scenario:
Primary: continuation toward 3409 and then 3451
Alternative: pullback to 3375 or retest of 3300–3320 zone before resuming the uptrend

How to operate the gold market opening next MondayAnalysis of gold market trends next week:
Analysis of gold news: Spot gold fluctuated and rose in a narrow range during the U.S. market on Friday (July 18), and is currently trading around $3,354.05 per ounce. On Thursday, spot gold staged a thrilling "deep V" market. Under the dual stimulation of the U.S. retail sales data in June exceeding expectations by 0.6% and the number of initial jobless claims falling to 221,000, the U.S. dollar index once soared to a monthly high of 98.95, instantly suppressing spot gold to an intraday low of $3,309.82 per ounce. But surprisingly, the gold price then rebounded strongly and finally closed at $3,338.86, down only 0.25%. This "fake fall" market reveals the deep contradictions in the current market-although economic data temporarily supports the strengthening of the U.S. dollar, investors' concerns about inflation caused by tariffs are forming a "hidden buying" of gold. The joint rise of the U.S. dollar and U.S. bond yields did suppress gold prices, but strong takeover orders emerged in each falling window. Behind this phenomenon, smart money is quietly making plans. When the 10-year U.S. Treasury yield climbed to a monthly high of 4.495%, gold refused to fall further. This divergence suggests that the market has serious differences on the direction of the Fed's policy.
Technical analysis of gold: After the opening yesterday, gold continued to fall slowly, and the negative impact of the unemployment data in the U.S. market further suppressed the bullish momentum. The lowest price in the U.S. market reached 3310, and the cumulative decline for the whole day exceeded 30 US dollars. But the key is that gold rebounded again at midnight, forming a wide range of fluctuations on Thursday, which was completely in line with expectations. The 3310 bottom-picking and long-term strategy given during the session successfully captured large profits in the band. This trend once again verified the core judgment of this week: gold is in a high-level fluctuation dominated by a bullish trend, and the practical value of this view continues to highlight. After clarifying the current dual attributes of "bullish trend + volatile trend", Friday's trading needs to focus on the effective profit space within the range. It is expected that the 3375-3310 large range will be difficult to break this week, and the small range can be locked at 3355-3320. Before the range is broken, high-selling and low-buying operations can be performed.
.
The technical side shows that the daily line and the 4-hour Bollinger Bands are closed synchronously. At this time, there is no need to worry about the direction, and effective trading can be achieved by keeping a close eye on the range boundary. It is worth noting that the 4-hour moving average system has obvious upward divergence characteristics. Continuing the rebound momentum at midnight on Thursday, gold still has room to rise today, and the upper target is 3360-3365. The small cycle support is clear: 3330 and 3320 are not broken, both are good opportunities for long positions. During the US trading session, it is necessary to pay attention to the breaking of the 3365 and 3375 resistance levels: if the pressure is not broken, there will be room for a decline, and short-term short positions can be tried. On the whole, Charlie suggests that the short-term operation strategy for gold next week should focus on buying on pullbacks and buying on dips, supplemented by rebounds and selling on highs. The short-term focus on the upper side is the 3375-3385 line of resistance, and the short-term focus on the lower side is the 3340-3330 line of support. FX:XAUUSD ACTIVTRADES:GOLD VANTAGE:XAUUSD TVC:GOLD ICMARKETS:XAUUSD CMCMARKETS:GOLD SAXO:XAUUSD

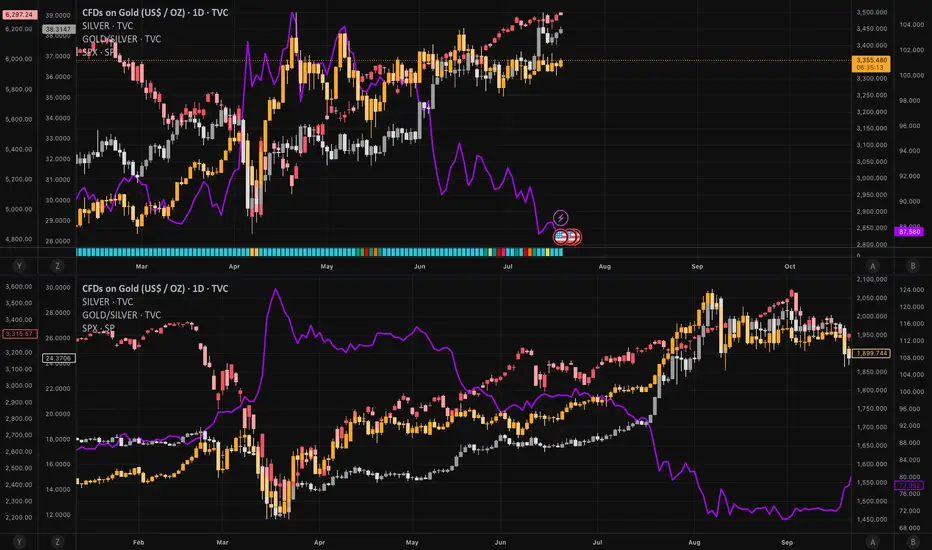
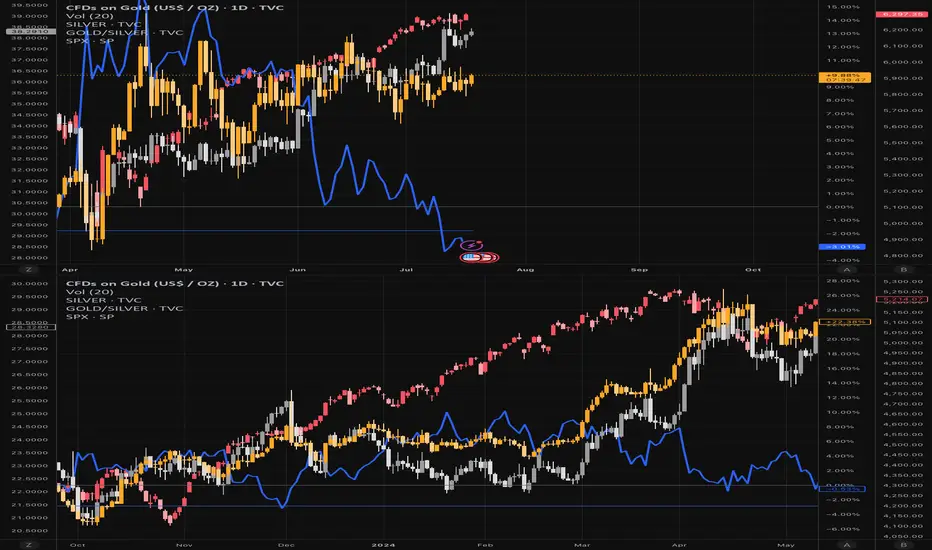
Bear-Trap armed: Gold ticks 4 / 5 boxes - waiting for the spark1️⃣ Why the 2020 déjà-vu is EVEN louder
2025 (now) 2020 (pre-rally)
TradingView ideas still bearish 💬
> 70 % 60 % bearish
Managed-money net-longs ≈ 115 k
-35 % from Apr. –25 % from peak
+ $741 m PM-ETF inflow Record IN-flows
G/S ratio 87 (< 90) Fell to 95
S&P keeps making highs Ditto
2️⃣ What’s still different
Real 10-y TIPS yield +0.7 % vs -1 % in 2020 → smaller monetary tail-wind.
Gold is already at an infl-adj. record – expect a short & sharp squeeze, not a fresh multi-year super-cycle (yet).
3️⃣ Checklist – updated
Signal Status 18 Jul Comment
———————————————————
Gold DAILY close ≥ $3 200–3 250 YES – $3 354 ✔
G/S ratio < 90 YES – 87 ✔
CFTC net-longs < 150 k YES – ~115 k ✔
ETF flows turn positive. YES – $741 m ✔
Equity stress (VIX > 25 or SPX −5 %) NOT YET – VIX 16.5 ✖
4 / 5 boxes = 99 % primed. One spark missing.
4️⃣ What could light the fuse
Date Potential trigger Why it matters
22 Jul Mega-tech Q2 earnings (NVDA/AMD) Any guidance miss → SPX wobble
30 Jul FOMC Fed holds but sounds dovish USD dump + yield spike risk
1 Aug Trump s “reciprocal” duties Imported-inflation scare → VIX pop
Early Aug. DXY crashes < 96 in < 5 days. Disorderly USD slide = funding stress
Hit ≥ 2 of: DXY < 96, VIX > 25, SPX -5 % or HY-spread +75 bp → final ✔.
Bottom line
The bear-trap thesis aged well: sentiment, positioning, ETFs, and G/S ratio have already clicked bullish.
Only equity-market stress is missing. A fast USD slide or a tariff shock right after a neutral Fed is the most likely detonator.
Stay nimble: Collect premium inside $3 250-3 400 while volatility sleeps – but keep alarms on VIX 25 and DXY 96. One red headline could still launch the squeeze.
Disclaimer: Educational opinion, not investment advice. Futures & CFD trading is risky – do your own research and consult a professional.
1 minute ago
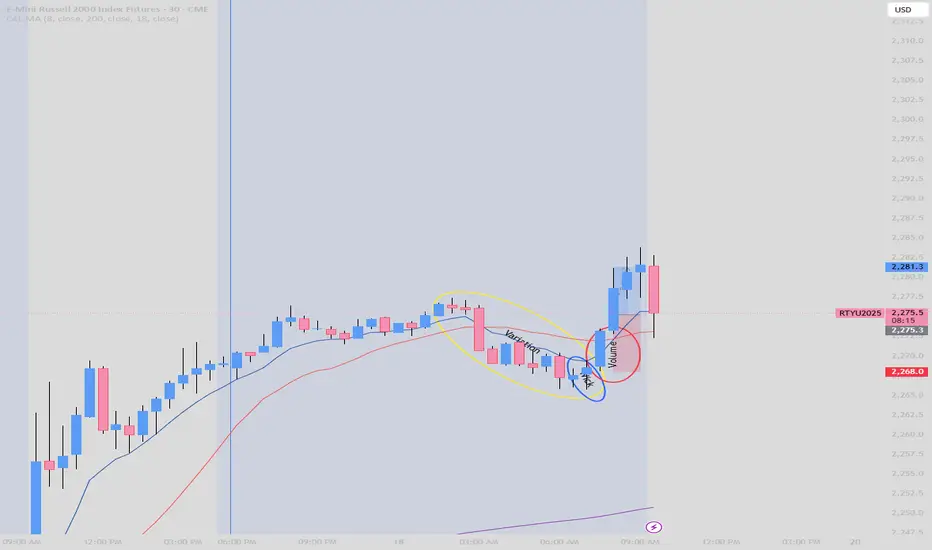
07/18 Trade Russel1. Variation: As we can see over and over again the bears(sellers) were losing momentum so I had to wait for their downfall.
Variation in this strategy in simple words is basically when you see a mix of bearish and bullish candles but on a downtrend. The whole point of the strategy is to buy when there is a trend
reversal and the only way to really confirm the reversal or at least knowing that is coming is to wait for...
2. Candle with a wick that rejects price going down further.
Usually, I like long wicks because it gives me more assurance but since this trade was before NY open
I had to take some risks but not without waiting for the final step....
3. Volume to the upside: When you see a big candle that means that the big boys (institutions like the guys handling your mama's pension) are getting their orders filled because they like to buy low and sell high to guys like me sometimes. Now, I rather buy only when they buy and use their low as a stop loss.
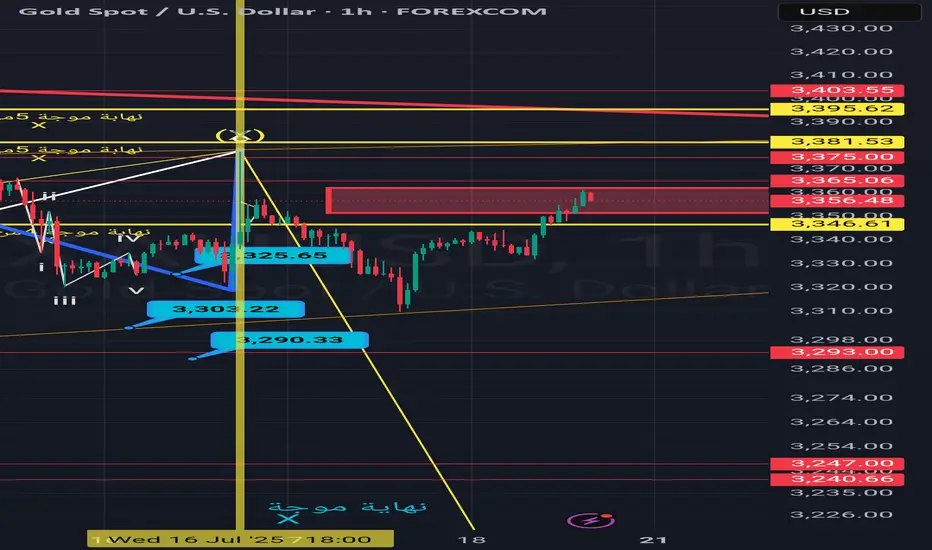
Xauusd .. corection wave W,x,y,xx,zXauusd .. corection wave W,x,y,xx,z
I tink we will end the up trend today
I need to know your opinions
Pre-Market Prep 7.18.2025What it do, everyone! Here’s my pre-market prep for Friday, July 18th. Just to give you a quick overview, I'm using my prior value areas, the prior day's high and low, and the CVA levels from my market profile. I use all this history to help me plan my trades for the day.
So, starting with the S&P, as of now we’re green across the board. We’re in balance up from the prior day’s range, value area, and the CVA. My main plan is to look for acceptance and a pullback to a confluence area for longs. If we get rotational and break out of that area, I’m ready to go short.
For the NASDAQ, it's a similar story. We’re rotational in the prior value area and range, but we’re balanced up from the recent CVA. Right now, I’m waiting to see if we can confirm acceptance and then I’ll look for a short from that rotational area down to the prior value area low.
In the Russell, I’m seeing clear acceptance above all levels, so a pullback to the confluence area for a long would be ideal.
For Gold, I’m also seeing it in balance up on all fronts. My first move would be a long from the prior day’s high. If we drop a bit lower, I’ll be looking at that CVA and PVA area for another long.
The Euro is a bit more mixed. We’re rotational in the prior day’s range but balanced up in the value area and CVA. I want to clear the prior day’s high before taking any big moves.
The Yen is also rotational, so I’m looking to trade the extremes, maybe some scalps while we’re balanced in the prior value area.
For the Aussie Dollar, we’re in balance up from the PVA, but rotational in the prior day’s range and CVA. I’m looking for shorts near the top area and longs at the bottom, staying out of the middle for now.
And finally, Crude Oil is rotational on all fronts. My first plan is to look for shorts from the confluence area down to the prior day’s range.
That’s my pre-market prep for today. Let’s trade smart. Happy Friday, peace!

Gold trend analysis and latest exclusive operation suggestionsTechnical analysis of gold: After the opening yesterday, gold continued to fall slowly. The negative impact of unemployment data in the US market further suppressed the bullish momentum. The lowest price in the US market reached 3310, and the cumulative decline for the whole day exceeded 30 US dollars. But the key is that gold in the New York market rebounded again, forming a wide range of fluctuations on Thursday, which was completely in line with expectations. The 3310 bottom-picking and long-term strategy given during the session successfully captured large profits in the band. This trend once again verified the core judgment of this week: gold is in a high-level fluctuation dominated by the bullish trend, and the practical value of this view continues to highlight. After clarifying the current dual attributes of "bullish trend + oscillating trend", Friday's trading needs to focus on the effective profit space within the range. It is expected that the 3375-3310 large range will be difficult to break during the day this week, and the small range can be locked at 3355-3320. The high-selling and low-buying operations can be performed before the range is broken.
The technical side shows that the daily line and the 4-hour period Bollinger band are closed simultaneously. At this time, there is no need to worry about the direction, and effective trading can be achieved by keeping a close eye on the range boundary. It is worth noting that the 4-hour moving average system has obvious upward divergence characteristics. Continuing the rebound momentum of the New York market on Thursday, gold still has room to rise today, and the upper target is 3360-3365. The small cycle support is clear: 3330 and 3320 are not broken, both are good opportunities for long positions. During the US trading period, we need to pay attention to the breaking of the 3365 and 3375 resistance levels: if they are under pressure and not broken, there will be room for a fall, and you can try short-term shorting. Overall, Charlie recommends that the short-term operation strategy for gold today is mainly to step on the low and long, supplemented by the rebound high. The short-term focus on the upper side is the 3375-3385 resistance, and the short-term focus on the lower side is the 3345-3335 support. PEPPERSTONE:XAUUSD VELOCITY:GOLD EIGHTCAP:XAUUSD ACTIVTRADES:GOLD EIGHTCAP:XAUUSD CMCMARKETS:GOLD EIGHTCAP:XAUUSD
Bear-Trap armed: Gold ticks 4 / 5 boxes - waiting for the spark
1️⃣ Why the 2020 déjà-vu is EVEN louder
2025 (now) 2020 (pre-rally)
TradingView ideas still bearish 💬
> 70 % 60 % bearish
Managed-money net-longs ≈ 115 k
(-35 % from Apr) –25 % from peak
+ $741 m PM-ETF inflow, first after months Record IN-flows
G/S ratio 87 (< 90) Fell to 95
S&P keeps making highs. Ditto
2️⃣ What’s still different
Real 10-y TIPS yield +0.7 % vs -1 % in 2020 → smaller monetary tail-wind.
Gold is already at an infl-adj. record – expect a short & sharp squeeze, not a fresh multi-year super-cycle (yet).
3️⃣ Checklist – updated
Signal Status 18 Jul Comment
———————————————————
Gold DAILY close ≥ $3 200–3 250 YES – $3 354 ✔
G/S ratio < 90 YES – 87 ✔
CFTC net-longs < 150 k YES – ~115 k ✔
ETF flows turn positive. YES – $741 m ✔
Equity stress (VIX > 25 or SPX −5 %) NOT YET – VIX 16.5 ✖
4 / 5 boxes = 99 % primed. One spark missing.
4️⃣ What could light the fuse
Date Potential trigger Why it matters
22 Jul Mega-tech Q2 earnings (NVDA/AMD) Any guidance miss → SPX wobble
30 Jul FOMC Fed holds but sounds dovish USD dump + yield spike risk
1 Aug Trump s “reciprocal” duties Imported-inflation scare → VIX pop
Early Aug. DXY crashes < 96 in < 5 days. Disorderly USD slide = funding stress
Hit ≥ 2 of: DXY < 96, VIX > 25, SPX -5 % or HY-spread +75 bp → final ✔.
Bottom line
The bear-trap thesis aged well: sentiment, positioning, ETFs, and G/S ratio have already clicked bullish.
Only equity-market stress is missing. A fast USD slide or a tariff shock right after a neutral Fed is the most likely detonator.
Stay nimble: Collect premium inside $3 250-3 400 while volatility sleeps – but keep alarms on VIX 25 and DXY 96. One red headline could still launch the squeeze.
Disclaimer: Educational opinion, not investment advice. Futures & CFD trading is risky – do your own research and consult a professional.
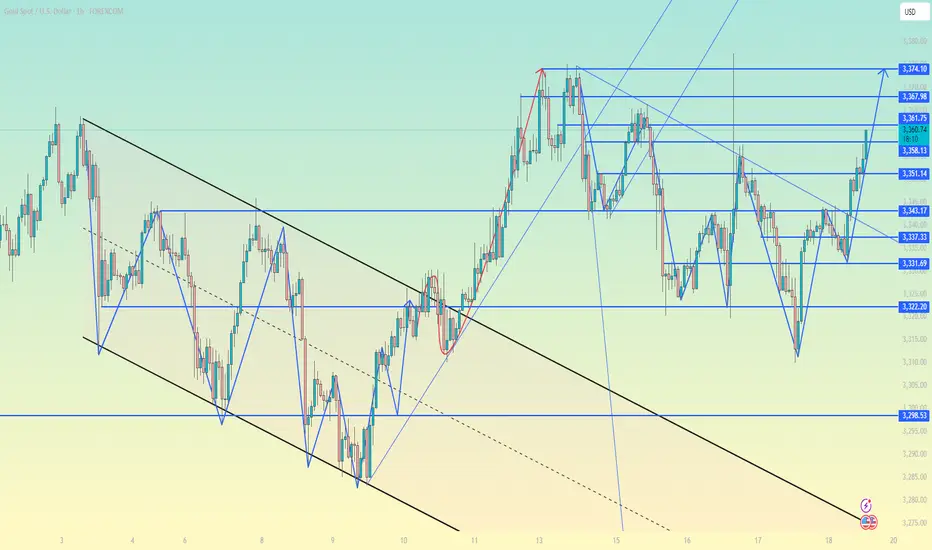
Gold (XAU/USD) Bullish Outlook Based on Price ActionGold (XAU/USD)**, showing a bullish outlook based on price action and support zones.
**Chart Analysis:**
* **Current Price:** \$3,359
* **EMA Signals:**
* EMA 7: \$3,353
* EMA 21: \$3,345
* EMA 50: \$3,341
**Bullish EMA alignment** (short EMAs above long) signals upward momentum.
* **Support Zones:**
* **S1**: \~\$3,345 (strong short-term demand area)
* **S2**: \~\$3,325 (deeper support zone)
* **Volume:** Spikes in green bars signal strong buyer interest near support, especially during the bounce.
* **Projected Move (Green Arrow):**
* A potential retest of the breakout zone (\~\$3,350) could happen before gold targets the **next key resistance** near **\$3,410**.
**Summary:**
Gold broke above a consolidation range supported by EMA alignment and strong volume. As long as the price stays above S1 (\$3,345), the trend remains bullish with upside potential toward \$3,400–\$3,410. A pullback may occur first, offering re-entry opportunities.

XAUUSD
XAUUSD Updated in 15M :
The gold signal is marked on the chart based on the latest price changes and the supply and demand in the market. These points include the entry point, stop loss, and take profit

Gold short-term analysis: mainly long on pullbackGold short-term analysis: mainly long on pullback
Core driving factors
Fed policy suppression: Although officials have recently released dovish signals, strong US retail sales and employment data support the expectation of "higher interest rates for longer", limiting the upside of gold.
Risk aversion support: Trump's tariff policy concerns are rising. If the tariff increase is implemented before August, it may stimulate safe-haven buying and push gold prices to break through the range of fluctuations (3300-3366).
Technical signals
Key breakthrough: 4-hour 3340 middle track, hourly chart breaks through the downward trend line, European session continues to rise, and US session is expected to rise again.
Support/resistance:
Long order entry: 3344-3340 (trend line support + middle track), stop loss below 3335.
Target: 3365-3375, 3400 can be seen after the breakthrough.
Operation strategy
Low-to-long: Stabilize near 3344 and go long, strictly stop loss 3335.
Beware of risks: If the U.S. data is stronger than expected (such as PPI, hawkish speech by the Federal Reserve), it may suppress gold prices and we need to guard against false breakthroughs.
XAUUSD Structure Analysis | Smart Money Concepts XAUUSD Structure Analysis | Smart Money Concepts | July 17, 2025
Market Overview:
Gold (XAUUSD) is currently trading around the $3,328 level, showing clear Smart Money behavior with multiple Breaks of Structure (BOS), liquidity grabs, and reactions from key zones. The chart outlines a well-respected price action between a defined resistance and support range, showing signs of a potential reversal or continuation setup.
🧠 Key Concepts Highlighted:
BOS (Break of Structure):
Multiple BOS levels confirm internal shifts in market structure, indicating active participation by institutions and smart money. Every BOS marks a potential order block or liquidity sweep zone.
Resistance Zone ($3,375 - $3,400):
Price has reacted multiple times from this level, showing exhaustion with each push. This zone is acting as a liquidity magnet but also a strong supply area.
Support Zone ($3,320 - $3,335):
This area has provided multiple rejections and BOS confirmations, turning into a reaccumulation zone. Current price action is consolidating within this support.
Strong Support ($3,245 - $3,270):
In case of further downside, this zone could serve as a high-probability long entry for swing buyers due to historical demand and previous liquidity grabs.
📈 Trade Outlook:
If price maintains support above $3,320, we could see a bullish reaction toward $3,375 targeting the upper resistance.
A clean BOS above $3,375 would confirm a short-term bullish continuation and potential expansion phase.
Failure to hold this support would open a path to the $3,270 area, offering discounted pricing for long-term bulls.
🎯 Educational Insight:
This chart is a textbook example of Smart Money Concept (SMC) structure:
Observe BOS frequency as institutional fingerprints.
Price respects previous demand zones, giving room for reactive trading setups.
The confluence between horizontal support and trendline break adds extra confirmation for decision-making.

GOLD Price Prediction - 1M (Updated)Be careful — global gold prices are approaching their all-time historical high.
**** Yousef Sharafi ****
Follow me here for more analysis
