Xauusd Weekly closing Gold is currently holding rising channel along with the Range of 3345-3370.
What's possible scanarios we have?
▪️I'm looking for Buying trade As scalp towards 3370 also we have 3345 support area for potential buying spot.
Watch the H4 close above 3345 keep buy set targets at 3368 then 3380.
▪️ keep in mind blew 3345 we have sellers gap towards 3330-3320.
Futures market

Xauusd Bullish 18 July 2025 $4085 Prediction📍Kuala Lumpur, Malaysia – 18 July 2025
GOLD (XAUUSD) INSIGHT – First Accumulation Entry Begins
Today marks the first leg of bullish territory for Gold (XAUUSD) as price begins its early accumulation phase ahead of the Federal Reserve’s rate decision in 11 days. Using a refined OHLC strategy alongside my proprietary Chrono Conditioned Trading (CCT) method, I foresee a strategic retest around $3357 to $3360, which could unlock the momentum needed to approach $3400 and eventually $3500 a key psychological resistance before price makes its way to the $5000 projection.
🧠 Technical Insight: OHLC Strategy
The OHLC (Open-High-Low-Close) method is vital for identifying precision entries:
Open shows the market’s first reaction;
High and Low define intraday volatility boundaries;
Close indicates market sentiment and real direction.
In today's setup, early accumulation begins near the previous daily open, and a break above yesterday's high signals that buyers are returning in strength.
⏱ CCT – Chrono Conditioned Trading Approach
My CCT method focuses on timing-based entries combined with price conditioning:
Entries are planned around event timelines like the upcoming FOMC rate release (FedWatch).
CCT waits for the “right time and right structure” not just price but when price moves.
Today fits that condition: early cycle, pre-news sentiment, and a clean OHLC break structure.
💡 Trading Tip:
“Never chase gold. Let the structure and time align. When OHLC confirms and CCT conditions are met only then, you strike.”
🗓 Fed Expectations:
Although rate cuts are projected for September and December 2025, it is unlikely the Fed will move in July. That uncertainty fuels speculative accumulation—making today a strategic entry point.
Stay sharp. Watch for OHLC rejections or continuation signals above $3360.
If bulls defend $3357 well, gold may reclaim the $3400 range soon setting the stage for the ultimate test at $3500.
#XAUUSD #GoldTrading #OHLCstrategy #ChronoConditionedTrading #FedWatch #GoldAnalysis #CCTMethod
Regards,
Zezu Zaza
2048

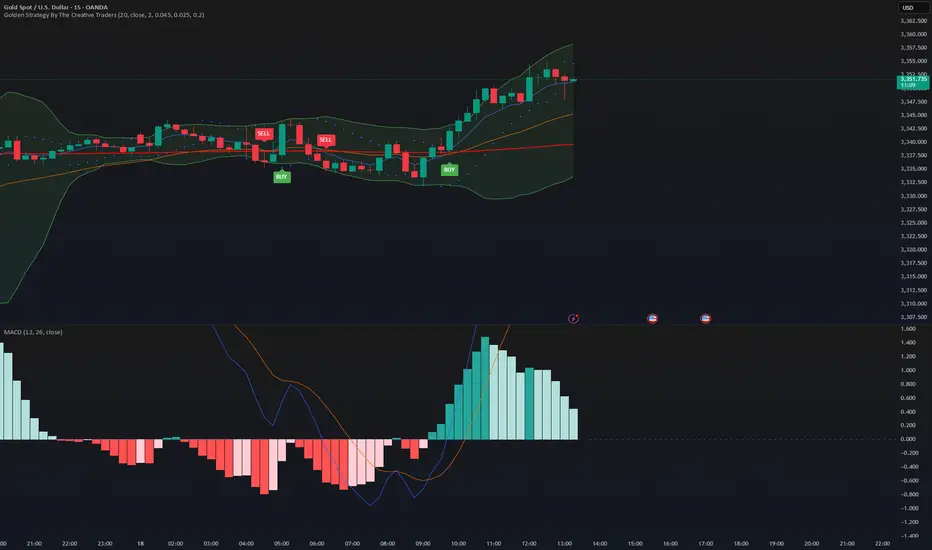
Scalping 5 minutes TFThis is last information about #xau scalping with to factor elements.
Fibonacci retracement and smart money concept say us about LL and HH between two blue line channel in rally up and down.
As the image information you can find entry price and SL and 3 step TP
Regard 🙏
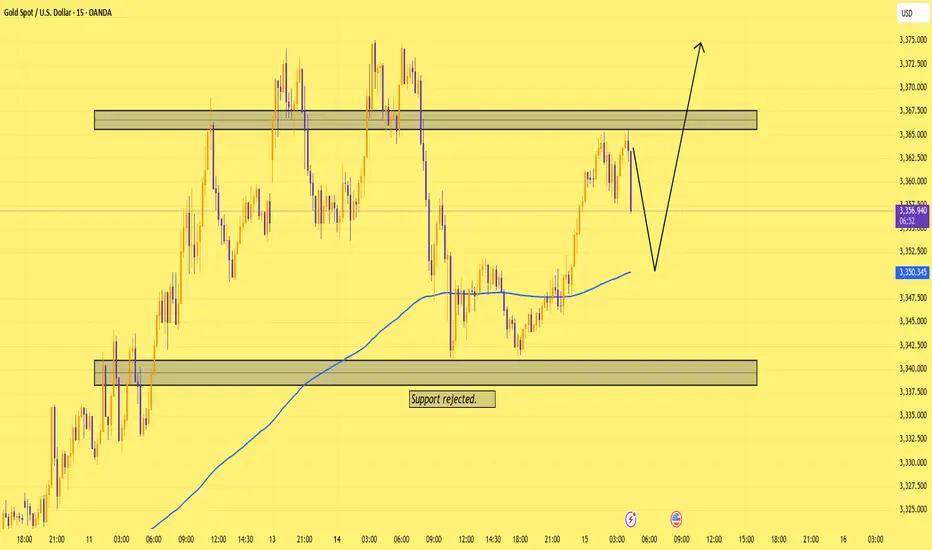
XAUUSD SELL OR TRAP (READ CAPTION)Hi trader's. what do you think about gold
current price: 3331
gold is working in bullish Parrallal channel under gold retest is down side 3320 and 3307 this is support market respect this zone and reject support and and h1 candle close in bullish so possible gold pump upside
support zone: 3320:3307
resistance zone :3345
supply 3374
please like comment and follow thank you

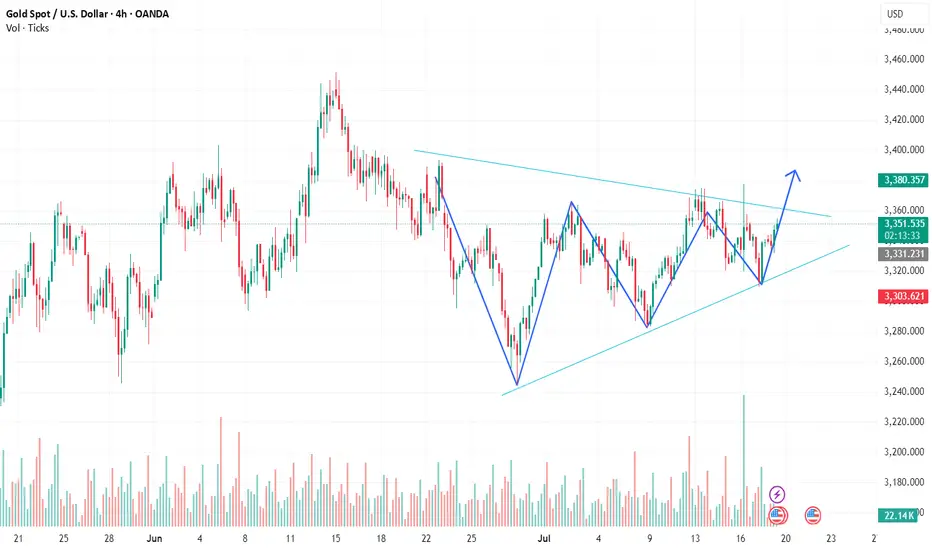
GOLD H1 Technical Analysis🧠 Chart Breakdown & Trade Idea: Symmetrical Triangle Formation
We’re observing a symmetrical triangle formation — a classic consolidation pattern that often precedes a strong breakout move. The price has been making higher lows and lower highs, gradually tightening within two converging trendlines.
This pattern indicates that buyers and sellers are in a temporary equilibrium, with volatility compressing. The market is clearly waiting for a catalyst to decide the next big move.
🔍 Key Observations:
1. Trendlines:
- The upper resistance trendline is sloping downward, connecting several lower highs.
- The lower support trendline is sloping upward, connecting multiple higher lows.
2. Volume Pattern:
- Volume has been tapering off during the consolidation phase — a typical behavior during triangle formation.
- A volume spike at the breakout point would confirm the direction and strength of the move.
3. Price Action:
- The price has bounced cleanly off the lower trendline and is now approaching the upper boundary.
- A strong V-shaped recovery from support indicates buyer dominance at lower levels.
- The market is now testing the triangle’s upper resistance again — a crucial inflection point.
🚀 What the Chart is Saying
The chart is signaling a potential bullish breakout. The consistent formation of higher lows shows increasing demand, and the price is now poised to test — and possibly break — the descending resistance.
If the breakout happens with above-average volume, it would validate the pattern and open the door for a sharp upward rally.
🎯 Trade Setup (When to Buy)
✅ Buy Entry:
- Wait for a confirmed breakout — a candle close above the upper trendline with strong volume.
- Ideally, price should break above the recent swing high to avoid a false breakout.
🛑 Stop Loss:
- Just below the most recent higher low or the triangle’s lower trendline.
🎯 Take Profit:
- Measure the widest part of the triangle and project it upward from the breakout point.
- This gives you a realistic and technical target area.
📌 Conclusion:
This symmetrical triangle is nearing its apex, and the current setup favors the bulls. A breakout above resistance, accompanied by volume, could offer a high-probability long trade. Patience is key — wait for confirmation before entering.
GOLD! Pre-Market Analysis For Friday July 18th!In this video, we'll present pre-market analysis and best setups for Friday July 18th.
Enjoy!
May profits be upon you.
Leave any questions or comments in the comment section.
I appreciate any feedback from my viewers!
Like and/or subscribe if you want more accurate analysis.
Thank you so much!
Disclaimer:
I do not provide personal investment advice and I am not a qualified licensed investment advisor.
All information found here, including any ideas, opinions, views, predictions, forecasts, commentaries, suggestions, expressed or implied herein, are for informational, entertainment or educational purposes only and should not be construed as personal investment advice. While the information provided is believed to be accurate, it may include errors or inaccuracies.
I will not and cannot be held liable for any actions you take as a result of anything you read here.
Conduct your own due diligence, or consult a licensed financial advisor or broker before making any and all investment decisions. Any investments, trades, speculations, or decisions made on the basis of any information found on this channel, expressed or implied herein, are committed at your own risk, financial or otherwise.

TradeIdea – Gold (XAUUSD)Looks like a bullish breakout is brewing!
✅ Price has broken out of the descending channel
✅ Retested the global trendline support
✅ Reclaimed the 200-day moving average (MA200)
✅ Momentum indicator surged above the 100 mark
✅ Visible imbalance zone above — potential target area
📌 If price consolidates above $3350, consider a long setup:
🎯 Target 1: $3370
🎯 Target 2: $3375
🧠 Watch for confirmation before entry — structure and momentum alignment is key.

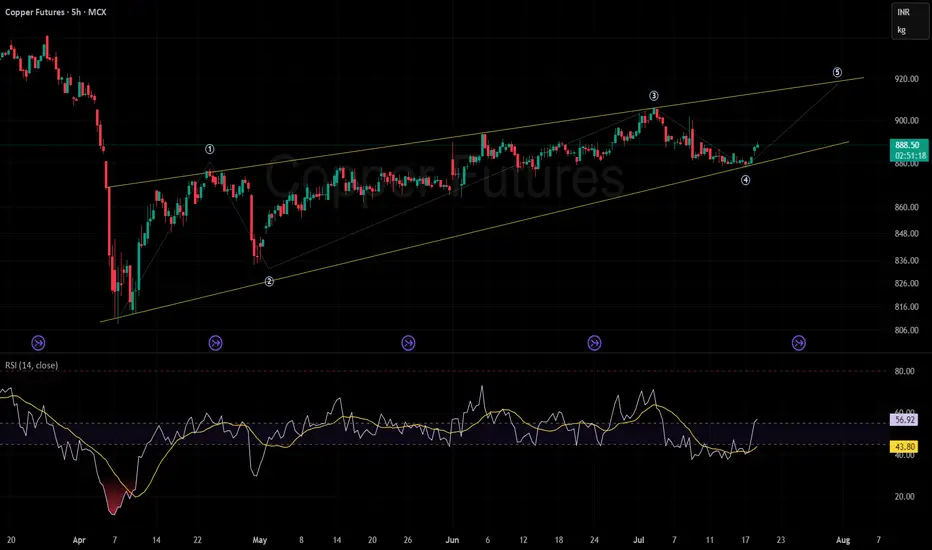
Copper looking good an upmoveKey Observations
Channel Pattern & Elliott Wave Count:
Price action is moving within a well-defined upward-sloping channel (yellow lines).
An Elliott Wave structure is marked (① to ⑤). The price just completed wave ④, suggesting the next move may attempt to form wave ⑤ towards the upper channel boundary, targeting roughly the 920 level.
Price Support & Resistance:
Support: The lower channel boundary, recently tested during the wave ④ dip (~880 area), acts as a dynamic support.
Resistance: The upper channel line, which coincides with the projected wave ⑤, serves as resistance near 920.
RSI & Momentum:
The Relative Strength Index (RSI) at the bottom oscillates between 43.81 (current), with a recent bounce upward.
The yellow MA of RSI is at 57.07, showing the RSI is crossing its MA from below, which is typically a bullish signal.
RSI is neither overbought nor oversold, offering room for upward movement if momentum sustains.
Trend Context:
The overall trend is upward within the channel.
Recent price action after the wave ④ low suggests a renewed attempt at bullish momentum.
Summary & Implications:
The chart implies a bullish bias as long as the lower channel (support) holds. There is a technical setup for a move toward the upper trendline and wave ⑤ target (~920).
Watch for price reactions near the lower channel support—if broken, it would invalidate the immediate bullish thesis.
RSI is supportive of further upside, but needs confirmation from increasing volume and a sustained move above the 890 mark.
Moving as anticipated. Sniper entry Gold analysis this weak. This is a one of the usual patterns that gold tends to form. Check my previous post for full analysis.

Gold (XAU/USD) Market Outlook – July 2025Gold continues to trade at historically elevated levels around $3,352 as of mid-July 2025, representing a significant breakout from previous resistance zones. This price action reflects strong institutional demand amid global economic uncertainty and strategic shifts in monetary policy.
Fundamental Market Forces
Monetary Policy Environment
The Federal Reserve is positioned to begin its easing cycle in Q3 2025, with the first rate cut anticipated as inflationary pressures subside and employment data shows cooling trends. This dovish pivot has substantially weakened real yields and diminished the opportunity cost of holding gold.
Currency and Bond Market Dynamics
The U.S. Dollar Index has retreated from 106 to below 102, creating a favorable backdrop for dollar-denominated commodities. Simultaneously, real 10-year Treasury yields are approaching zero, eliminating the yield disadvantage traditionally associated with gold investments.
Risk Environment
Persistent geopolitical tensions across multiple regions—including the Taiwan Strait and Middle East—alongside energy market volatility have reinforced gold's role as a premier safe-haven asset. Additionally, concerns over long-term currency debasement continue to drive hedge fund and institutional allocation.
Technical Market Structure
Current Trading Dynamics
Price Level: $3,352 (July 18, 2025)
Critical Support Zones
• $3,300: Immediate support representing psychological significance and recent consolidation floor
• $3,245: Key breakout level from late June that now serves as major support
• $3,180: 50-day exponential moving average confluence zone
• $3,095: Fibonacci retracement level and structural support from early June
Resistance Targets
• $3,390: Near-term resistance marking the upper boundary of July's trading range
• $3,450: Extension target based on current momentum patterns
• $3,500+: Psychological milestone and potential breakout objective
Technical Indicators Assessment
• Relative Strength Index: Currently 66-70, indicating mild overbought conditions without signaling immediate reversal risk
• MACD: Displaying bullish crossover with sustained upward momentum
• Moving Average Structure: All key EMAs (20/50/100-day) maintain upward trajectory, confirming strong bullish trend
Trading Outlook for July 2025
Projected Range: 3,245−3,450
Support Zone: 3,245 - 3,300
Resistance Zone: 3,390-3450+
Strategic Assessment
Gold maintains a robust bullish framework with any price declines likely to attract buying
interest, barring unexpected Federal Reserve hawkishness or significant geopolitical deescalation. The combination of accommodative monetary policy expectations, currency weakness, and sustained institutional demand creates a favorable environment for continued gold appreciation through the remainder of July 2025.
Leqidity huntDid not see the last 4H OB , so bias is long, and the fvg shold have been the bounce as it was

Gold At 3350? That’s Where I Make My MoveOur last trade on this pair was well played by the market.
Right now, the primary trend remains bullish.
We’re in a sequence of higher highs and higher lows.
But from current levels, the risk/reward ain’t it.
I’d rather wait for a dip—ideally around 3350, where we’ve got solid support.
No rush. The cleanest entries come to those who wait.
(Tomorrows news data could affect this trade)
Markets are on rise and wait for retestMarkets are on rise, and on daily time frame price is just rising high from 20 ema. Shows strong bullish momentum on rise.
As per order flow, we can see positive delta formation, on the zone 3350 levels.
Buy side is probably on cards.

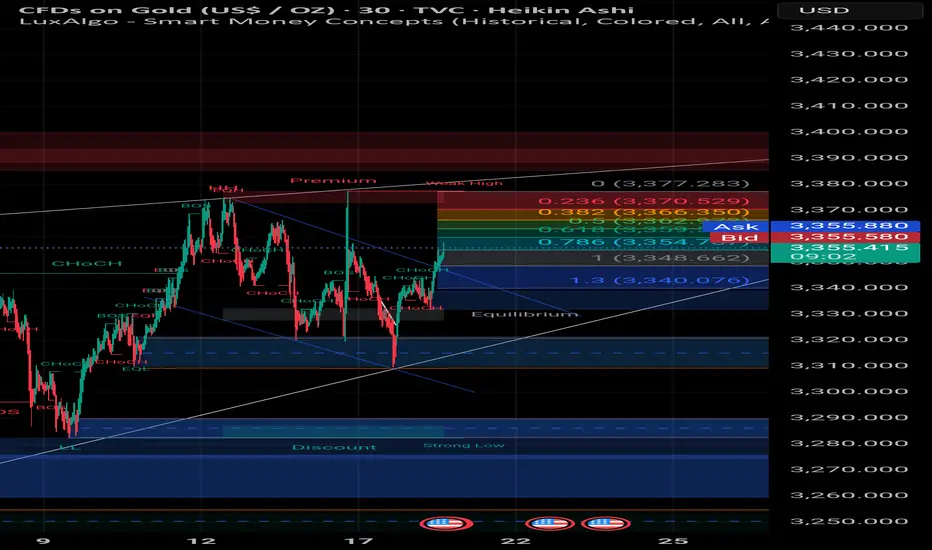
Market Structure (Education) Using Market Structure & Optimal Trade Entry (OTE)
- The current M15 swing structure is bullish .
- A Market Structure Shift (CHoCH/MSS) from bullish to bearish signals a potential short-term reversal.
- After this shift, anticipate a pullback to the Optimal Trade Entry (OTE) zone , typically between the 0.62 and 0.79 Fibonacci retracement levels.
- Once price reaches the OTE zone , expect a reaction or pullback toward the previous swing high , aligning with bullish continuation.
---
🔍 Key Concepts Referenced
- CHoCH (Change of Character) : Indicates a shift in market sentiment or structure.
- BOS (Break of Structure) : Confirms directional bias.
- OTE Zone : A high-probability area for entries during retracements, often between 62%–79% Fibonacci levels.
- Swing High/Low : Reference points for market structure and potential targets.

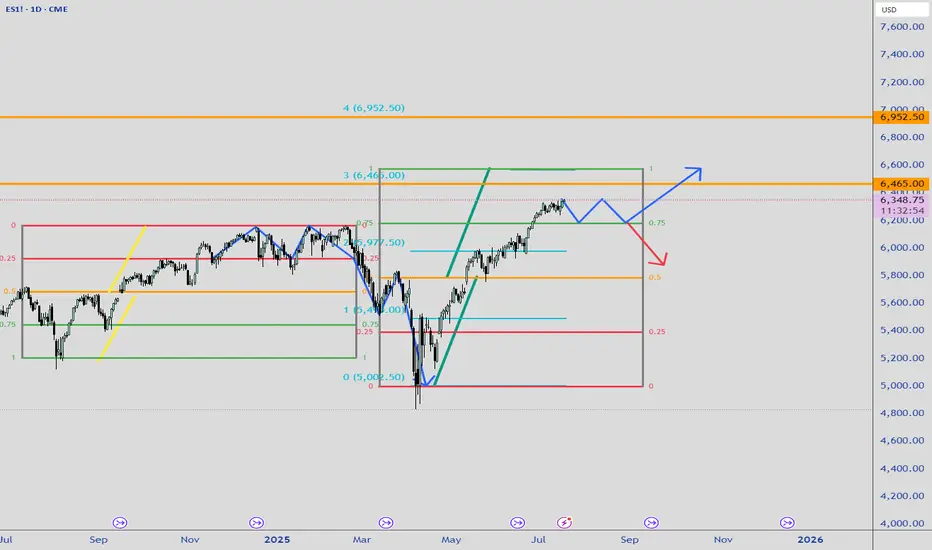
ES! Daily LookWe are still in Mid-month of July and Markets is still strongly bullish. A retracement to previous pivots before completing the symmetry might be a high probability case here. Let see how it turn on in the next few days.
XAUUSD
XAUUSD Updated in 15M :
The gold signal is marked on the chart based on the latest price changes and the supply and demand in the market. These points include the entry point, stop loss, and take profit


Gold Spot / U.S. Dollar (XAU/USD) 4-Hour Chart - OANDA4-hour chart displays the price movement of Gold Spot (XAU) against the U.S. Dollar (USD) from late July to early August 2025. The current price is 3,390.266, with a recent decrease of 10.870 (-0.32%). Key levels include a sell price of 3,336.420 and a buy price of 3,337.020, with a resistance zone highlighted between 3,340.720 and 3,380.000, and a support zone around 3,314.186. The chart includes candlestick patterns and trading indicators.


XAUUSD GOLD – Entering a Power Phase Toward All-Time Highs
XAU/USD is showing a clear bullish continuation pattern after holding strong above the $2,360 support zone. With the DXY breaking down, real yields slipping, and central banks continuing record purchases, gold remains in a perfect storm setup for further upside.

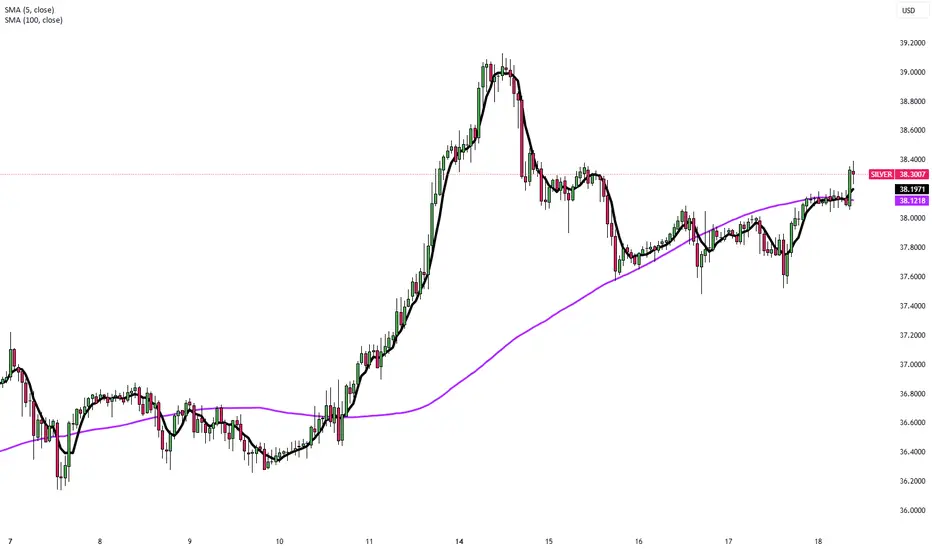
Silver Rebounds Toward $38 as Dollar EasesSilver rebounded toward $38 per ounce on Friday, recovering from a two-day decline as the U.S. dollar and Treasury yields eased. The move reflected shifting sentiment on Fed policy and trade conditions after earlier losses sparked by inflation data that reduced hopes for near-term rate cuts.
U.S. stock futures edged higher following record closes for the S&P 500 and Nasdaq, driven by strong retail sales, lower jobless claims, and optimism in AI-related tech stocks after Taiwan Semiconductor’s positive forecast. On monetary policy, Fed officials remain divided: Mary Daly expects two rate cuts this year, while Adriana Kugler urges caution due to tariff-driven inflation. President Trump reinforced trade tensions by sending letters to over 20 partners setting new tariffs between 20% and 40%.
In corporate updates, United Airlines expects stronger earnings in the second half of 2025, and Chevron signaled higher future cash flow as production in its top U.S. oil field nears a plateau.
Resistance is at 38.50, while support holds at 37.20.
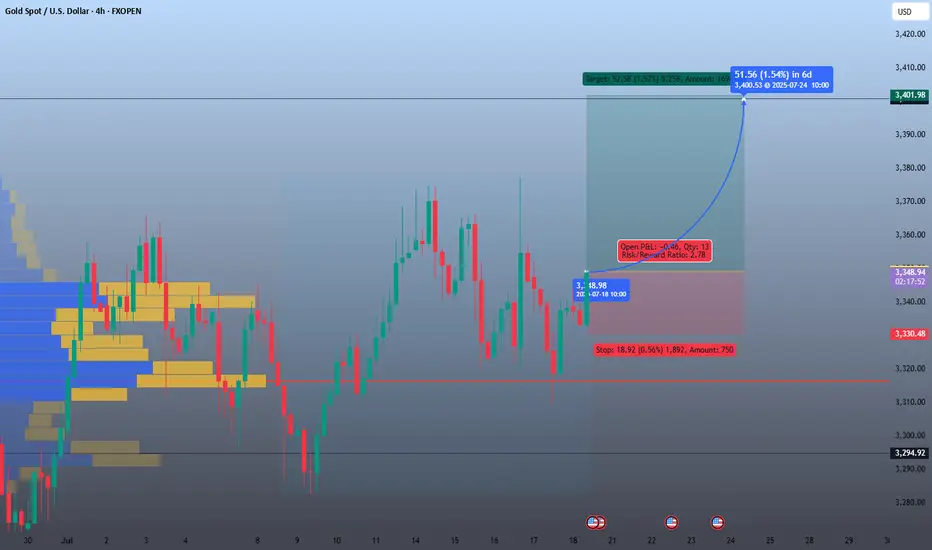
Buy Opportunity📊 Trade Overview:
Entry Price: 3,348.98
Stop Loss: 3,329.48 (-0.57%, -18.92 pts)
Take Profit Target: 3,400.63 (+1.54%, +51.65 pts)
Risk-to-Reward Ratio: 2.78
Volume Profile shows a strong support base at the entry zone
🟩 Bullish View Justification:
Support Zone: Price is rebounding from a high-volume node on the volume profile (yellow zone).
MACD Histogram: Green build-up = Bullish momentum increasing.
Candlestick Formation: Possibly forming higher lows (accumulation pattern).
Risk/Reward: High R:R ratio >2.5 suitable for swing setup.
XAUUSD
XAUUSD Updated in 15M :
The gold signal is marked on the chart based on the latest price changes and the supply and demand in the market. These points include the entry point, stop loss, and take profit
