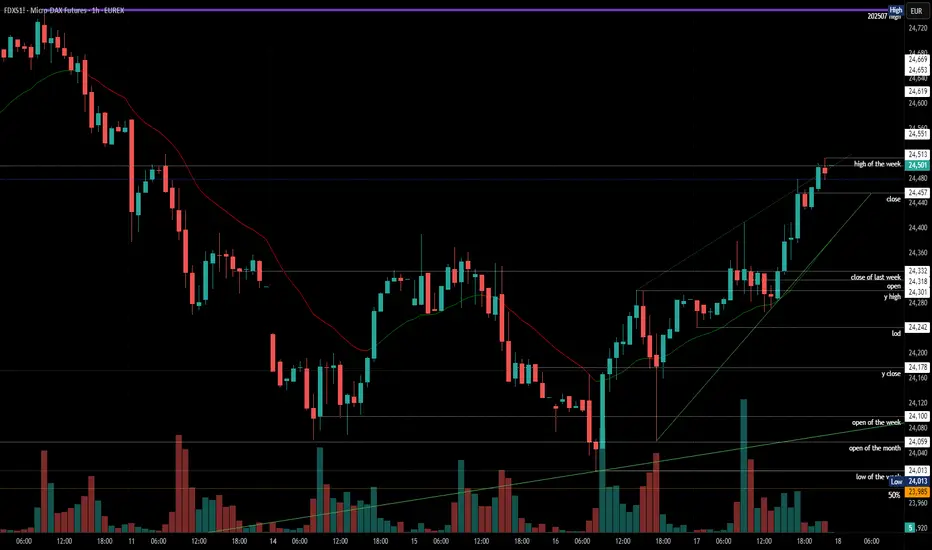
2025-07-17 - priceactiontds - daily update - daxGood Evening and I hope you are well.
comment: Selling down from 24400 to 24300 on high volume and the bears just gave up and market showed where it really wants to go. Almost without resistance we just grinded higher for 24500. No more obvious resistance until ath.
current market cycle: bull trend
key levels: 24000 - 25000
bull case: Bulls want to leave the big gap open down to 24350 and go higher from here. 24750 is the obvious target but if bulls want it, there is no reason we can not print 25000. Any pullback should stay above 24350 or this rally is over again. Will be looking for longs against 1h 20ema tomorrow, unless bears clearly took over.
Invalidation is below 24350.
bear case: Bears tried down to 24275 but failed at the 1h 20ema and I doubt many will try to keep this a lower high below 24750. Bears have absolutely nothing once again. Nothing bearish about this on any time frame.
Invalidation is above 25100.
short term: Bullish. What could stop this? Only If they fire Jpow tomorrow but I doubt they will do it before markets close. Can only expect higher prices but I would not hold anything over the weekend. Make no mistake, if orange face fires Jpow, bonds will go apefeces and stonkz as well.
medium-long term from 2025-06-29: Bull surprise last week but my targets for the second half of 2025 remain the same. I still expect at least 21000 to get hit again this year. As of now, bulls are favored until we drop below 23000
trade of the day: Long 24300 because Globex low was 24242 and market clearly found no acceptance below the 1h 20ema.
Futures market
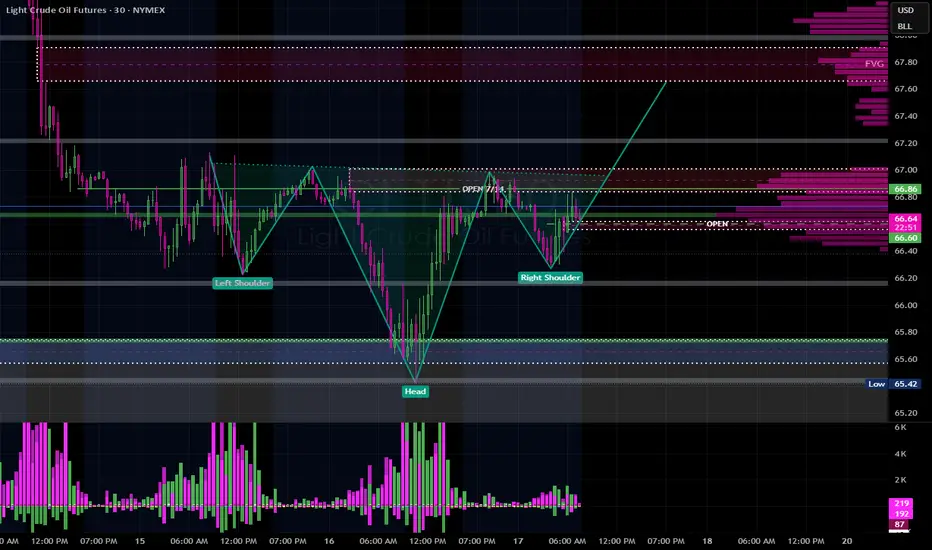
HEAD & SHOULDERSLooks like a nice H&S pattern forming, looking to get in around open price to the upside, for it to break past 67.00 to reach 67.66-67.90.
18/7/25 Weekly Candlestick To Close Near Its High or Tail Above?
Thursday’s candlestick (Jul 17) was a doji bar with a long tail above.
In our last report, we said traders would see if the bulls could create a follow-through bull bar testing the July 14 high, or if the market would form a lower high (versus July 14) and be followed by some selling pressure instead.
The market traded above Wednesday's high, but the follow-through buying was limited.
The bulls got another leg up to form the wedge pattern (Jul 3, Jul 9, and Jul 18).
They want a retest of the July 14 high, followed by a breakout above the bar trend line. They got it in Thursday night's session.
The bulls need to create sustained follow-through buying above the bear trend line to increase the odds of a sustained move.
The bears want a higher high major trend reversal and a reversal from a large wedge pattern (May 15, Jun 20, and Jul 18). They want a major lower high vs the April high.
They hope the bear trend line will act as resistance. They want the market to reverse below the bear trend line and the July 14 high within 5 trading days.
The bears were unable to create follow-through selling in the last few pullbacks (July 7, July 11, and July 15), which indicates they are not yet as strong as they had hoped to be.
They must create strong bear bars to show they are back in control.
Production for July is expected to be around the same level as June or slightly higher.
Refineries' appetite to buy looks decent recently.
Export: Down 6% in the first 15 days.
So far, the bulls created a breakout above the 8-day small trading range in Thursday night's session.
Traders will see if the bulls can create follow-through buying tomorrow. If they do, the weekly candlestick will close near its high, which will increase the odds of next week trading at least a little higher.
For tomorrow (Friday, Jul 18), traders will see if the bulls can close the day's candlestick near its high.
Or will the daily candlestick close with a long tail above or below the middle of its range instead?
Andrew
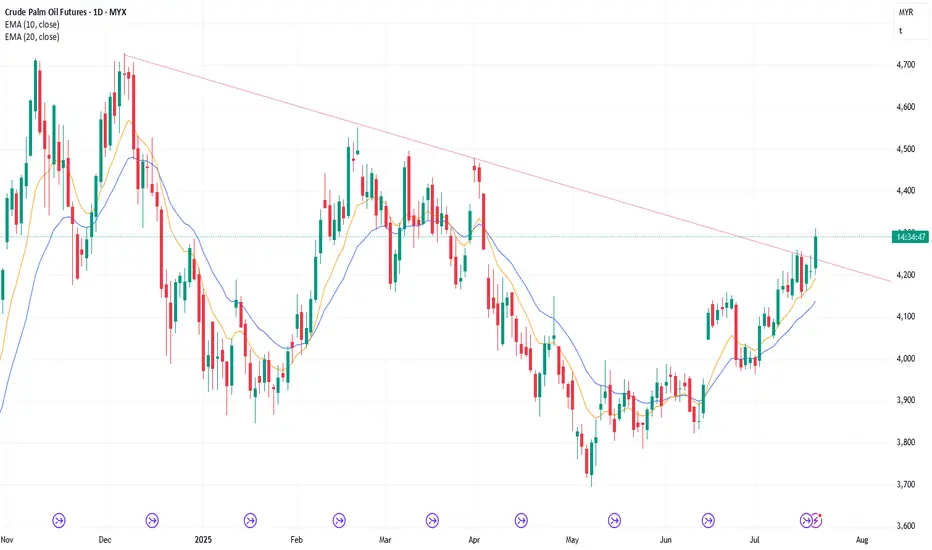
Gold Analysis – Why I’m Targeting $4,085Friday July 18 2025. Malaysia, Kuala Lumpur - Gold analysis done by Zezu Zaza to see the potential upcoming upside starting today this Friday.
I am using a CCT (Chrono Conditioned Trading) technique for my trading based analysis with mathematical strategy in the Xauusd pricing. We will cover the technical, fundamental and sentiment aspect as these are the three components pillars in trading before making any decision and movement trend.
1. Technical Setup (Daily Chart)
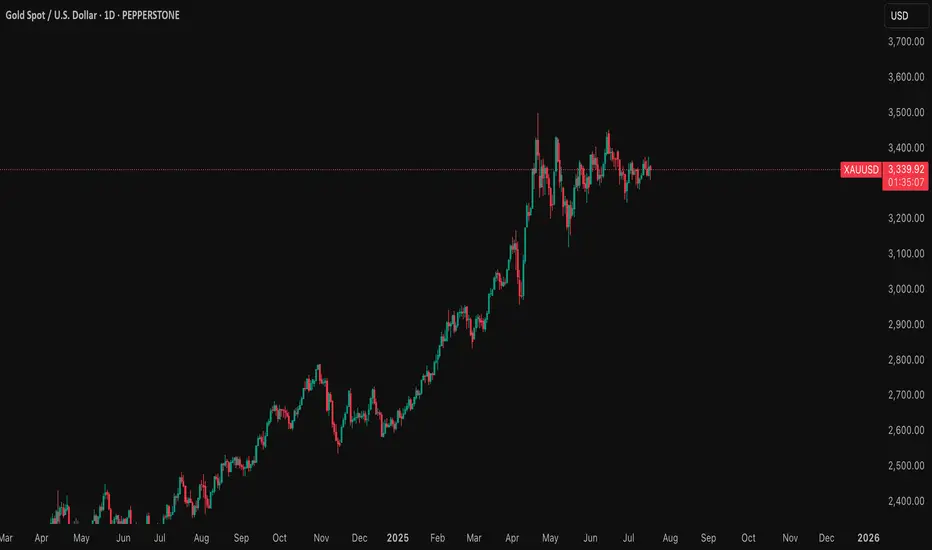
Gold is currently consolidating between the $3,300 to $3,375 range after a strong rally earlier this year.
The RSI sits near the neutral 50 level, while the MACD shows signs of a potential bullish crossover.
A confirmed breakout above the $3,375 to $3,400 resistance zone may lead to a surge toward $3,600 to $3,650, and possibly much higher.
Market structure remains bullish, with higher lows forming a solid base around $3,300.
2. Federal Reserve Outlook – 2025 Rate Cuts Expected
The market is now pricing in at least two interest rate cuts from the Federal Reserve by the end of 2025. A 25 basis point cut is expected in September, with another potentially coming in December. Recent CPI and PPI data indicate cooling inflation, giving the Fed more room to ease without reigniting price pressure. Labor market strength is weakening, wage growth is decelerating, and tighter credit conditions are emerging. Fed Chair Jerome Powell recently stated that the risks of over-tightening are now balanced, signaling a shift to a more dovish stance. Lower interest rates reduce bond yields and weaken the dollar, which historically fuels gold’s bullish momentum. If trump fired or Powell decision to step down, this will fire the gold even higher for the catalyze.
3. Market Sentiment (Speculative Positioning)
As of July 11, 2025, the latest CFTC Commitment of Traders report shows speculative net long positions on gold have surged to 203,000 contracts, the highest level in several months.
This signals a strong bullish sentiment among hedge funds and large traders.
In addition, gold ETFs saw over $38 billion in inflows in the first half of 2025, highlighting strong institutional demand as investors seek safety in uncertain times.
The positioning supports further upside as traders bet on a softer dollar and increased market volatility.
4. Macro Fundamentals and Hedge Fund Sentiment
Central banks around the world, especially in the BRICS nations, continue to increase their gold reserves in efforts to reduce reliance on the US dollar.
China has been actively accumulating gold for more than eight consecutive months, with unofficial estimates suggesting holdings of up to 5,000 metric tons.
Several hedge funds and institutional managers now classify gold as a core asset class due to rising fiscal uncertainty, geopolitical risk, and the deterioration of confidence in monetary policy. David Einhorn of Greenlight Capital emphasized that gold is not just about inflation but about the credibility of monetary and fiscal policies. His fund maintains a long gold position and expects higher prices as global deficits and structural imbalances persist.
5. Institutional Forecasts and Speculator Targets
Goldman Sachs has raised its end-of-2025 target to the $3,700 to $3,950 range, citing rising ETF inflows and a softer Fed stance. JPMorgan expects gold to average around $3,675 in the fourth quarter of 2025. Citi, in a bull case scenario, believes gold could trade well above $3,300. The World Gold Council has outlined a high-conviction scenario in which gold could reach $4,000 within the next six to nine months, driven by stagflation and global monetary instability. Greenlight Capital is reportedly aiming for the $3,500 to $3,800 range, though David Einhorn noted that he does not want prices to rise excessively too quickly.
Target Price: $4,085 first before turn the bullish sooners to $5000 price make this same year.
My target of $4,085 is supported by the convergence of multiple factors:
- A bullish technical structure with a potential breakout
- Fed interest rate cuts reducing yields and weakening the dollar. Fed will reduce the rates for the first time this year (12 more days) after this article is published today 18 July 2025.
- Strong speculative positioning and ETF demand
- Aggressive central bank accumulation
- Hedge fund sentiment aligned with rising gold exposure
- Persistent geopolitical and macroeconomic uncertainty
If these conditions hold, $4,085 is a realistic medium-term objective within six to nine months.
Trading Plan Summary
Component Strategy
Entry Zone Breakout above $3,375
Stop Loss $3,300 to $3,320 (below key support)
Take Profit Partial at $3,600 to $3,650, trail remainder to $4,085
Risk Triggers Dollar strength, unexpected Fed hawkish turn, resolution in geopolitics
Key Catalysts CPI done, PPI done, FOMC statements, nonfarm payrolls, war developments
Final Takeaway
This gold analysis blends a bullish technical pattern with the macroeconomic backdrop of an approaching Fed pivot, rising speculative positioning, and ongoing central bank purchases.
Hedge funds and institutions are increasingly viewing gold as an essential defensive asset, especially in the face of deteriorating fiscal credibility and geopolitical tensions.
If gold breaks and holds above the $3,375 level, the path toward $4,085 becomes significantly more probable.
18 July 2025 Friday is a starter ignition trend will born today. I will place some test lots today and will accumulate after from time to time.
Let me know if you what is your opinion or send email to me to reach me for the insitutional analyst or want to see live trade.
Regards,
Zezu Zaza
2048
xau longlong for daily movement around 3450 but can be higher, #only analysis, mind your risk
#only analysis who start a journey

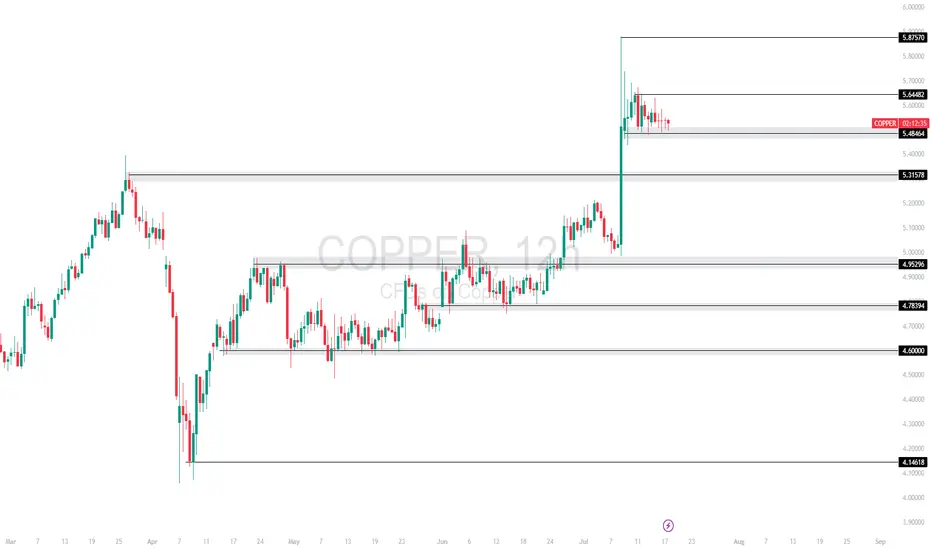
COPPER TECHNICAL ANALYSISCopper spiked into 5.8750 but is now consolidating just below short-term resistance at 5.6448, showing signs of a bullish continuation pattern. Price remains supported at the 5.4864 zone.
Currently trading at 5.4864, with
Support at: 5.4864 / 5.3157 / 4.9929 🔽
Resistance at: 5.6448 / 5.8750 🔼
🔎 Bias:
🔼 Bullish: Break above 5.6448 could push price toward 5.8750 and beyond.
🔽 Bearish: Loss of 5.4864 may trigger downside toward 5.3157.
📛 Disclaimer: This is not financial advice. Trade at your own risk.
This is my main template for Futures and ForexThis is my main template for Futures and Forex! It is optimized specially for the strategy "Momentum Mastery".
It includes all the necessary tools and indicators needed for the strat.
All setings are READY!!!
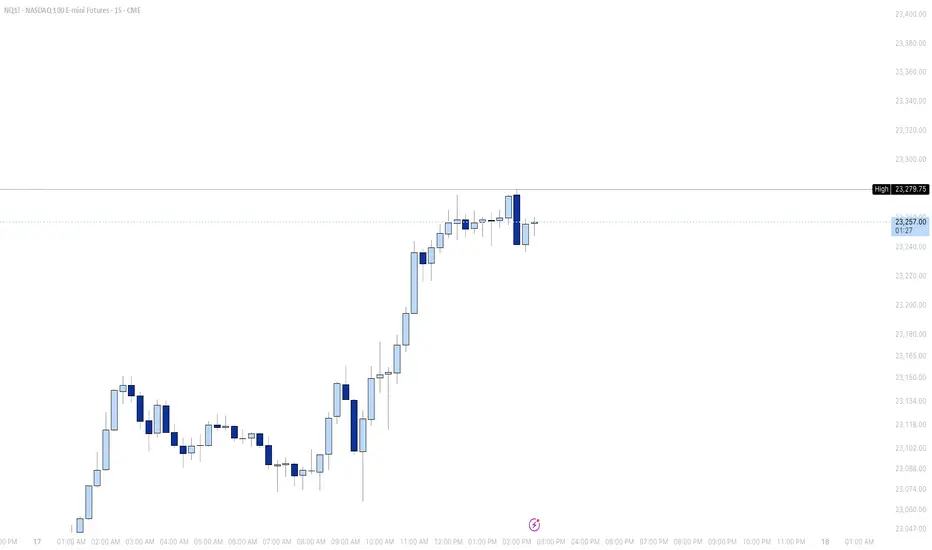
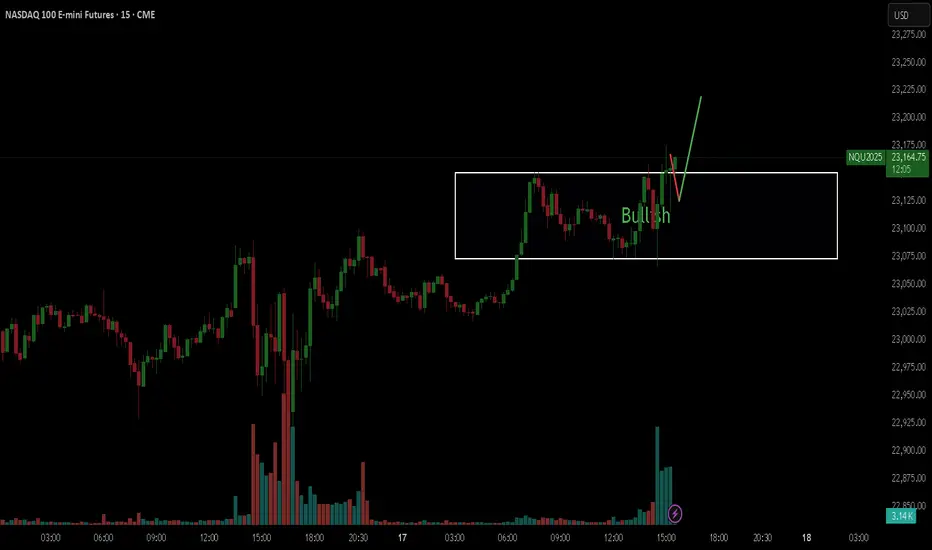
$NQ Supply and Demand Zones - All Time High! 7/17/25This chart is for SEED_ALEXDRAYM_SHORTINTEREST2:NQ only.
We recently hit ATH this AM session and now price is accumulating and we are waiting to see what it wants to do next. Continue to hold support at ATH before we breakout higher, or break below and close below ATH support for a retest lower?

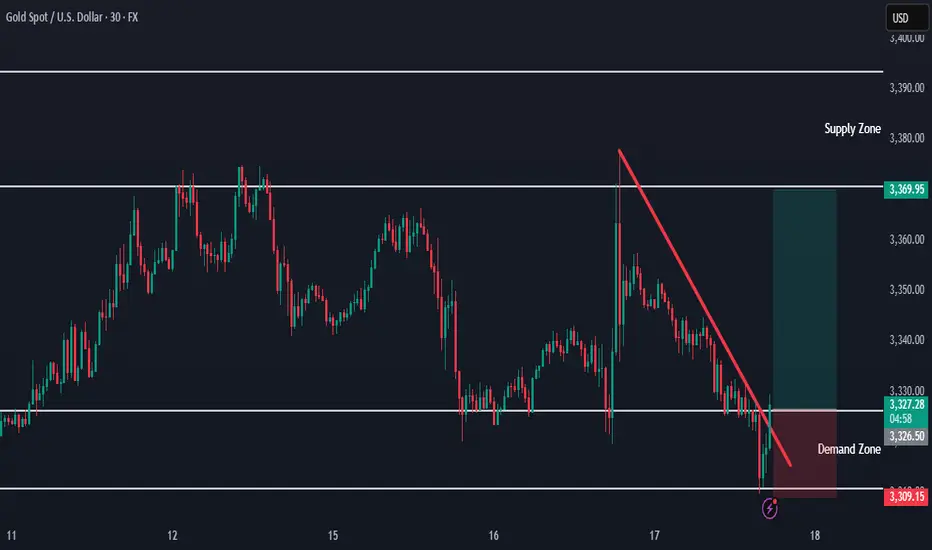
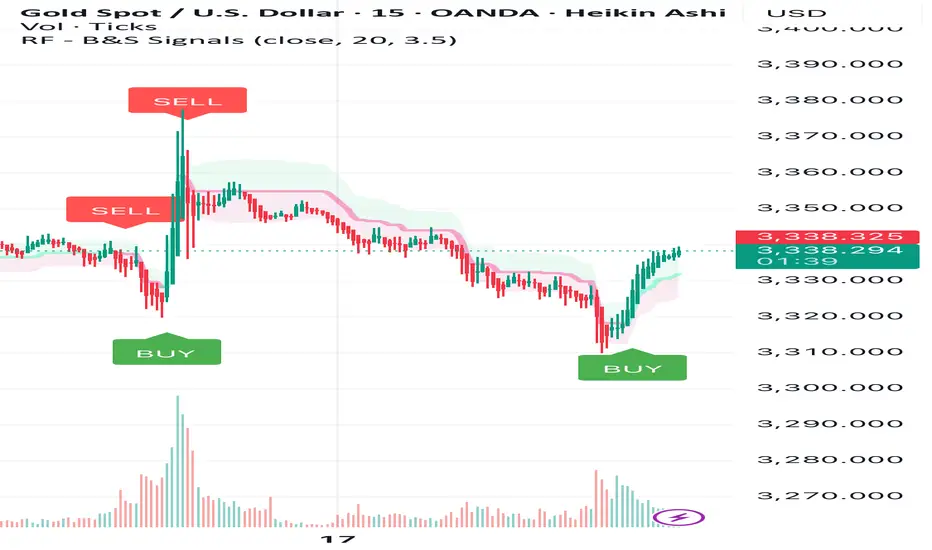
Re-attempt to buy?Trade Journal Entry – XAUUSD (Gold Spot)
Date: July 17, 2025
Platform: TradingView (Demo Account)
Timeframe: 1H/4H
Direction: Long Bias
Status: Stopped Out – Awaiting New Setup
Result of Last Trade: +£33
New Plan: Wait for buy opportunity in Asian or London session
Previous Trade Outcome
Entry was valid at POI based on bullish setup logic.
Trade failed to break structure to the upside convincingly.
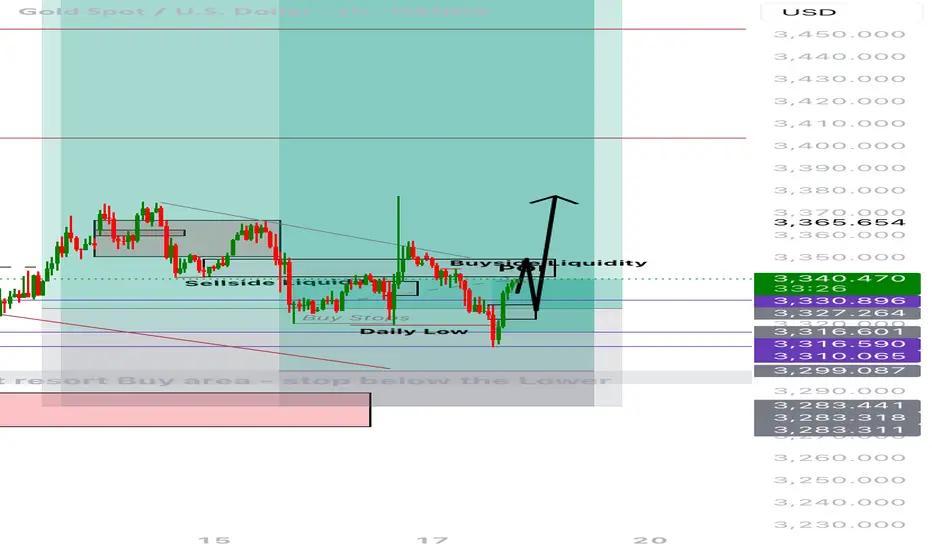
Stop-out occurred after price pushed below mitigation zone (~3,316).
However, due to early partials and trade management, the result was a net profit of £33.
Updated Outlook
Price has rebounded aggressively from just below Daily Low.
Current price near 3,339.305 — strong push back into prior structure.
Buyside liquidity and POI overhead acting as short-term magnet.
Ideal pathing (marked with black arrows):
→ Sweep POI
→ Retest structure (likely near 3,327–3,330)
→ Continuation toward 3,365+, targeting liquidity void above.
Entry Plan
Await price to revisit POI, potentially after liquidity run.
Ideal confirmation setup:
- SFP or bullish engulfing on M15–H1
- Volume divergence or re-accumulation pattern
Target entry during Asian or early London session when liquidity is typically engineered.
Management Approach
- Keep risk tight on re-entry (0.5% max risk)
- SL below new HL formed during retest
- TP: 3,365 / extended 3,380–3,390 depending on session follow-through
- If no clean retest, skip trade — don’t chase
Emotional Reflection
Felt more in control than previous attempts. Took the stop like a professional.
No revenge trades — staying focused on structure and quality.
Grateful that proper risk management led to a small win despite being stopped out.
Reflection Questions
- Did I adjust my expectations quickly once structure failed?
- Am I giving the market enough space and time to form clean entries?
- Will I stay patient for session-specific setups?
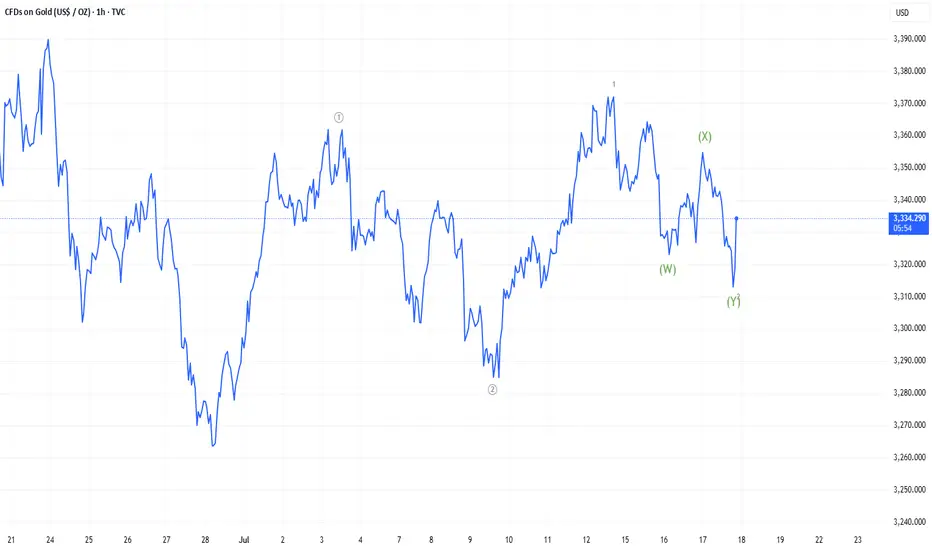
Nat Gas spotMade Bearish butterfly and Bearish dragon too but only presenting butterfly and also appear end of wave X as 81% retracement form one previous top also completed. let see

XAUUSD 🔹 Lower Purple Zone (Support Area) – Price ne is zone (approx. 3315–3320) se strong bullish reversal dikhaya hai. Yeh area buyers ka interest zone hai jahan se market ne reaction diya.
🔹 Upper Purple Zone (Resistance Area) – 3360–3375 ka zone strong resistance hai jahan se pehle bhi multiple rejections aayi hain.
🔹 Current Price: 3340.115 par trade kar raha hai.
🔹 Blue Arrow Prediction: Chart ka analysis yeh batata hai ke price ab is support zone se upar ki taraf move karega aur resistance zone ko test karega (target 3360–3375).

The range breakthrough is waiting for CPI to take effectIn the early stage, it was mainly volatile, and the lowest level in the morning reached 3334, which was also the position we went long last night. Today, we continue to focus on the 3340-45 line and go long, focusing on the release of CPI data. If CPI rises as expected, it means that inflation is rising, and the Fed's annual interest rate cut expectations will be further reduced, and gold prices may be under pressure to fall again; on the contrary, if CPI is lower than expected or even performs well, it means that Trump's tariff war has not had such a big impact on the market, and the Fed's interest rate cut expectations have increased significantly. After breaking through 3375, gold prices may accelerate to rebound to 3385-90 or even 3400. We focus on the release of data. If your current gold operation is not ideal, I hope I can help you avoid detours in your investment. Welcome to communicate with us!
From the 4-hour analysis, the bullish strong dividing line below is 3325-30. Below, we pay attention to the short-term support of 3340-45. The daily level stabilizes at this position and continues to maintain the bullish rhythm of stepping back and falling. The short-term pressure focuses on the vicinity of 3370-75. The overall high-altitude low-multiple cycle participation in this range remains unchanged. I will prompt the specific operation strategy in the link, so please pay attention to it in time.
Gold operation strategy:
1. Go long when gold falls back to 3340-45, and add more when it falls back to 3325-30. Stop loss 3317, target 3365-70, and continue to hold if it breaks;

Diving through support, gold's downward space opens up!Gold reached a high of 3366. Although it broke through slightly, it failed to form an effective breakthrough and was only a false break. Subsequently, the bears led the market to continue to decline, breaking the key support of 3330 to 3320 at the end. The daily line closed with a medium-sized Yin line, directly breaking the short-term moving average support, ending the previous three-day positive trend. After the single Yin retreat, the upward trend failed to continue, and the risk of technical pattern reversal increased. The bears chose to break down, indicating that the market may fall further. The first test below is the support of the previous starting point of 3300. If this position is lost, the bearish target will point to the area near the previous low of 3270. The current market atmosphere is bearish, and the key pressure above has moved down to the 3340 line. It is expected that the rebound will be difficult to reach.
In terms of operation strategy: It is recommended that if gold rebounds first, it can be considered to continue to short near 3336-3338, stop loss 3347, and the target is 3310-3300 and below, and strictly stop loss to control risks. The overall bearish view is maintained.

Gold Trading Strategy | July 17-18✅Gold prices dropped sharply to around 3310 following the release of key economic data, which also aligns with a daily chart support level. The price then rebounded quickly, reclaiming the 3320 support area. In the late session, focus shifts to the 3340–3345 short-term resistance zone. If gold fails to break through this region, the daily structure is likely to remain in a high-level consolidation phase.
✅ With the U.S. Dollar Index currently at a relatively high level, there is short-term pressure for a technical pullback, which may offer room for a gold price rebound within the range. Overall, gold remains in a range-bound pattern, favoring selling near resistance and buying near support. Trading decisions should be made cautiously, factoring in fundamental developments.
🔴 Key Resistance Levels: 3340–3345 / 3375–3380
🟢 Key Support Levels: 3300–3305 / 3310–3320
✅ Trading Strategy Reference:
🔰 If the price pulls back to the 3316–3320 zone and shows signs of stabilization, consider entering a light long position; The initial target is 3340–3345. If this level is breached, consider holding for a move toward the 3375–3380.
🔰 If the gold price encounters resistance in the 3340-3345 area, short-term short orders can be arranged, and the target can be seen around 3320-3310
🔥Trading Reminder: Trading strategies are time-sensitive, and market conditions can change rapidly. Please adjust your trading plan based on real-time market conditions. If you have any questions or need one-on-one guidance, feel free to contact me🤝

Gold trading idea Gold is still supported by 3300-3310.
Before it completely falls below 3300, gold is likely to consolidate around 3300-3340.
So in the short term, you can sell high and buy low around 3340-3310.
SELL XAUUSDXAUUSD. We can expect a reversal to double test the support before the highly anticipated rally. Sell 3339 and take profit at 3312. Let us see how things unfold.

Lord MEDZ Trading Update: BitcoinKey Observations:
Breach of the 60-Day Lookback Zone:
Price has fallen below the previously held demand zone, confirming seller dominance.
This breakdown increases the probability of a deeper retracement toward key Fibonacci and smart money interest levels.
Potential Demand Zones & Fibonacci Levels:
$82,280 - $75,355: This is the first major support area (0.5-0.618 retracement), where we may see a reaction.
$75,000 - $67,500: If weakness persists, price could fill the deeper liquidity void toward the 0.75 retracement level.
Final Support: $57,205 - $54,640: This remains the ultimate level where a full mean reversion move could play out.
Liquidity Hunt & Smart Money Context:
The market is likely sweeping liquidity, trapping late longs before a potential reversal.
Order blocks and imbalance zones suggest that institutional players could step in at lower levels.
Bearish Case: Deeper Drop Incoming?
If GETTEX:82K fails, a move to $75K or even FWB:67K is likely.
Further breakdowns could lead to a full sweep into the $57K region, which aligns with historical liquidity pools.
Bullish Reversal Scenario
If buyers aggressively defend GETTEX:82K -$75K, we could see a strong rebound back toward $90K+.
Any reclaim above the 60-day lookback level (~$90K- GETTEX:92K ) would invalidate the bearish breakdown.
Trading Plan:
Short-term: Watching price action around GETTEX:82K -$75K for a reaction.
Medium-term: If weakness persists, looking for deeper buy opportunities closer to $75K-$67K.
Invalidation: A strong daily close below $75K increases the likelihood of a drop to $57K.
Final Note: The breakdown below the 60-day lookback is a crucial shift in market sentiment. Patience is key—let the liquidity do its job before making aggressive moves.
Stay sharp & trade smart!
– Lord MEDZ

Oolong news stirs up gold market trend analysisWe decisively prompted support and arranged long orders near 3320. While the bottom stabilized, Trump suddenly released a smoke bomb, saying that he was considering whether to fire Fed Chairman Powell. The risk aversion sentiment exploded instantly, and gold soared in the short term, hitting the target of 3340-3345 in a few minutes, and the highest rose to 3377! But then Trump denied the relevant plan, and the risk aversion sentiment quickly cooled down. The gold price immediately fell from a high level, and the market returned to a volatile pattern. At present, the risk aversion drive has been falsified. In the short term, we need to focus on the trend opportunities after the high and fall. Considering that the news is still uncertain, it is recommended to wait and see first, and wait for the situation to become clearer before entering the market.
🔍Technical observation: The 1-hour chart of gold shows an obvious high and fall pattern, accompanied by a long upper shadow line closing. If there is no new risk aversion stimulus, the short-term momentum for another attack is limited.
📉Operational suggestions: Maintain the main idea of rebound short selling, pay attention to the short-term pressure in the 3365-3370 range, and choose to arrange short orders. ⚠️It should be noted that news has a great impact on the market. Transactions need to be executed decisively, but be careful not to be led by short-term fluctuations. Strict implementation of trading plans is the key.

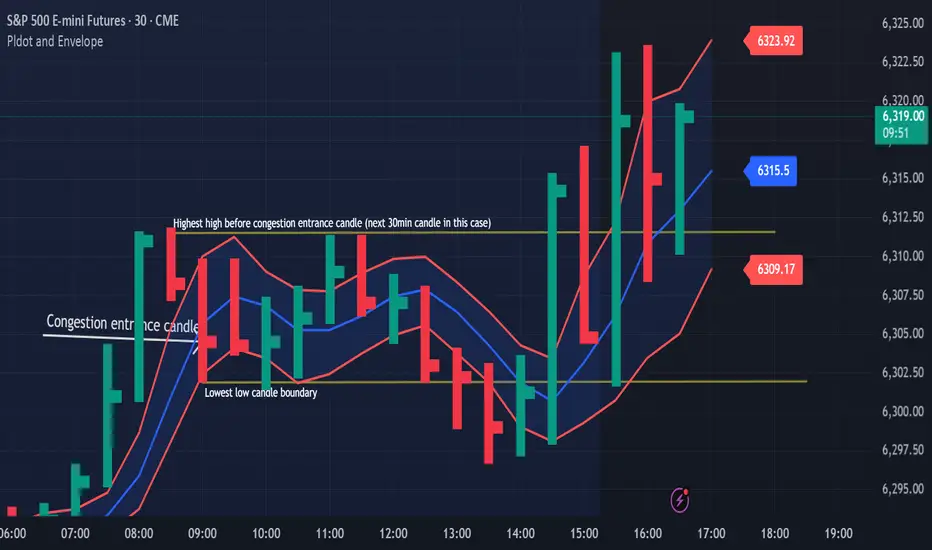
Congestion Action vs Congestion Exit – Mastering the TransitionWhen markets go quiet and churn sideways, it’s easy to get lost in the noise. But inside that congestion lies opportunity — if you understand the difference between "Congestion Action" and "Congestion Exit." Here’s how to apply Drummond Geometry to trade these phases with precision:
🔹 Congestion Action
Congestion action is when the market is not ready to trend — it's swinging back and forth within a defined range, between a strong block level and a well-established dotted line. Think of it as a "resting zone" before the next directional move.
📏 Original Confines: Highest high and lowest low after a congestion entrance as shown on the chart
🚧 Expanded Confines: Price temporarily breaks out of the range but doesn’t establish a trend (3 closes on the came side of the PLdot (blue line)).
🧲 This is where scalpers and range traders thrive. Look for setups near envelope confines and use nearby energy fields.
✅ Trade Plan: Play the range — buy support, sell resistance — until proven otherwise.
🔸 Congestion Exit
This is when the market transitions from ranging to trending — a trend run begins from within the congestion zone.
🚀 First bar of a new trend closes outside the congestion confines (either the block level (highest high on the chart) or the dotted line (the low on the chart)).
📊 The next bar must confirm with a trend run close — if not, it’s a failed breakout. You can see on the chart that price tried to trend lower but the trend was not confirmed!
⚡ Patterns to watch:
Energy pushing in the direction of the exit (PL Dot push, c-wave continuation).
6-1 lines against the breakout direction disappear.(Not visible in this version)
Resistance/support against the exit breaks.
✅ Trade Plan: Enter on breakout confirmation, not just the breakout bar. Measure energy and watch the follow-through.
🧭 Tip:
Don't get faked out. If price re-enters congestion after a breakout, re-draw the boundaries — the old congestion is no longer valid.
🔥 Bottom Line:
Congestion Action is where the market breathes. Congestion Exit is where it moves. Mastering the handoff between the two gives you a decisive edge.
Gold Buy SetupTrade Plan:
Entry: On retracement back into the OB + BB/FVG zone.
Stop Loss: Below the OB/FVG structure.
Target: Projected using the orange arrow — targeting a break of recent highs and potential continuation toward premium levels.

Gold Holding Demand — New Buy Setup FormingThe demand zone on the higher timeframe is still holding, and price is starting to move higher.
A new buy opportunity is forming upon the break of the downward trendline.