gold analyse*The content on this analysis is subject to change at any time without notice, and is provided for the sole purpose of assisting traders to make independent investment decisions.
Futures market
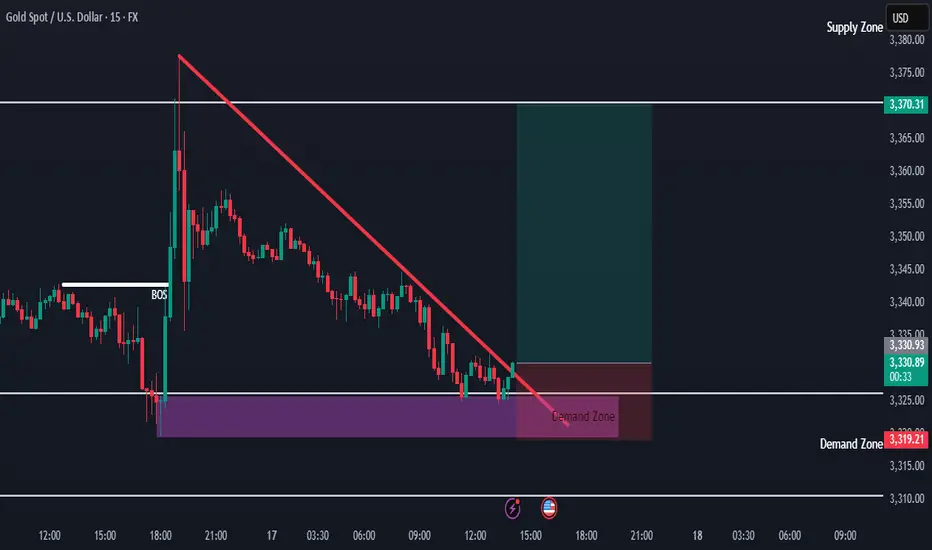
XAUUSD 4H Analysis – ICT-Based Setup🔹 XAUUSD 4H Analysis – ICT-Based Setup
A Trendline Liquidity has been engineered.
A Market Structure Shift (MSS) confirms a bearish bias.
A 4H Order Block (OB) formed after the MSS.
However, the OB looks weak due to clear Sell-Side Liquidity (SSL) resting below it.
A corrective retracement into the OB is expected (possible IDM pattern), then continuation lower.
If the OB breaks, it may turn into a Breaker Block (BB) or Mitigation Block (MTG).
Target: lower Sell-Side Liquidity (SSL) zones.
Entry confirmation is required on the 15-minute timeframe (using tools like SMT, FVG, RB, etc.).
#ICT #SmartMoney #OrderBlock

The next 1-3 hours are very important for gold.Gold has reached an attractive base of demand prz on the 1-hour time frame, current candles and liquidity are very important

Gold data stimulates flash crash, shorts break 3300?
Market review: Risk aversion changes instantly, gold price rises and falls
Yesterday, the gold market experienced dramatic fluctuations again. First, it fell to around 3320 due to the pressure of the strengthening of the US dollar, and then it soared by 50 US dollars to 3377 in the short term due to the rumor that "Trump may fire Powell", but the gains were given back after the news was clarified, and finally closed at around 3347. The daily line closed positive but failed to break through the key resistance.
In the early Asian session today, the gold price fluctuated narrowly around 3346, and the market traded cautiously. The US retail sales and initial jobless claims data were strong, the US dollar index rose in the short term, the US Treasury yield rose, and gold fell under pressure to below 3320. However, the market still has differences on the Fed's policy, and the downward space of gold prices may be limited.
Technical analysis: The shock has not been broken, and high selling and low buying are still the main theme
1. Daily level: The range shock continues
Key range: 3320-3375, three times of probing 3375 but not breaking, two times of testing 3320 to get support, showing that the long and short tug-of-war is fierce.
Indicator signal: KDJ is blunted, MACD is glued, MA5-MA10 is golden cross but the momentum is insufficient, and it is difficult to form a unilateral trend in the short term.
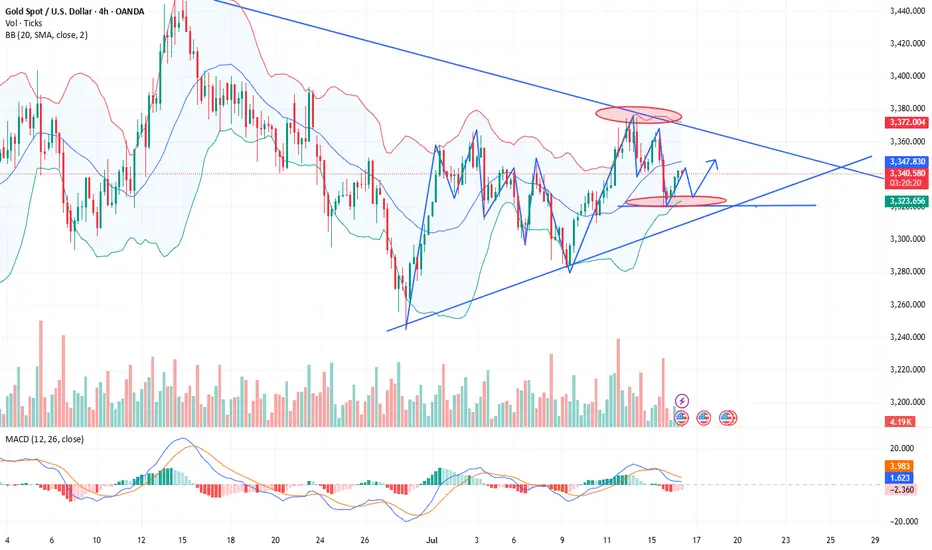
2. 4-hour level: Short-term correction pressure increases
MACD dead cross, KDJ turns downward, indicating that there is still a short-term correction demand, and the support below focuses on 3320 (the lower track of the Bollinger band). If it falls below, it may test 3300-3285.
The upper resistance is 3358-3377. If it breaks through, it may test the 3400 mark, but be wary of the risk of high-rise decline.
Operation strategy: Buy low, don’t chase short
Short-term low-long: Try to buy with a light position when it falls back to 3310-3315, stop loss 3300, target 3340-3350.
High-altitude opportunity: If it rebounds to 3365-3370 and is under pressure, you can try short-selling, stop loss 3380, target 3350-3340.
Follow-up after breakout: If it unexpectedly falls below 3300, wait and see and wait for the support of 3280-3260 before considering buying low; if it breaks through 3400, it may open up upside space, but be wary of false breakthroughs.
Market sentiment and risk warning
Negative factors: The dollar is stronger, the US Treasury yields are rising, and the Fed’s expectations of rate cuts are cooling down.
Positive support: Geopolitical uncertainty, the risk of high valuations of US stocks, and the market’s sensitivity to economic data is still high.
Personal opinion: Although the data is bearish for gold in the short term, the market is still in a volatile pattern and it is not advisable to chase the short position. Conservative investors should wait for key support levels to buy low, or follow the trend after a breakthrough.
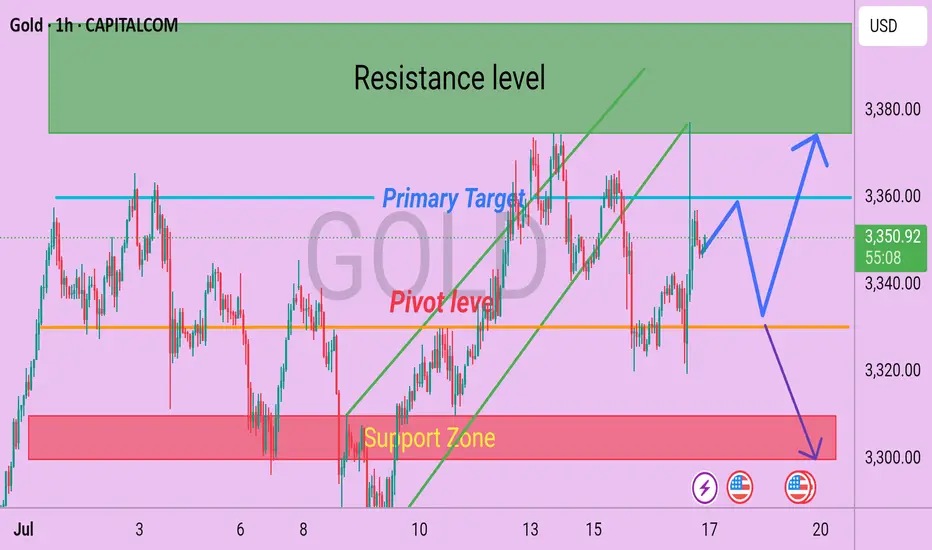
Gold Technical Outlook H1 Gold is currently consolidating within the 3345–3350 zone, showing signs of potential bullish movement in the short term. A sustained break and H4 candle close above 3355 could trigger bullish momentum towards 3360, followed by extended targets at 3375 and 3400, aligning with key resistance levels.
On the flip side, if the price faces rejection and an H4 candle closes below 3330, this could open the door for a bearish move, with potential targets at 3315 and 3300, which also act as critical support and pivot levels.
📌 Key Levels to Watch:
Immediate Resistance: 3355 / 3360
Major Resistance: 3375 / 3400
Immediate Support: 3330 / 3315
Major Support: 3300
🔎 Wait for confirmation on the H4 timeframe before entering positions. Always manage your risk accordingly.
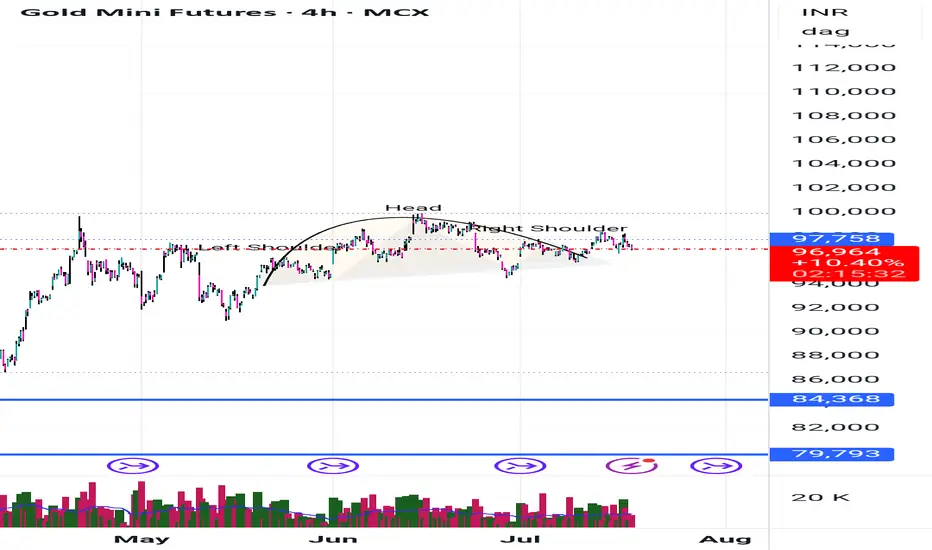
Gold might be possible can see a short side. A clear formation of Head and Shoulder, Cup and handle formation in 4 hourly chart
It might be possible that we can see a big short. THIS format is similar to nifty 50
Pre-Market Prep
Today, I'm narrowing down to six key markets. For the S&P, it's all about waiting for a pullback from the prior day's high or a breakout above the CVA. If it dips back inside the range, I'm ready to go short with some scalps.
For the NASDAQ, it's looking strong. I'm thinking about a long position if it pulls back to the prior day's high.
Gold is in a downtrend across all areas, and I'm already in a short position from the CVA low. I'm thinking about adding to that if it pulls back to the prior day's low.
Crude Oil is pretty balanced. I'm looking at the high of the CVA for a short opportunity if it gets there.
For the Yen and Euro, both are rotational. I'm eyeing long opportunities if they show some acceptance and pullbacks from key levels.
That's the vibe for today. Let's trade smart, avoid the chop, and keep it moving. Peace!

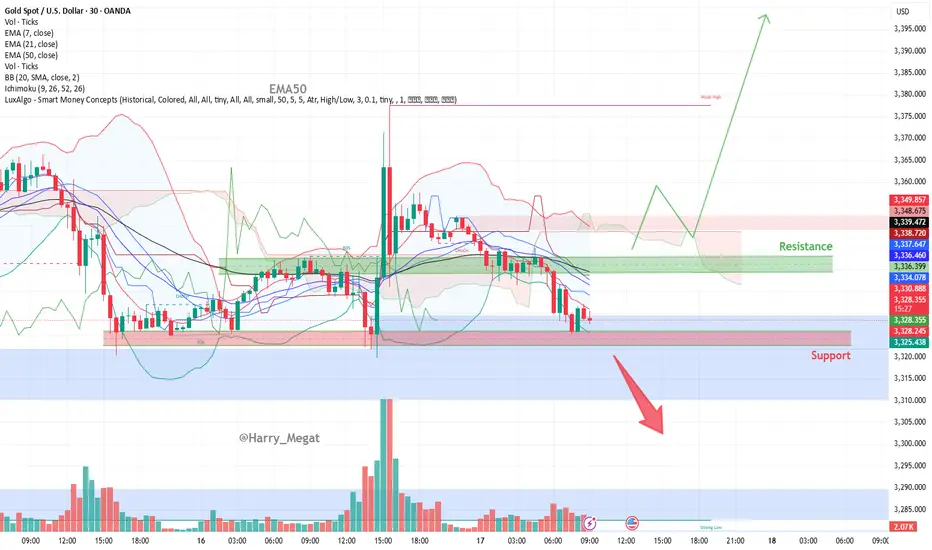
Gold (XAU/USD) Setup based on 30-minute chartGold (XAU/USD) Setup based on 30-minute chart
**Bullish Scenario**
* **Support Held**: Price is currently testing a key horizontal support zone (\~\$3,320–\$3,327), which has held multiple times in the past.
* **Potential Reversal**: If price forms a bullish candlestick pattern here (e.g., bullish engulfing, hammer), we may see a rebound.
* **Upside Target**:
* **First Resistance**: \$3,345–\$3,350 (green zone)
* **Further Target**: \$3,380–\$3,400 if momentum continues
**Confirmation Triggers**:
* Bullish price action from support zone
* Break above EMA 7 / EMA 21 (\~\$3,330–\$3,336)
* Increasing volume on green candles
**Bearish Scenario**
* **Breakdown Threat**: Price is hovering near support; if it breaks below \$3,320 with volume, downside pressure may intensify.
* **Next Support Levels**:
* \$3,310 (minor)
* \$3,285–\$3,275 (major support)
**Bearish Triggers**:
* Clear break and close below \$3,320
* EMA crossover (short-term below long-term)
* Rising red volume bars
Summary
| Direction | Conditions | Targets |
| ---------- | --------------------------------------------------- | ------------------------- |
| Bullish | Hold above \$3,320 + breakout above \$3,336 (EMA50) | \$3,350 → \$3,380–\$3,400 |
| Bearish | Break below \$3,320 support | \$3,310 → \$3,285 |
Gold Futures ($GC1!) — US Session Setup: Bearish Retest from 618🟡 Gold Futures ( COMEX:GC1! ) — US Session Setup: Bearish Retest from 0.618 Fib in Bullish Breakout Context
⏳ Pre-US Session Playbook
We're currently watching Gold Futures ( COMEX:GC1! ) for a potential short opportunity into the US session open. While the broader structure has broken bullish, we're anticipating a bearish retest scenario from a key Fibonacci level — aligning cleanly with last week’s breakout structure.
No positions have been taken yet — we are setting up for the US session — and are closely monitoring price action near the 0.618 retracement zone before committing.
📍 Setup Breakdown
• 0.618 Fib Retracement from the last bearish impulse aligns with:
○ Recent volume shelf resistance
○ Retest zone from prior breakout
○ An overextended local push into thin volume above 3380
• Bullish Context:
○ HTF breakout from descending wedge structure remains valid
○ Macro buyers still in control
○ Upside continuation risk is high if sellers don’t show up
• Short Bias Conditions:
○ Rejection or absorption in the 3385–3390 zone
○ Weak follow-through above 0.618 (failed breakout scenario)
○ Breakdown of LTF higher low structure post-test
🧠 Strategy Commentary
Although we’re in bullish breakout mode, this is a tactical short setup — a fade into prior structure with clear invalidation. We're not fighting trend, but looking to short into exhaustion at a defined level, with tight risk parameters.
Confluence Factors:
• 0.618 fib alignment
• VRVP volume shelf
• Prior breakout structure retest
• LTF divergence or absorption confirming the fade
🎯 Trade Parameters (Planned)
• Entry Zone: ~3385–3390
• Stop Loss: Tight, 3395–3400
• Target Zone: 3342–3337 (full structure retest)
📌 Patience is key — this remains a setup until confirmed. We'll post live if and when conditions are met.
Let the market come to you.

XAUUSD LONG 7/7/25Looking to target 3,450 price level. This is based on:
1. Price has been on a range since April 22 when the high was formed, the low of the move
that formed the high was taken out. Looking to aim to taking out the high.
2. On the weekly timeframe, last week took out the low of the week before and closed bullish
within the candle of the prior week. This provides a signal for a potential sweep of the high
of that week. Minimum 3,365 price level.

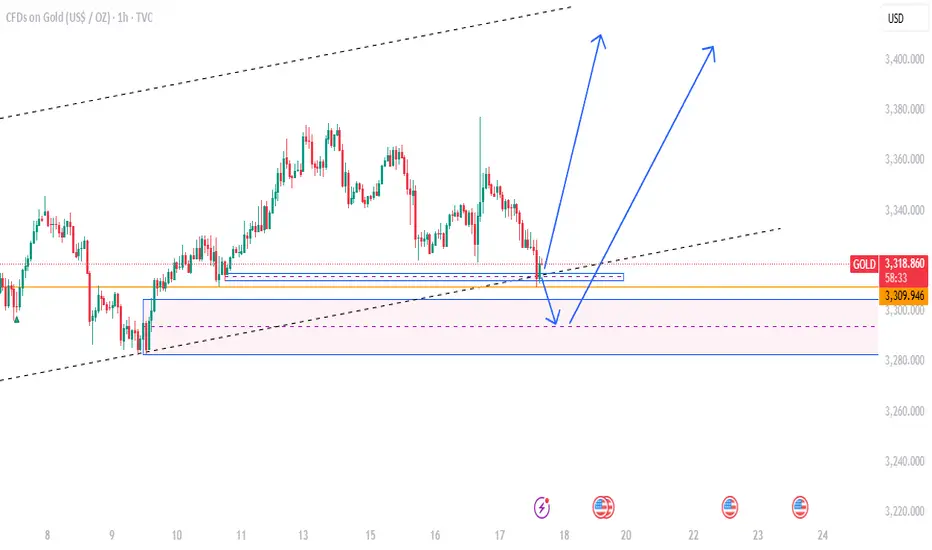
Gold Ranging Between HTF Zones — Buy Setup FormingHello everybody!
Price is fluctuating between two higher timeframe supply and demand areas.
The market structure on the lower timeframes changed yesterday, and now we’re watching to see if the newly formed small demand zone will hold.
The break of the downward trendline is our signal to enter a buy position.
Gold Setup. Midas losing his touch.TVC:GOLD has reached an all time high of $3500. It further created a LH @ $3435 in the daily TF. This signals the beginning of a possible down trend of the commodity with the current fundamentals as confluence.
Furthermore, TVC:GOLD is likely to reach level $3160 and possibly test levels as low as $2960, below the much acclaimed $3000 support structure.

Gold market price trend analysis and operation strategyGold trend analysis:
Gold reached a high of 3366 yesterday, a low of 3320, and closed at around 3325. From the daily chart, the performance of the daily cycle is high and closed negative, and it may not be able to go out of the big rise in the short term. Gold will fall into range fluctuations. The rise of gold in this cycle has not actually been completed. At least it needs to go to the high point of 3400, and then look at the adjustment space within the week, but don’t look too much at the strength of the rise. The general trend is bullish, and we must also beware of the adjustment space that may fall back at any time. Gold tried 3375 several times yesterday and failed to break through, and then fell back for adjustment, indicating that the pressure on 3375 is obvious, that is, gold needs to fall back and correct in the short term. At this time, we are cautious about chasing more and continue to buy more after falling back.
From the 4-hour chart, gold rose and fell yesterday, and the bearish trend did not continue. Gold entered a period of adjustment. From the current K-line, the downward momentum of gold is slowing down, and it tends to rebound in the short term. In the 4-hour chart, the lower track support of the Bollinger Band is near 3320, and the position of the middle track of the Bollinger Band is near 3345, which will form a short-term resistance. From the 1-hour chart, after yesterday's drop to 3320, it was strongly supported again and pulled up to above 3330. The support below is still strong. If the European session rises and breaks through 3350 today, the US session may go to the resistance of 3365-3375. Before breaking through 3350, the current market can only be regarded as a bottom adjustment and correction. Today, we will first focus on the rebound strength. If the upward momentum weakens, pay attention to the support of 3310-3300 below, and wait for the decline to be mainly low-multiple. In the short term, we will first focus on the breakthrough of the shock range. The intraday idea is to fall back to low-multiple. FX:XAUUSD ACTIVTRADES:GOLD OANDA:XAUUSD TVC:GOLD EIGHTCAP:XAUUSD ACTIVTRADES:GOLD
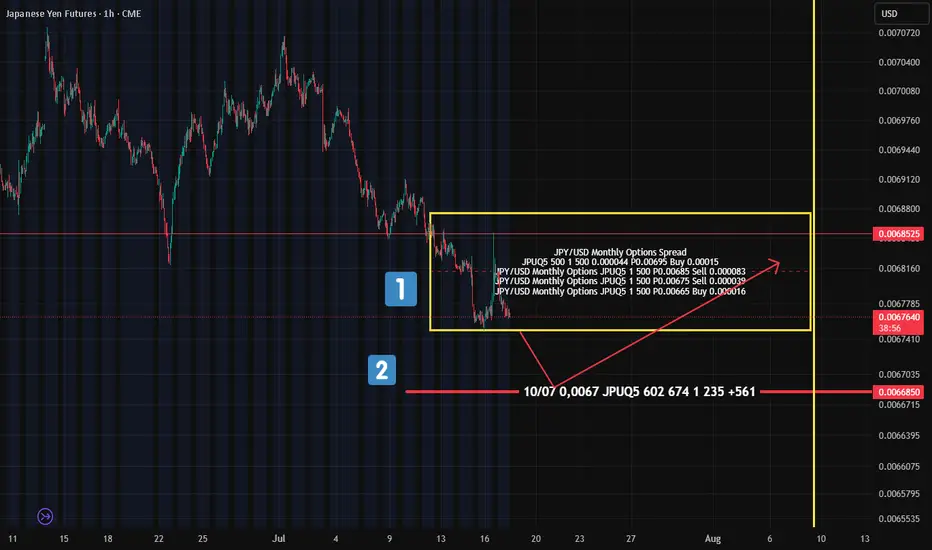
Yen Futures Options: What the "Put Condor" Tells Us About FutureA quick look at the options sentiment on Japanese Yen futures (not spot) — and there’s something interesting on the flow radar.
On July 10 , a "Put Condor" was placed — boundaries marked by the yellow rectangle on the chart (№1).
The goal of this setup? Price should expire within these boundaries — meaning the seller expects limited downside , but still allows for some controlled movement.
What’s notable?
This position was placed before the yen started to weaken — so someone was clearly preparing for this scenario in advance .
Also worth watching:
Further down (№2 on the chart), there’s another cluster of put options at 0.0067 — suggesting this level could act as a support zone if the futures contract drops that low.
📊 Bottom Line:
There are clear signs pointing to continued downside pressure in Yen futures.
The 0.006685 level is key — potential support for a bounce back into the 0.00675–0.00685 range .
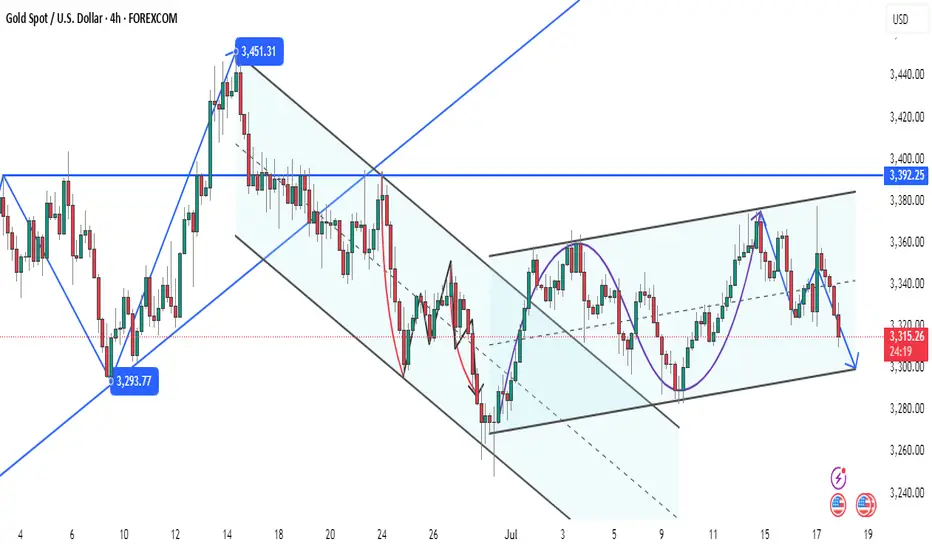
XAUUSD critical area, both sides are possiblecorrection waves are always complicated and messy often changes direction too often, goes up and down in a wide range either triangle, wedge or some sort of zigzag, internal waves usually goes as abc, wxy, wxyxz type of correction waves and it may seem like ended many times in the subwaves. so often confused with many other ideas. i believe correction continues yet criticals levles to watch 3307-3419 brake side will determen the future of gold.
my 3250 target already achieved but i expect another one, shor term targets 3250-3205 mid term targets 3119-3070-3050
daily candle body above 3420 invalidates short ideas.

Expectations On GoldPEPPERSTONE:XAUUSD Looking at the daily Range, The market has reached the equilibrium level, is that a sign to go short? no, we could still see a drive to the upper side, but ultimately, the relative equal lows which are close to 3,245.00 big figure should likely be the draw.
I would love to see a drive below the 3,282.00 mark for perfect show to prove the obvious move below the 3,245.00, or seeing a consecutive break below each previous days low would also confirm the directive.
Seeing higher prices would of course negate this analysis, seeing a run into the 3,375.00 big figure yesterday makes me skeptical as this has also left some area of relatively equal highs, so I would give in to the idea of higher prices at least to that level to see what would like occur, but I strongly doubt that this would be the scenerio.
Generally, I am bearish on Gold till I see a run below that 3,245.00 big figure or prices closer to that level.

Gold rebounded and shorted in the New York market.Trump's recent remarks about "possibly firing Fed Chairman Powell" triggered risk aversion in the market, and gold once surged to $3,377, but then Trump denied the plan and gold prices fell back to fluctuate in the 3,340-3,350 range; the U.S. PPI in June was flat month-on-month, lower than expected, easing market concerns about the Fed's immediate tightening of policy, but long-term inflation expectations still support gold; Israel's air strikes on Syria have exacerbated tensions in the Middle East, and safe-haven demand has boosted gold; Trump threatens to impose tariffs on the EU, and global trade uncertainty still supports gold's safe-haven properties; gold fluctuated and fell today. After yesterday's big rise, gold gradually fell today. Today, gold fluctuated weakly, and the 4-hour moving average crossed downward. The gold price gradually moved toward the lower Bollinger band, and the Bollinger band opened downward. The trend is more bearish. In terms of operation, we recommend that gold rebound and go short. FOREXCOM:XAUUSD ACTIVTRADES:GOLD FXOPEN:XAUUSD ACTIVTRADES:GOLD VANTAGE:XAUUSD CMCMARKETS:GOLD VANTAGE:XAUUSD
Gold prices remain in range
Market review
On Thursday (July 17) in the early Asian session, spot gold traded in a narrow range at $3346.50/ounce. The overnight market was dominated by news, and gold prices staged a "roller coaster" market: in the early New York market, it fell to an intraday low of $3319.58 due to the strengthening of the US dollar, and then soared by $50 to a three-week high of $3377.17 due to rumors that "Trump may fire Powell." As Trump refuted the rumors, gold prices gave up some of their gains and finally closed up 0.68% at $3347.38.
Technical analysis
Daily level
Range fluctuations: Prices continue to be limited to the $3320-3375 range, three times probing 3375 without breaking, and two times testing 3320 for support.
Indicator signal: KDJ is blunted, MACD double lines are glued together, and MA5-MA10 golden cross suggests a potential upward trend, but insufficient momentum restricts the unilateral market.
4-hour level
Short-term pressure: KDJ turns downward after golden cross, MACD dead cross continues, and the green kinetic energy column shows the need for callback.
Key position: Pay attention to the support of 3320 (lower track of Bollinger band) below, and look down to 3300-3285 if it breaks; the upper resistance is still 3375.
Operation suggestions
Strategy: Mainly low and long within the range, go long at 3320-3322 for the first time, stop loss at 3312, and target 3340-3350.
Risk warning: If it breaks through 3375 or breaks below 3320, be alert to the start of trend market.
XAU/USD – Long off Lower Channel + Fundamental Tailwind📌 Bias: Bullish (technical + macro alignment
🔹 Trade Setup
Entry Zone - 3 245 – 3 255
Stop-Loss - 3 240
TP1 - 3 375 (Last Month High)
TP2 - 3 475 (Upper Channel)
🧠 Technical Rationale
- Price is respecting a clean ascending channel
- Confluence at entry: lower trendline + last month’s low + hidden order block
- Liquidity sweep expected below 3 245 before bullish continuation
🌍 Fundamental Tailwinds (July 2025)
🏦 1. US Dollar Collapse
- The US Dollar Index (DXY) is down 10.8% YTD, its worst start since 1973
- Driven by:
- Trump’s erratic tariff policies and fiscal expansion
- Loss of confidence in US Treasuries as a safe haven
- Moody’s downgrade of US credit rating
“The dollar has transformed from a safe haven into a symbol of instability.” – ING strategist
🪙 2. Central Bank Gold Demand
- Global central banks continue accumulating gold to hedge against dollar devaluation
- This institutional demand underpins long-term bullish momentum
🔥 3. Geopolitical Risk Premium
- Ongoing tensions in the Middle East (Iran–Israel, Gaza) and Russia–Ukraine keep gold attractive as a safe-haven asset
- Even with temporary ceasefires, the risk premium remains embedded in price
📉 4. Fed Dovish Shift
- Fed Governor Waller signals a possible July rate cut, citing weak labor data and easing inflation
- Lower rates = weaker dollar = stronger gold
🧠 Final Thought
This setup isn’t just technically sound—it’s fundamentally explosive. You’re riding a macro wave of dollar weakness, geopolitical hedging, and central bank gold demand. If price reacts cleanly at 3 250, this could be your high-conviction entry of the month.

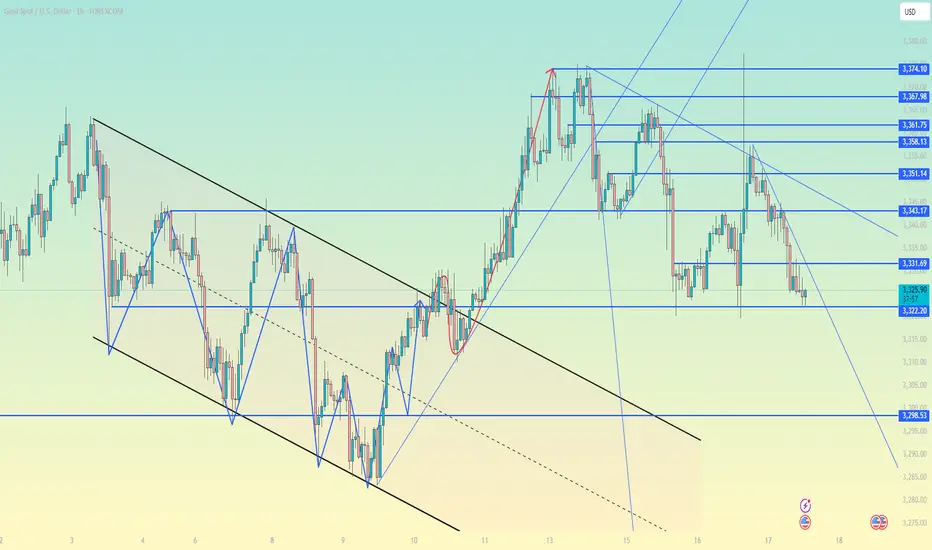
XAUUSD Bear Flag Breakdown Incoming? Watch 3322 Support Zone
🔴 Resistance Zones:
3,370–3,375: Strong supply zone (highlighted in orange). Price has been rejected multiple times here.
3,350–3,355: Minor resistance, also aligned with a descending trendline (shorter-term bearish structure).
🔵 Support Zones:
3,322–3,325: Currently holding above this key intraday demand zone.
3,316–3,318: Next major demand zone if current support breaks (highlighted in blue).
📉 Trend Structure:
Price is in a downtrend, making lower highs and lower lows.
Multiple bearish trendlines are intact.
Recent rejection from 3,370 zone with strong bearish momentum.
🔄 Current Price Behavior:
Price is consolidating near 3,324, testing the support zone.
If this support fails, next clean drop likely toward 3,316.
---
✅ Trade Signal for Today
Bias: Bearish (Short)
🔻 Entry (Sell):
Sell below 3,322 (on 15-min candle close below the blue zone)
🎯 Targets:
1. TP1: 3,318
2. TP2: 3,312
🛡️ Stop Loss:
SL: Above 3,332 (last minor structure high)
---
🔁 Alternative Buy Scenario (Aggressive Intraday Long)
Only valid if strong bullish engulfing forms above 3,325 support.
🔼 Buy above: 3,327 (confirmation candle)
TP1: 3,335
TP2: 3,345
SL: Below 3,321
⚠️ Note: This buy is counter-trend, so take with smaller size or avoid unless momentum shifts.
---
🧠 Summary
Main Play: Follow the bearish trend and wait for a clean break below 3,322.
Avoid buying unless you see strong demand reaction with volume from the current blue zone.

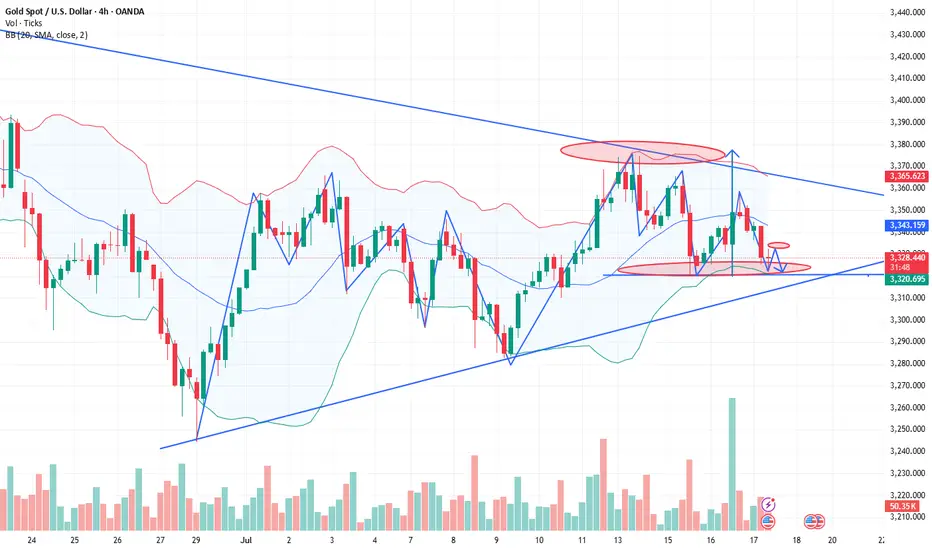
Gold Rejects Resistance Again – Gold Rejects Resistance Again ?Gold is currently trading near $3,335, showing signs of exhaustion after a failed breakout above the recent consolidation range. The market attempted to push higher but lacked strong momentum, leading to a pullback and possible shift in bias. The price is forming lower highs, indicating bearish pressure building up on the 4H timeframe. Gold is showing weakness after a second breakout followed by a possible retest failure. The market structure indicates a bearish bias
🔍 Market Structure Overview:
- Two Breakouts: Price attempted two bullish breakouts recently. The first breakout gained some traction, while the second failed to hold above resistance.
- Failed Retest: Price has now returned back near the previous breakout zone (~$3,332), signaling a potential bearish reversal pattern.
- The chart structure suggests a distribution phase, with price struggling to hold gains, and sellers slowly gaining control.
🧭 Key Support and Resistance Levels:
✅ Resistance Zones:
- $3,337.54 – Immediate resistance (recent rejection zone)
- $3,348.03 – Strong resistance if price pushes above $3,337
- $3,412.76 – Major resistance from previous swing high
- $3,490.40 – Long-term psychological resistance
🔻 Support Zones:
- $3,318.94 – Immediate support (just below current price)
- $3,303.46 – Key fib retracement (0.382 level)
- $3,248.28 – Strong horizontal support (major zone)
- $3,193.11 – Fibonacci extension level (-0.382)
- $3,159.02 – Next support zone (Fibo -0.618 level)
🟠 Current Bias:
Bearish to Neutral – as long as price remains below $3,337.
If price breaks and holds above $3,337 with volume, short-term bullish reversal is possible.
Yeterday there was a fake news and gold was pumped but after clarification it was dumped. It means buyers are not much interested till fed next meeting and the high price of the gold. Sellers will short the gold on every rise while buyers will wait for low price of the gold for long term trade.
Note
Please risk management in trading is a Key so use your money accordingly. If you like the idea then please like and boost. Thank you and Good Luck!

Gold Analysis and Trading Strategy | July 17✅ Fundamental Analysis
🔹Although President Trump denied plans to dismiss Federal Reserve Chairman Jerome Powell, he emphasized that he does “not rule out the possibility in the future” and criticized the Fed’s headquarters renovation for budget overruns. This added to policy uncertainty and strengthened gold’s appeal as a safe-haven asset.
🔹Market expectations for a rate cut in September have risen to 60%, which is supportive for gold.
🔹On the geopolitical front, Israel launched an airstrike on Damascus, the capital of Syria, hitting areas near the Ministry of Defense and the Presidential Palace. The escalation in Middle East tensions has driven safe-haven flows into the gold market.
✅ Technical Analysis
🔸So far this week, gold has shown a clear range-bound pattern. Despite various market influences, gold has been rejected three times near 3375 on the upside and found support twice near 3320 on the downside. This indicates a well-defined consolidation zone between 3375 and 3320.
🔸As long as this range remains intact, gold is unlikely to form a strong trending move. The market is expected to continue fluctuating within this zone through Thursday and Friday. Thus, the trading strategy remains focused on range trading — selling near resistance and buying near support.
🔸In the event of an unexpected breakout: A break above 3375 could open the path toward 3400. A breakdown below $3320 could trigger a move down to 3285. However, price extensions in either direction may be limited in scope.
🔴 Key Resistance Zone: 3365–3375
🟢 Key Support Zone: 3320–3315
✅ Trading Strategy Reference
🔺 Long Position Strategy:
🔰If gold finds support near 3325–3330, consider entering light long positions.
🔰Conservative traders may wait for a confirmed rebound from 3320 before entering.
🔰Target levels: 3340 → 3355 → 3375
🔻 Short Position Strategy:
🔰If gold rebounds and faces resistance within the 3365–3370 zone, consider initiating short positions based on price action signals.
🔰Suggested stop-loss: above 3378
🔰Target levels: 3325→ 3320→ 3310
🔥Trading Reminder: Trading strategies are time-sensitive, and market conditions can change rapidly. Please adjust your trading plan based on real-time market conditions. If you have any questions or need one-on-one guidance, feel free to contact me🤝

XAUUSD: Trade Idea TodayIf Gold breaks the orderblock at 3318, the the trend is SELLING. Target: 3311 and 3300.
If the Demand Zone is supported, (3318-24) Go for BUYS. Target: 3332 and 3342
