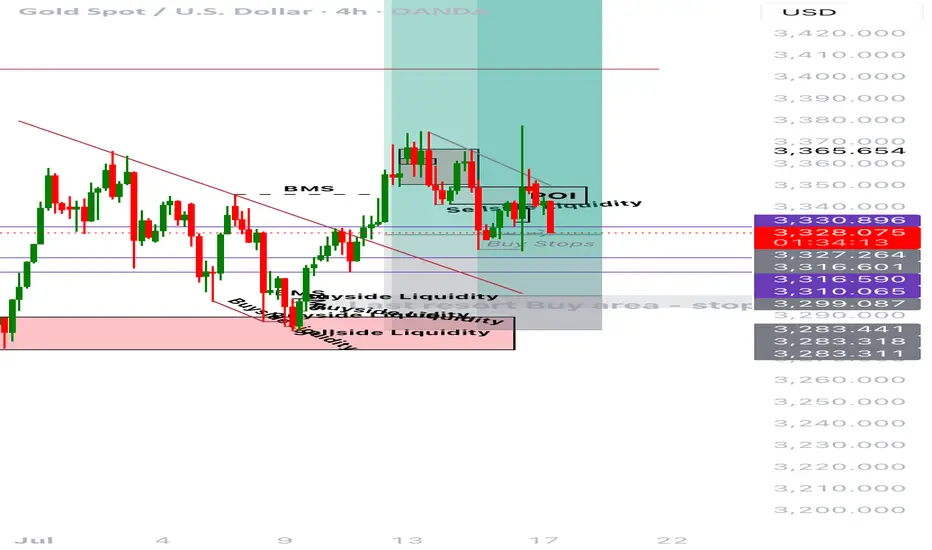
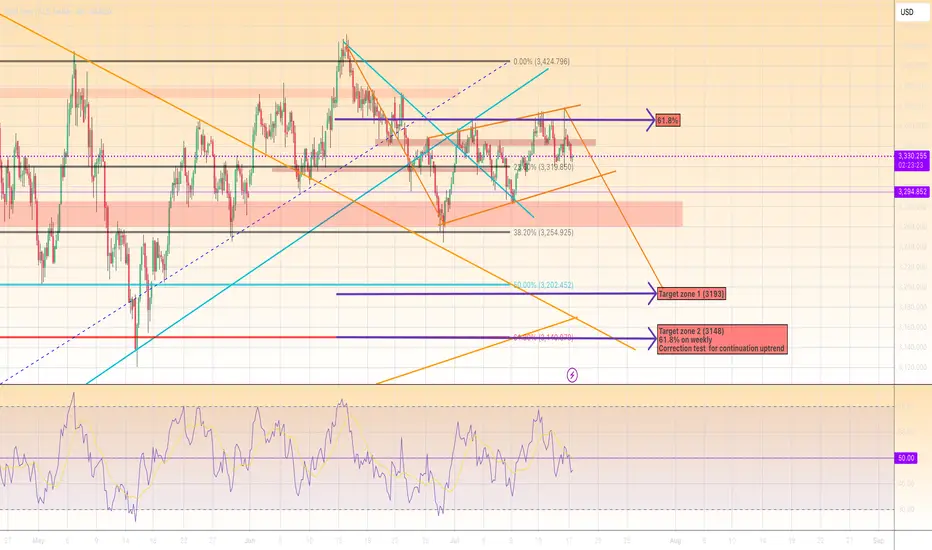
Short for Gold to TargetsSimple trading
Using patrons fibonacci RSI and Trendlines
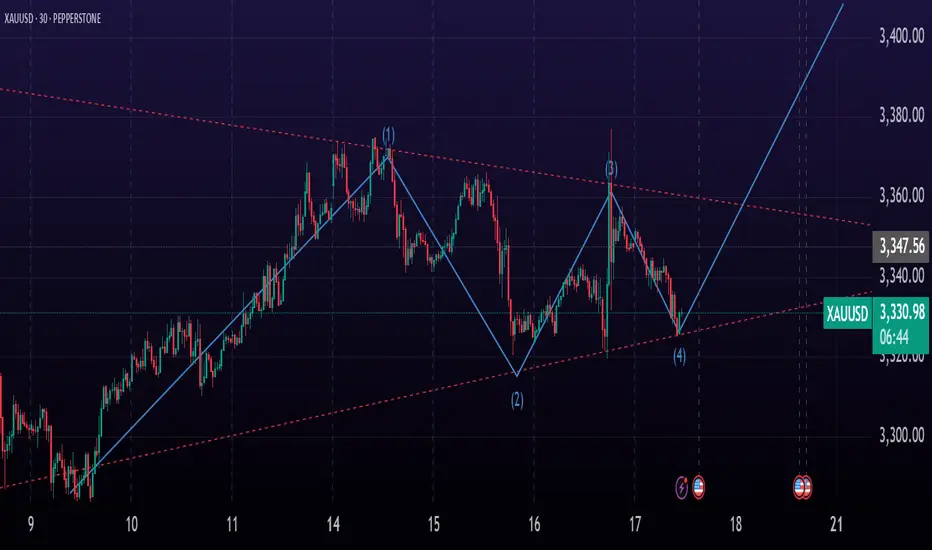
We see a rising wedge we calculate the first high to the low of the wedge and use that to predict a target, we use the fibonacci to find the 61.8%, I have put for myself different values in the fib settings to find targets that works for the market and for me.
With precision the first high to low of the wedge I copy to find the target and matched with my fib setting.
We have enough space on the RSI to make the correction what needed is to get space for the uptrend.
Target 2 is based on the weekly fib what needed is to test on the 61.8 to complete the behavior of the market and follow the uptrend again.
We getting better in understanding the psychology of the markets behavior.
How we see the trendlines react we know there is a understanding on patrons.
Futures market
Gold will be determined by upcoming newsChart seems to be moving sideway. Waiting for the upcoming news to drive the gold price up or down. But I'm certain for short term, this can be achieved.
Buy now and set TP at 3345 safe region. Don't be greedy, take little pips to minimise risk.

GOLD: Move Up Expected! Long!
My dear friends,
Today we will analyse GOLD together☺️
The in-trend continuation seems likely as the current long-term trend appears to be strong, and price is holding above a key level of 3,327.26 So a bullish continuation seems plausible, targeting the next high. We should enter on confirmation, and place a stop-loss beyond the recent swing level.
❤️Sending you lots of Love and Hugs❤️

SILVER: Local Bearish Bias! Short!
My dear friends,
Today we will analyse SILVER together☺️
The market is at an inflection zone and price has now reached an area around 37.832 where previous reversals or breakouts have occurred.And a price reaction that we are seeing on multiple timeframes here could signal the next move down so we can enter on confirmation, and target the next key level of 37.762..Stop-loss is recommended beyond the inflection zone.
❤️Sending you lots of Love and Hugs❤️

Gold fluctuated downward. Stuck in a stalemate.Information summary:
Global investors have experienced the longest night this year. There are reports that Trump has drafted a letter to fire Federal Reserve Chairman Powell. The incident triggered a strong reaction in the financial market. An hour later, Trump came out to clarify that "there is no plan to take any action" and denied drafting a letter to fire Powell.
Due to the impact of the incident, gold experienced a roller coaster market, soaring more than $50 at one time, hitting a three-week high of $3,377.17, and then narrowed its gains to 0.68%, and finally closed at $3,347.38. In today's Asian market, gold fell slightly and is currently hovering around $3,325.
Market analysis:
The current volatility pattern has not changed. In the short term, the market shows signs of weakness, which is also affected by CPI data, and expectations for interest rate cuts have weakened. In the current state where there is no break in the pattern, waiting and watching is still the best strategy.
The first support level is around 3,310, which is the starting point of last week's high. The second is around 3280, which is the historical low since July and also the starting point of the rise in the first week of July.
XAUUSD parallel channel Gold is currently holding rising channel.
What's possible scanarios we have?
▪️I'm looking for Buying towards at 3320-3312 support area if it's sustained
Along H4 remains above then keep buy set targets at 3345 then 3360
-> Moral of Day buy the Dips
Additional TIP:
Below 3310 I will Activate my resell and hold till 3300then 3290

GOLD XAUUSD TodayGOLD XAUUSD Today
SSM Structure back to sell trend
In my opinion good for looking sell setup

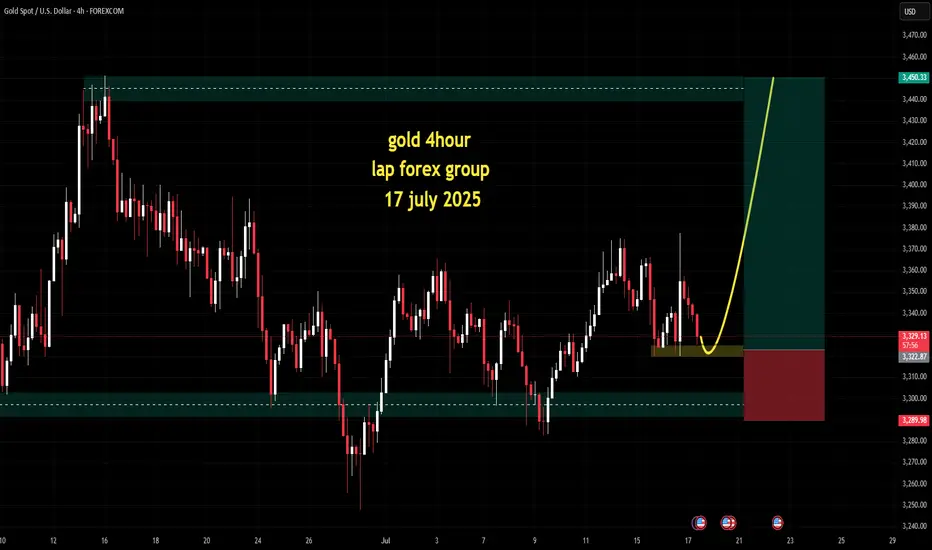
GOLD Intraday Chart Update For 17 July 2025Hello Traders, welcome to new Trading day
Today we have some high impact news of USD, Currently market is still in tight range and we still need breakout of 3300 Psychological for downside clearly
For upside market must need to close above 3380-90 zone for further upwards continuation
currently we are also keep an eyes on WAR Fundamental news
Disclaimer: Forex is Risky
xauusd has potential of buying towards new record high potential of buying towards new record high , as we saw last weeks respect to head and shoulder pattern ,we can continue to anticipate more buying impulse since the usd is in economic conflict with other countries as well
Gold (XAU/USD) - Elliott Wave Suggests Wave 5 Upside Starting!📊 Current Wave Count:
Wave 1 (Complete): Rally from to .
Wave 2 (Corrective): Pullback to (held 50%/61.8% Fib).
Wave 3 (Extended): Strong impulse to .
Wave 4 (Corrective): ABC pattern ending near (e.g., 38.2% Fib of Wave 3).
🎯 Wave 5 Projection:
Target: Typical 0.618–1.0 extension of Wave 1-3 → $ .
Invalidation: Break below Wave 4 low ($ ).
📈 Why Now?
Wave 4 completed as a shallow correction (flat/triangle).
MACD/RSI shows bullish divergence on lower timeframes.
Fundamental drivers (e.g., Fed dovishness, inflation) align.
⚡ Trading Plan:
Entry: Near current pullback (~$ ).
Stop Loss: Below Wave 4 low.
Take Profit: Scale out at 0.618 and 1.0 extensions.
Crude oil-----Sell near 66.80, target 65.00-62.00Crude oil market analysis:
The recent crude oil daily line began to decline, but a small V appeared last night, which was also caused by the situation in the Middle East. Israel bombed Syria and crude oil began to rebound. Overall, crude oil is still bearish. We consider continuing to sell it when it rebounds. It has not broken near 64.00, and it is difficult to form a large unilateral. The suppression position is near 66.80. Consider selling it near it.
Fundamental analysis:
Trump’s dissatisfaction with Powell has not been a day or two. Conflict is inevitable, and the impact on gold is also short-term. Yesterday’s pull-up and dive is a case in point.
Operational suggestions
Crude oil-----Sell near 66.80, target 65.00-62.00

Gold Builds Up to 3370’s — Bullish Stance ReclaimedGold market price builds up to the 3370’s, reclaiming its bullish stance after a successful mitigation at 3340’s. This move signals a likely continuation of bullish momentum, with further upside projections in play. follow for more insights , comment , and boost idea

XAUUSD BUY IDEAOn the H4 we have a clear unmitigated fvg+KL just blow a valid level as inducement which price might come to raid.
There has been series of military attack between iseal and Syria and also Fed cutting the rate will also be a key factor

Xausd techinical analysis.This chart shows a potential bullish reversal pattern in Gold Spot vs. U.S. Dollar (XAU/USD) on the 1-hour timeframe, with clear technical signals suggesting a possible upside move. Here's a breakdown:
---
🔍 Pattern & Analysis
Falling Wedge: The pink trendlines mark a falling wedge pattern, typically a bullish reversal signal.
ABC Bullish Harmonic Pattern:
XA, AB, BC, and CD legs suggest a Bullish Gartley or Bat pattern.
Point C appears to be the reversal zone, supported by Fibonacci levels (0.886 of AB and 1.047 of XA), indicating potential entry.
---
📈 Price Action Insight
Current Price: 3,330.415
Target Zones:
TP1: Around **3,345–3

XAUUSD NEXT MOVE (READ CAPTION)Hi trader's. what do you think about gold market
current price : 3354
gold Friday breakout sell trade and gold breakout resistance 3345 and close above 3345 and gold just retest downside then he taking support and pump upside gold breakout 3365 then gold next move 3395
support zone: 3343:3330
resistance zone :3365
target 3395
stop loss: 3310
please like comment and follow thank you


EUR/USD Resumes Bearish Trend Below $1.176FenzoFx—EUR/USD trades bearish, below the 100-SMA, and is currently testing the bullish FVG as support. Yesterday, Euro failed to pass the immediate resistance at $1.176; therefore, we expect the bearish bias to resume.
In this scenario, EUR/USD's downtrend could extend to the next support level at $1.151. Please note that the bearish outlook should be invalidated if Euro closes and stabilizes above $1.176.

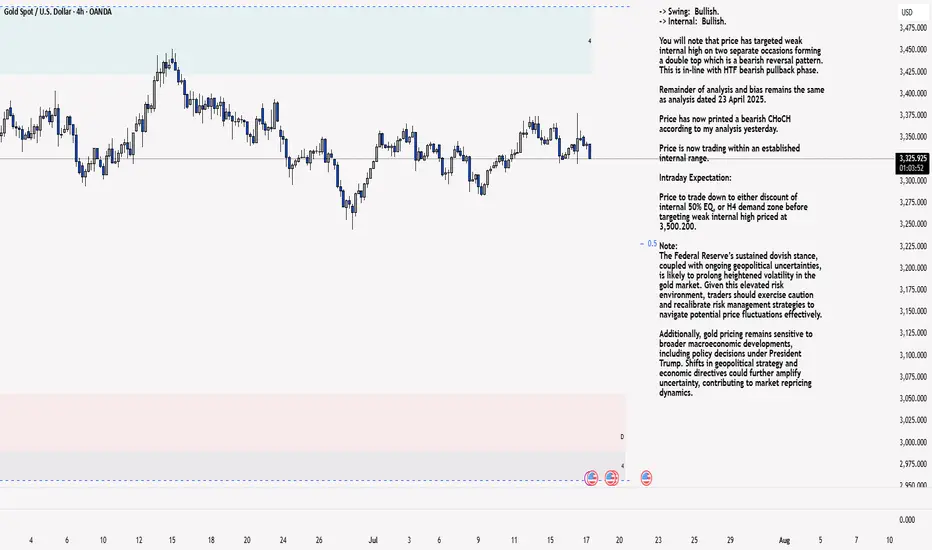
XAU/USD 17 July 2025 Intraday AnalysisH4 Analysis:
-> Swing: Bullish.
-> Internal: Bullish.
You will note that price has targeted weak internal high on two separate occasions forming a double top which is a bearish reversal pattern. This is in-line with HTF bearish pullback phase.
Remainder of analysis and bias remains the same as analysis dated 23 April 2025.
Price has now printed a bearish CHoCH according to my analysis yesterday.
Price is now trading within an established internal range.
Intraday Expectation:
Price to trade down to either discount of internal 50% EQ, or H4 demand zone before targeting weak internal high priced at 3,500.200.
Note:
The Federal Reserve’s sustained dovish stance, coupled with ongoing geopolitical uncertainties, is likely to prolong heightened volatility in the gold market. Given this elevated risk environment, traders should exercise caution and recalibrate risk management strategies to navigate potential price fluctuations effectively.
Additionally, gold pricing remains sensitive to broader macroeconomic developments, including policy decisions under President Trump. Shifts in geopolitical strategy and economic directives could further amplify uncertainty, contributing to market repricing dynamics.
H4 Chart:
M15 Analysis:
-> Swing: Bullish.
-> Internal: Bullish.
H4 Timeframe - Price has failed to target weak internal high, therefore, it would not be unrealistic if price printed a bearish iBOS.
The remainder of my analysis shall remain the same as analysis dated 13 June 2025, apart from target price.
As per my analysis dated 22 May 2025 whereby I mentioned price can be seen to be reacting at discount of 50% EQ on H4 timeframe, therefore, it is a viable alternative that price could potentially print a bullish iBOS on M15 timeframe despite internal structure being bearish.
Price has printed a bullish iBOS followed by a bearish CHoCH, which indicates, but does not confirm, bearish pullback phase initiation. I will however continue to monitor, with respect to depth of pullback.
Intraday Expectation:
Price to continue bearish, react at either M15 supply zone, or discount of 50% internal EQ before targeting weak internal high priced at 3,451.375.
Note:
Gold remains highly volatile amid the Federal Reserve's continued dovish stance, persistent and escalating geopolitical uncertainties. Traders should implement robust risk management strategies and remain vigilant, as price swings may become more pronounced in this elevated volatility environment.
Additionally, President Trump’s recent tariff announcements are expected to further amplify market turbulence, potentially triggering sharp price fluctuations and whipsaws.
M15 Chart:
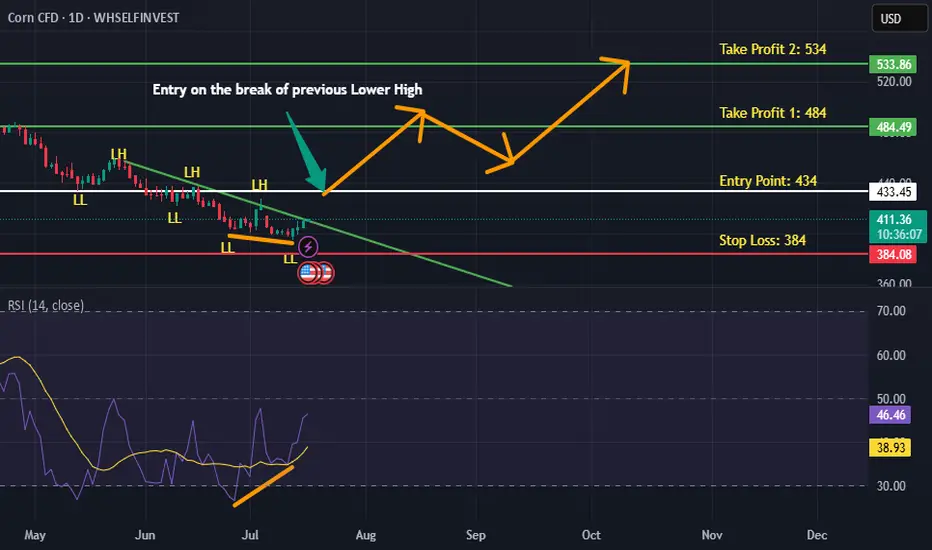
CORN is BullishPrice was in a strong downtrend, however the bullish divergence with trendline break hints the return of bulls. If previous lower high is broken with good volume then we can expect a strong reversal as per Dow theory. Targets are mentioned on the chart.
MCL Just RAN the Highs and Died. Beautiful. You ever watch price grind into a supply zone like it’s got no clue what's coming, then slap the trend line like it owes it money? That’s what MCL did this morning. It ran the previous day high, tapped into a juicy supply zone, gave us a textbook order block rejection and I said, “bet.”
I’m not here for 300 IQ Fibonacci spirals or Jupiter retrograde entries I just want clean structure, manipulated highs, and a breakdown that pays the bills. Let’s dig in.
Setup Overview (15-Min Chart)
Bias: Bearish
Setup Type: Liquidity Run ➝ OB Retest ➝ Trend Continuation
Context & Narrative:
PDH (67.01) was swept early. Liquidity grab? Price got yeeted from supply after faking momentum. We got a clean Order Block Retest at 66.59, respecting the descending EMA and HTF structure.
Entry Structure:
- Entry - 66.39 Retest rejection + momentum shift
- TP1 - 66.10 Intra-day structure low
- TP2 - 65.80 Demand zone front-run
- PDL - 65.40 Potential deeper fade if momentum holds
Confluence Checklist:
- Sweep of prior highs (PDH liquidity grab)
- Strong supply reaction + OB retest
- Bearish EMA slope holding price down
- Momentum shift + clean intraday structure
- Entry gives >2R to TP1, >4R to TP2
Risk Notes:
If price reclaims 66.70+ and closes above OB → bias invalidated. Don’t marry the trade this is oil, not Tinder.

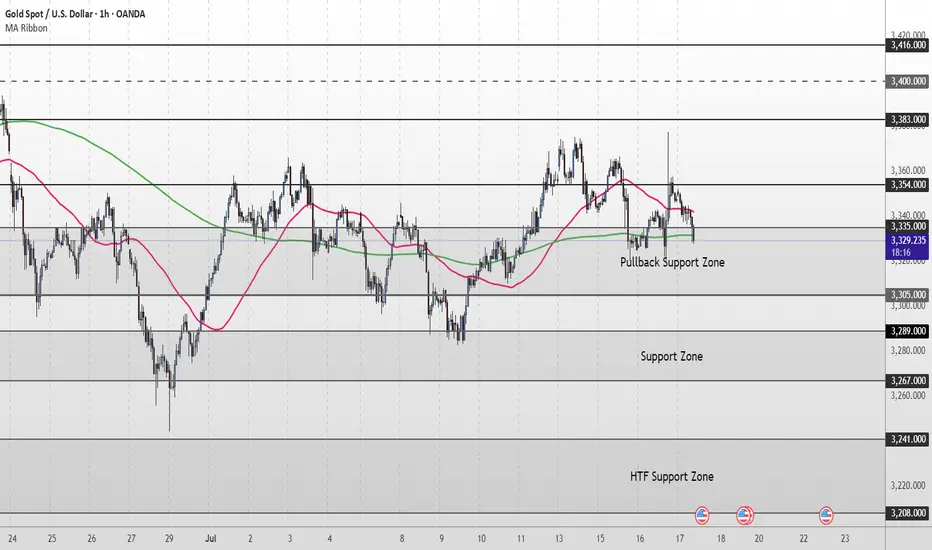
Gold Short Term OutlookYesterday, gold staged a strong rally, pushing up toward 3,377, which was followed by a strong rejection. Price has pulled back sharply and is now testing the Pullback Zone once again.
Currently trading around 3,329, price is caught between the 50MA overhead acting as dynamic resistance and the 200MA below offering dynamic support.
For the bullish structure to regain momentum, we need to see a clean break and hold back above 3,354. This would reopen the path toward 3,383 and 3,400, with 3,416 as a higher‑timeframe target.
If buyers fail to defend the Pullback Support Zone, and price breaks decisively below 3,305, attention shifts to the Support Zone (3,289–3,267). A deeper selloff could then expose the HTF Support Zone (3,241–3,208).
📌 Key Levels to Watch
Resistance:
‣ 3,354
‣ 3,383
‣ 3,400
‣ 3,416
Support:
‣ 3,335
‣ 3,305
‣ 3,289
‣ 3,267
‣ 3,241
🔎 Fundamental Focus – High‑Impact U.S. Data Today
A packed U.S. calendar could drive volatility:
📌Core Retail Sales m/m and Retail Sales m/m
📌Unemployment Claims
📌Philly Fed Manufacturing Index
These red‑folder releases can create sharp intraday swings.
Additionally, multiple FOMC member speeches later in the session could add headline‑driven moves.
No clear indication yet…📝 Trade Journal Entry – XAUUSD (Gold Spot)
Date: July 17, 2025
Platform: TradingView (Demo Account)
Timeframe: 1H (Live Management), 4H Bias
Direction: Originally Long → Reassessing
Status: Active — Protective Stop Adjusted
Current Price: 3,328.920
Stop Adjusted To: Below recent swing low
Potential Loss: ~£40
Rationale for Change: Loss of bullish structure — no BOS to the upside
⸻
🔍 Market Context
• Price reacted well off the POI but failed to break bullish structure.
• No confirmation of BOS on the 1H or 15M timeframe.
• Price action appears to be trapped within a range, not confirming intent.
• Downward pressure and failed follow-through makes long continuation questionable.
⸻
⚠️ New Trade Decision
• Stops moved to below recent swing lows for capital protection.
• Will accept minor loss (~£40) to maintain discipline and avoid emotional averaging.
• Buy bias now on pause — waiting for clean structure shift or deeper mitigation into demand.
⸻
🎯 Plan Going Forward
• Reassess once price reaches demand at ~3,283 zone.
• Watch for:
• Clean BOS
• Rejection + SFP
• HTF confluence and re-alignment
• Stay out of long trades until confirmed strength returns.
⸻
😐 Emotional Reflection
Felt uncertain watching price stall. Happy I didn’t add recklessly or average down. Taking a small hit is a win when the logic isn’t there anymore.
⸻
✅ Reflection Questions
• Did I adjust my bias correctly when structure changed?
• Was I emotionally attached to the idea of a buy?
• Did I move my stop based on logic or fear?