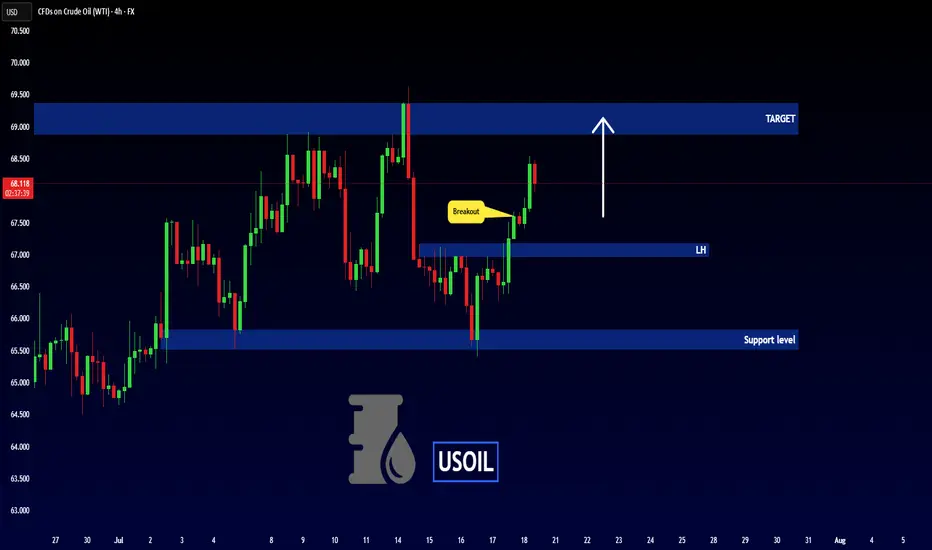
USOIL - BULLISH MOVE !Hello Traders !
The USOIL failed to create a new lower low!
The price broke the lower high (choch).
So, I expect a bullish move🚀
______________
TARGET: 68.880🎯
Futures market
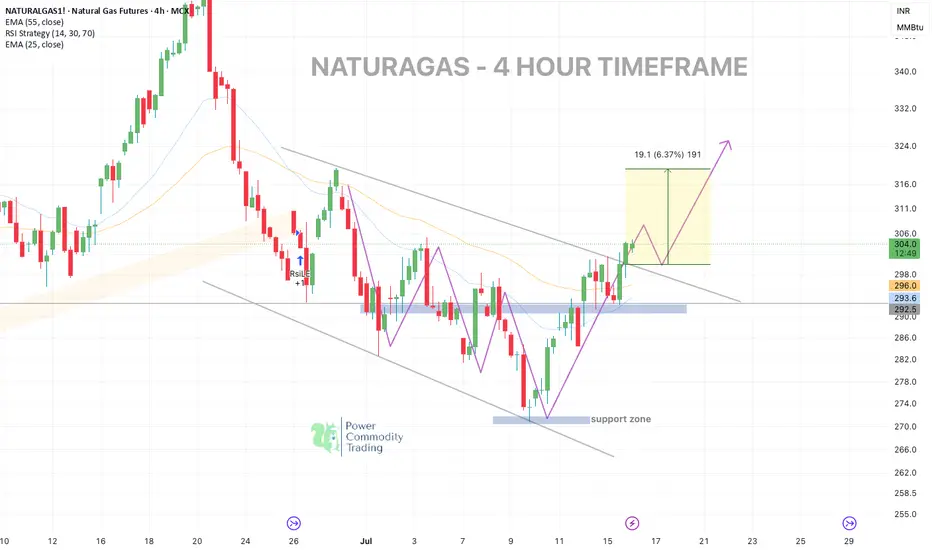
$NATURALGAS - 4H Breakout After Support ReclaimPattern formation: falling wedge pattern (4 Hour)
Price executed a clean reversal from the demand zone, reclaimed key EMAs, and broke out of the falling channel — hinting at a potential trend shift on the mid-timeframe.
✅ Support zone held strong near 270–280
✅ Breakout of falling wedge/channel
✅ Reclaim above 25 & 55 EMA
✅ Bullish structure with clean HH-HL formation
✅ Momentum building with volume confirmation
Possible Scenarios:
Retest near 296–298 zone may offer the best risk-reward long entries.
Targeting 308 - 314 - 320 (+6.3%) from the breakout zone.
#CrudeOil #naturalgas #MCXCrude #PowerOfCommodity #TriangleBreakout #TradingViewIndia #EnergyMarkets #TechnicalAnalysis
Comment below if you think it's bullish?
sideways in weekend downtrend⭐️GOLDEN INFORMATION:
Gold prices (XAU/USD) struggle to extend Thursday’s recovery from the $3,309 region—a one-week low—consolidating within a tight range during Friday’s Asian session. The US Dollar (USD) continues to retreat from its peak since June 23, pressured by dovish signals from Federal Reserve (Fed) Governor Christopher Waller.
Additionally, growing concerns over US President Donald Trump’s unpredictable trade policies and their potential consequences for global growth are keeping investors cautious, supporting demand for the safe-haven metal. These factors collectively help limit deeper losses in Gold, though the metal lacks clear bullish momentum for now.
⭐️Personal comments NOVA:
Gold price is moving sideways, accumulating in the downtrend line, not much fluctuation in weekend news
⭐️SET UP GOLD PRICE:
🔥SELL GOLD zone: 3381- 3379 SL 3386
TP1: $3370
TP2: $3360
TP3: $3350
🔥BUY GOLD zone: $3293-$3295 SL $3288
TP1: $3308
TP2: $3318
TP3: $3330
⭐️Technical analysis:
Based on technical indicators EMA 34, EMA89 and support resistance areas to set up a reasonable SELL order.
⭐️NOTE:
Note: Nova wishes traders to manage their capital well
- take the number of lots that match your capital
- Takeprofit equal to 4-6% of capital account
- Stoplose equal to 2-3% of capital account

Gold---sell near 3355, target 3330-3320Gold market analysis:
The gold buying and selling game in the past two days is quite fierce. The daily line is washed back and forth, with a combination of one Yin and one Yang. The upper and lower shadows of the daily line are relatively long. Yesterday, the daily line closed with a standard hammer candle pattern. After breaking the strong support of 3320, the price did not continue to fall, but bottomed out at 3308 and began to rise strongly, which eventually led to the short-term selling dream being shattered again. The daily line and K showed alternating conversions. The short-term trend is vague, but the long-term trend is still buying. This wave of repairs has the participation of fundamentals and the repair of gold itself. In the big cycle, it is difficult to form a daily selling trend without breaking the position of 3281. In addition, the fundamentals all support gold. I think the possibility of a deep fall in gold in the near future is very small. We are just a follower. In the short term, we focus on the intraday trend to operate. Yesterday, the daily line had a tail, and the possibility of continuing to fall today is small. Let's look at the repair rebound in the Asian session first. The first suppression position for buying rebound is around 3357. This position is also a form suppression and an indicator suppression. The other suppressions are around 3366 and 3377. Note that gold is not unilateral. When encountering great pressure, we must also consider selling opportunities. Today, I think it will rebound first and then fall back.
Support 3327 and 3320, strong support 3308, pressure 3344.3357.3366.3377, and the strength and weakness dividing line of the market is 3340.
Fundamental analysis:
There are not many fundamentals this week. The data released yesterday still suppressed gold as a whole, but the gold tail market still bottomed out and rebounded.
Operation suggestions:
Gold---sell near 3355, target 3330-3320

Waiting for the Break: 3375 or 3320 Will Decide the Next 1k Pips📉 Quick recap:
As you know, I've been bullish on Gold. However, as explained in yesterday’s analysis, I started to approach this view with more caution. Unfortunately, I closed my long position at break even… before the rally to the 3375 resistance. That’s trading.
📌 What now?
Despite missing that move, the market is beginning to offer more clarity. There are now two key levels that will likely define the next major swing:
________________________________________
🔹 1. Resistance at 3375 – Top of the Range / Triangle Breakout Zone
• This level marks the upper boundary of the recent range
• It’s also the resistance of a developing ascending triangle
• A clean breakout above 3375 would confirm the pattern and could trigger a strong upside acceleration
• Target: 3450 zone, with potential for more if momentum kicks in (approx. 1000 pips higher)
➡️ This is the obvious bullish scenario – in line with the broader trend and classical technical setup.
________________________________________
🔻 2. Support at 3320 – The Less Obvious, but Classic Gold
• 3320 is now a confluence support area
• Technically, a break below here is less probable – but Gold has a habit of doing the unexpected
• If 3320 breaks, bears could look for a first leg to 3280 (approx. 400 pips), and very probably 3250 (around 700 pips drop)
➡️ This bearish scenario is not the base case, but it must not be ignored. Sometimes the trap is in the obvious.
________________________________________
🧭 Trading Plan:
For now, I’m out of the market, patiently waiting for confirmation. I’ll trade the breakout – whichever side gives the signal first.
________________________________________
📌 Conclusion:
Gold is coiling for a larger move. The levels are clear: 3375 and 3320 are the doors. One of them will open. Until then, we wait and prepare. 🚀
Disclosure: I am part of TradeNation's Influencer program and receive a monthly fee for using their TradingView charts in my analyses and educational articles.

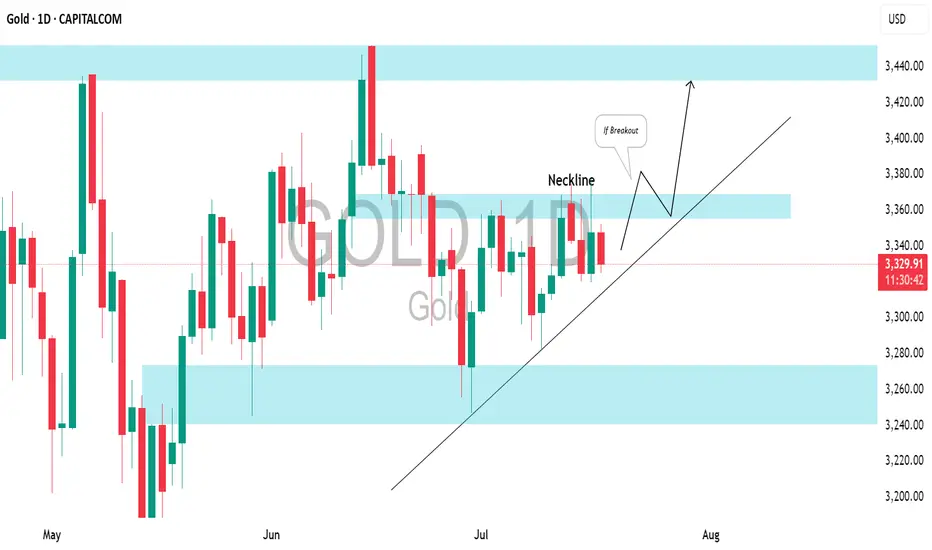
GOLD (XAUUSD): Bullish Accumulation PatternI spotted a clear ascending triangle pattern on a daily time frame.
To validate a bullish continuation, we need a breakout above the neckline.
A daily candle close above 3370 will serve as a strong confirmation, and we can expect a move up to at least the 3440 resistance level.
XAUUSD: Market Analysis and Strategy for July 18Gold technical analysis
Daily chart resistance: 3382, support: 3310
Four-hour chart resistance: 3375, support: 3332
One-hour chart resistance: 3365, support: 3345.
From a technical perspective, the price of gold has recently formed a wide range of fluctuations in the range of 3310-3365 US dollars, reflecting the unclear market direction. At present, the short-term moving average of gold is supported at 3332, and other periodic indicators are also in a bullish arrangement. The overall decline at the hourly level is limited, and the bulls still have the momentum to rebound.
3310 on the daily chart constitutes a key support. If it falls below, it may fall to the July low of 3287-3282. On the upside, if the resistance level of 3366 US dollars is effectively broken, it may trigger short stop losses and push the gold price back to the 3400 US dollar mark. Pay attention to the resistance of 3366-3377 above and the support of 3345/3332 below
BUY: 3345near
SELL: 3365near

XAUUSD H1 BUYING SETUPScenario:
Gold is showing strong buying momentum 📈. The best entry points are around the H1 FVG (Fair Value Gap) and Order Block (OB) zones. Wait for confirmation signals in either of these areas.
Gold could take off 🚀 from the FVG or OB. Once you see confirmation in any of these zones, take the entry ✅.
Use a small lot size and follow strict risk management rules ⚠️💰.
Stay disciplined and trade smart! 🧠📊

XAU / USD 1 Hour ChartHello traders. Looking at the push up from the overnight sessions, I am waiting to see if we push back down or do we start moving up. So for me, I am watching the $3354 area. If we can break and close above that, and with volume and favorable conditions for gold, we could partially fill, or fill the wick to the left marked on the chart. Let's see how things play out. There is no big new today here in the US. Watching the 30 min, the hourly and the 4 hour candles to see if I can get a good entry for scalp buy / sell trades. BIg G gets a shout out. Be well and trade the trend. Happy Friday.

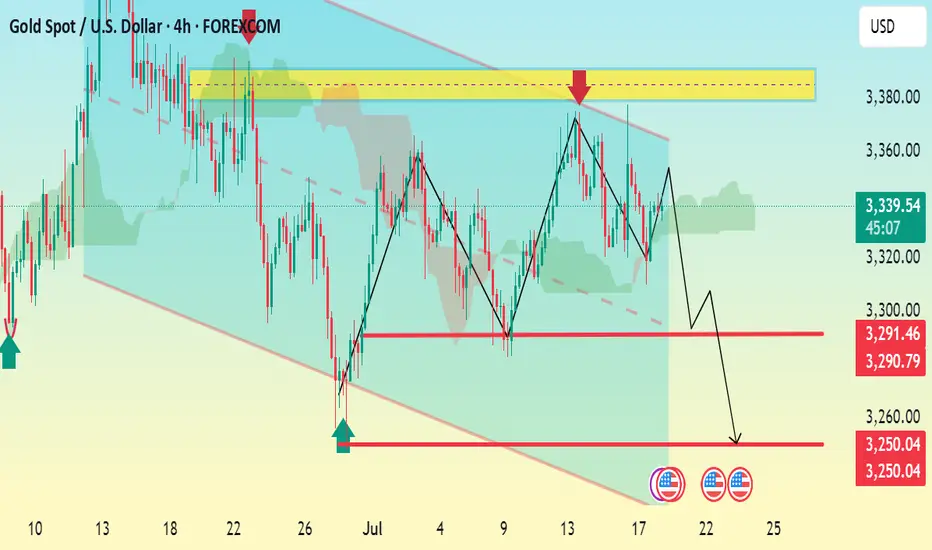
XAU/USD 4H Bearish Continuation Setup Analysis:Price recently rejected from the key resistance zone around 3,370–3,380 (highlighted in yellow).
A double top pattern is evident, indicating bearish pressure.
Price broke the rising trendline support and is forming lower highs.
Immediate support levels lie at:
3,291.46
3,290.79
A confirmed break below this support could send price toward the next major support at 3,250.04, which aligns with the projected move.
Bearish Bias:
As long as price remains below 3,344, the structure favors further downside.
Watch for a break and retest of the 3,291–3,290 zone for confirmation.
📉 TP Zones:
TP1: 3,291
TP2: 3,250
🛑 Invalid if price breaks above: 3,344
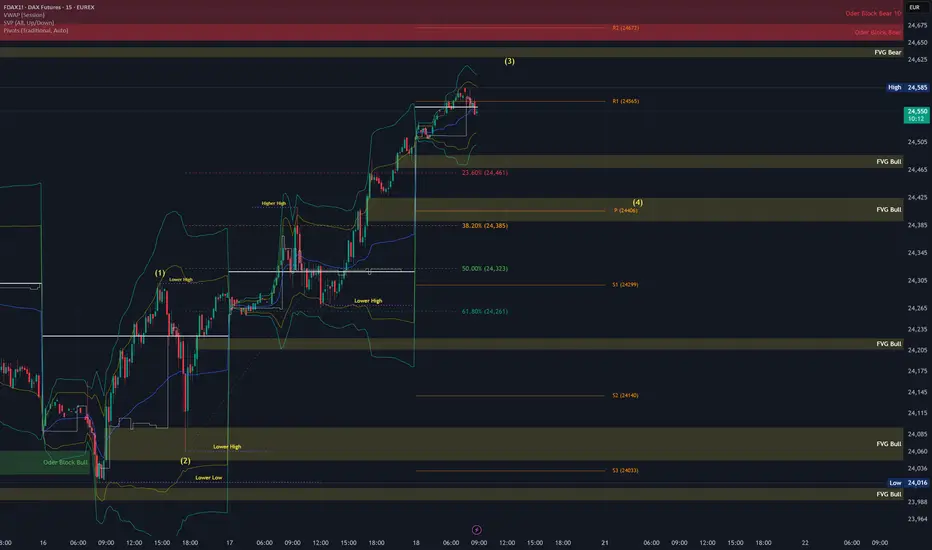
FDAX Today 1. Wave (3) likely near completion:
Price hit the 1.618 extension of Wave 1, which is textbook for a Wave 3 target.
There’s also confluence with the 23.6% retracement from the previous swing high (24,703), and we're near a Bearish FVG + Order Block zone.
High-probability zone for a short-term rejection or distribution top.
2. Wave (4) could start today
If Wave 3 is topping into OpEx, dealers might unwind long gamma hedges, contributing to volatility + pullback.
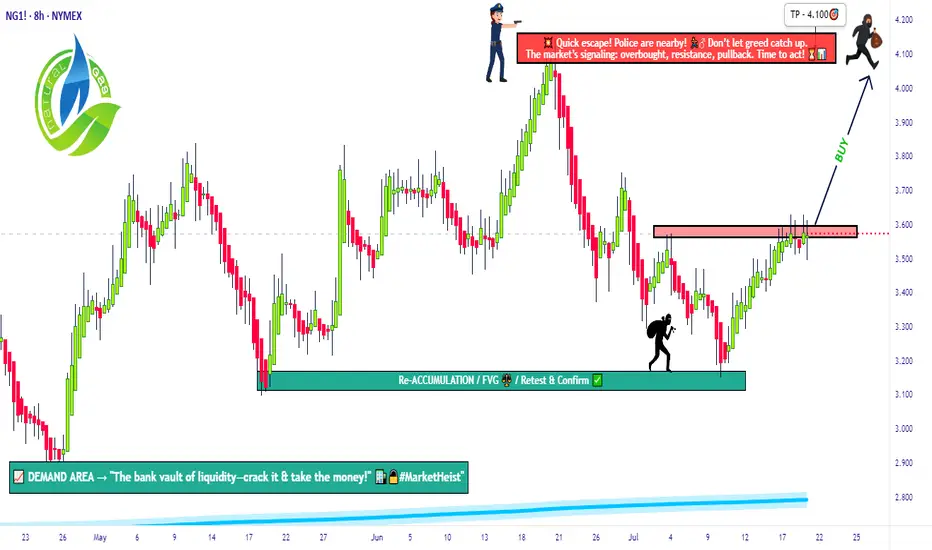
The Great Gas Heist: Load Your Longs Before It Blows💎🚨“Operation Gas Vault: NG1! Breakout Robbery Blueprint”🚨💎
🌟Hi! Hola! Ola! Bonjour! Hallo! Marhaba!🌟
Welcome to all my Market Hustlers & Silent Robbers 🕵️♂️💼💰
Today’s target: NG1! Henry Hub Natural Gas Futures
📍Strategy: A bullish heist mission with a calculated escape plan.
🔥Thief Trading Blueprint: Gas Market Heist🔥
🎯 Entry Gameplan
“The vault cracks open at 3.630 – That’s your cue.”
Wait for resistance breakout 🧱 (around 3.630) – that’s the signal.
Set Buy Stop orders above the Moving Average.
Or, use a layered DCA entry via Limit Orders near swing highs/lows (15m or 30m timeframe).
Thief Tip: Set an alert/alarm so you don’t miss the breakout bang 🔔💥
🛡 Stop Loss Setup (Post-Breakout Only!)
“Don’t be reckless. No SL before breakout — wait for confirmation.”
SL Location: Swing low (4H) near 3.370.
Set SL after breakout happens, not before.
Adjust based on your risk tolerance, lot size & number of open entries.
⚠️ Placing early SL = triggering the trap before the door opens.
🏴☠️ Loot Target 🎯
Take Profit Zone: 4.100
Escape Tip: No need to be greedy. Take profit before the police arrive (resistance)!
🧲 Scalper’s Shortcut
Only go Long – avoid fighting the current.
If you’ve got cash flow, strike early. If not, ride with the swing crew.
Use trailing SL to protect your stack 💼📉
📊 Fundamental Clues Behind the Heist
The gas vault is heating up thanks to:
🔥COT Reports
🛢 Inventory & Storage data
📈 Seasonal trends
💹 Sentiment flows
⚖ Intermarket linkages
Checkk your own global indicators 🌍🔗 – don’t enter blindfolded.
🗞️ News Traps & Position Protection
Avoid new entries during major news releases 📰🚫
Trail stops to guard running positions
Markets react fast. Adapt even faster.
⚠️ Disclaimer: This is educational info, not personal investment advice. Your money, your risk, your decisions.
💥 Support the Robbery Squad 💥
If you vibe with the Thief Trading Style, smash that Boost Button 💖
Grow the gang, expand the vaults, and master this money maze together! 🤑🏆🚀
Stay tuned – another heist plan is on the way.
Until then, trade smart, trade sharp. 👊🕶💼
🔒#NaturalGas #ThiefTrading #BreakoutStrategy #SwingTrade #FuturesHeist #NG1Plan #RobTheMarket
Gold Maintains Bullish Tone – Eyes on $3,350 Breakout📊 Market Overview
• Gold is trading around $3,339 – $3,340, after rebounding from the session low at $3,332.
• The USD is temporarily weakening, and safe-haven flows remain steady — key factors supporting gold.
• Markets are awaiting fresh U.S. economic data for clearer directional cues.
📉 Technical Analysis
• Key Resistance Levels:
– Near-term: $3,344 – $3,345
– Extended: $3,352 – $3,356 (weekly highs)
• Key Support Levels:
– Near-term: $3,332 – $3,335
– Extended: $3,320 – $3,325 (MA confluence + technical base)
• EMA: Price remains above EMA 09, confirming a short-term uptrend.
• Candle Pattern / Volume / Momentum: RSI is around 54–56; momentum remains positive but has cooled — suggesting potential consolidation.
📌 Outlook
Gold is maintaining a bullish technical structure — if it breaks above $3,345, a move toward $3,352 – $3,356 is likely. On the downside, a drop below $3,332 could trigger a retest of $3,325 – $3,320.
💡 Suggested Trading Strategy
🔺 BUY XAU/USD: $3,324 – $3,327
• 🎯 TP: 40/80/100 pips
• ❌ SL: $3,320
🔻 SELL XAU/USD :$3,352 – $3,355
• 🎯 TP: 40/80/100 pips
• ❌ SL: $3,359

WTI Crude Oil ShortWTI Crude Oil – Technical & Macro Outlook
🔻 1. Supply Zone Rejection Expected (66.50–68.00 Range)
Price is currently approaching a newly established supply zone between $66.50 and $68.00, which coincides with a prior consolidation area that preceded the recent sharp sell-off. This confluence enhances the zone’s relevance, especially given its position just below the 0.5 Fibonacci retracement level (~$69.47), derived from the swing high at $75.79 to the swing low.
📌 Outlook:
This region is expected to act as a high-probability rejection zone, likely attracting institutional sell-side interest. Price action within this zone should be monitored for signs of weakness or distribution.
📉 2. Downside Target: $61.50–$63.00 Demand Cluster
Should the supply zone hold, downside momentum could drive WTI toward the $61.50–$63.00 demand range. This area is technically significant, supported by the following factors:
Previous Change of Character (ChoCH) at $63.49, which marked the beginning of the recent bullish correction and represents a key structural pivot.
Presence of stacked demand zones below $64, increasing the likelihood of a meaningful reaction from buyers.
📌 Outlook:
This zone is expected to attract strong buying interest, making it a short-term profit-taking region for bears and a potential entry point for swing long setups, depending on confirmation.
🌍 Geopolitical Risk Landscape & Supply Dynamics
Recent geopolitical developments continue to influence crude oil pricing dynamics:
Middle East instability (e.g., Iraqi disruptions and ceasefire delays) has led to tightened supply conditions, pushing WTI above $67.
Persistent uncertainty stemming from Iranian nuclear negotiations, ongoing U.S.–China tariff risks, and regional tensions contributes to a sustained risk premium.
While OPEC+ is incrementally increasing production, this is offset by rising Saudi exports and weakening demand forecasts, which may result in inventory builds by late 2025.
Russia’s export resilience—bolstered by strategic redirection toward Asia—suggests that any anticipated supply contraction could be less severe than expected.
🛢 WTI at $62 – Technical and Macro Implications
A decline to $62 would place WTI at a major technical support level, closely watched by institutional participants. If tested, the market could react in the following ways:
Bargain hunting and value-based buying may emerge, especially if macroeconomic data aligns with a recovery narrative.
Heightened volatility is likely, driven by sensitivity to any shifts in global risk sentiment—particularly those tied to trade policy, OPEC+ production surprises, or further geopolitical escalations.
📌 Summary
Resistance: $66.50–$68.00 (pre-breakdown supply + 0.5 Fib)
Support / Target: $61.50–$63.00 (demand + structural ChoCH)
Bias: Short-term bearish toward demand, with high reactivity expected near $62
Risk Factors: Elevated geopolitical uncertainty and diverging supply dynamics across OPEC+, Russia, and the U.S.

Gold rebound brings bearish opportunities
Before the fishermen go out to sea, they don't know where the fish are? But they still choose to go because they believe they will return with a full load. When you invest, you don't know whether you can make a profit, but you still need to try, and from the moment you decide to do it, you must insist on believing to gain something. The same is true for gold investment. You may still be losing money at the moment, but as long as you find me, all losses will be solved!
Views on the trend of gold!
In terms of gold, unfortunately, the bulls don't seem to last long, and they are also a bit unstable! Emphasize the most critical point, the continuous rise of the sun, the first wave of V-shaped rebound last night, and then the high-level oscillation, and there was no continuation of the rise of the sun last night. The bulls did not take off in one wave, but were held down again. But in the same way, don't think that the bulls are held down, and the bears will come. We still have to distinguish according to the range and strength. In many cases, the market maintains a oscillating range.
So how do you look at it today? Is there still hope for the bulls? From the perspective of correction, every big drop has poor continuity, and they all bottom out and rebound, just like gold fell to 3310 last night and violently rose to 3344, so there is a high probability that there will be continuation after the retracement today. On the one hand, even if it rebounds, it is also volatile, and the rebound and second decline is the continuation of the market. Therefore, currently pay attention to two points, the upward pressure 3355, and the downward strength and weakness dividing point 3325!
Gold: You can short at the rebound of 3350-55, defend 10 US dollars, and the target is 3330-25! If it breaks 3325, it will look down to the double bottom support of 3310. On the contrary, if it does not break, it can be shorted and look up to 3345-50!

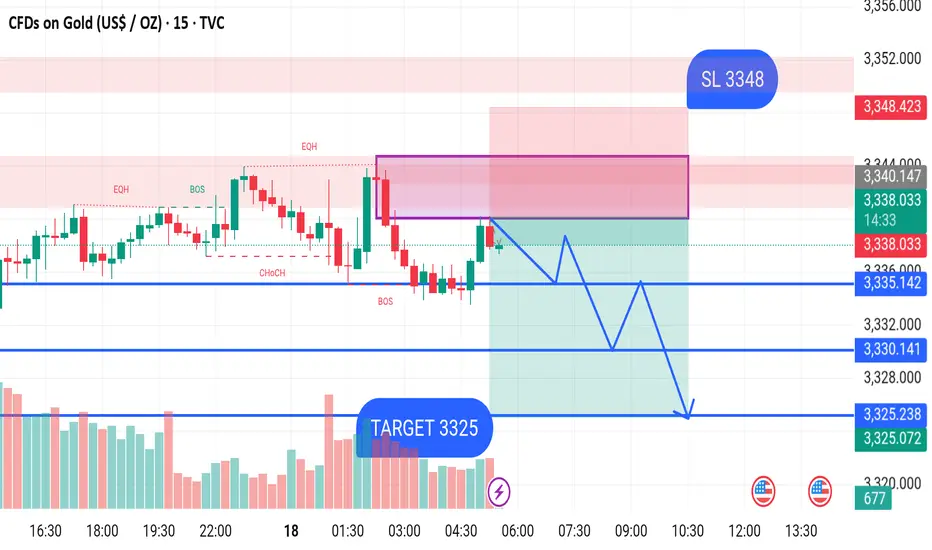
GOLD SELL M15Gold (XAUUSD) - 15-Minute Chart Analysis
This is a bearish short-term setup for Gold based on price action and key market structure levels.
Analysis Summary:
Entry Zone: Price has reached a supply zone around 3340, which is expected to act as a resistance.
Stop Loss (SL): Positioned at 3348, just above the supply zone to account for potential false breakouts.
Target (TP): The downside target is set at 3325, where previous support and volume interest converge.
Key Technical Levels:
Supply Zone: 3340 – 3348 (Red zone)
Resistance: 3340
Intermediate Support:
3335
3330
Final Target Zone: 3325
Structure Breakdown:
EQH (Equal Highs): Suggests a liquidity grab above recent highs.
BOS (Break of Structure): Indicates a shift from bullish to bearish structure.
CHoCH (Change of Character): Confirms potential trend reversal.
The expected price movement is a rejection from the supply zone, followed by lower highs and lower lows targeting 3325.
Trade Idea:
Sell around: 3340
Stop Loss: 3348
Target: 3325
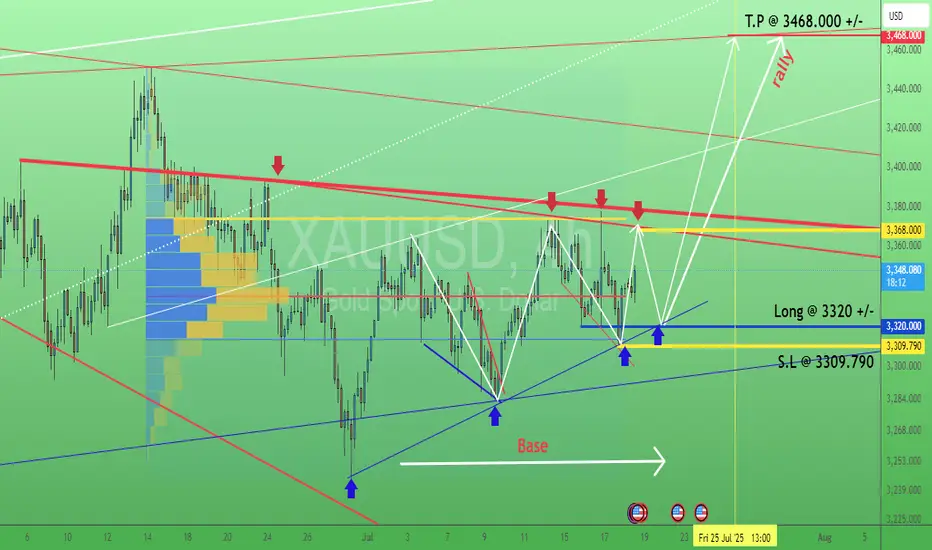
Gold. Swing trading signal. 18/July/25XAUUSD probably still ranging within 3309 - 3368 before breakout to the upside...targeting still around 3460 +/-
GOLD Bullish Flag Breakout!
HI,Traders !
GOLD is trading in an
Uptrend and
Now breaking out of the
Bullish flag pattern so we
Are bullish biased now
And we will be expecting a
Further move up !
Comment and subscribe to help us grow !

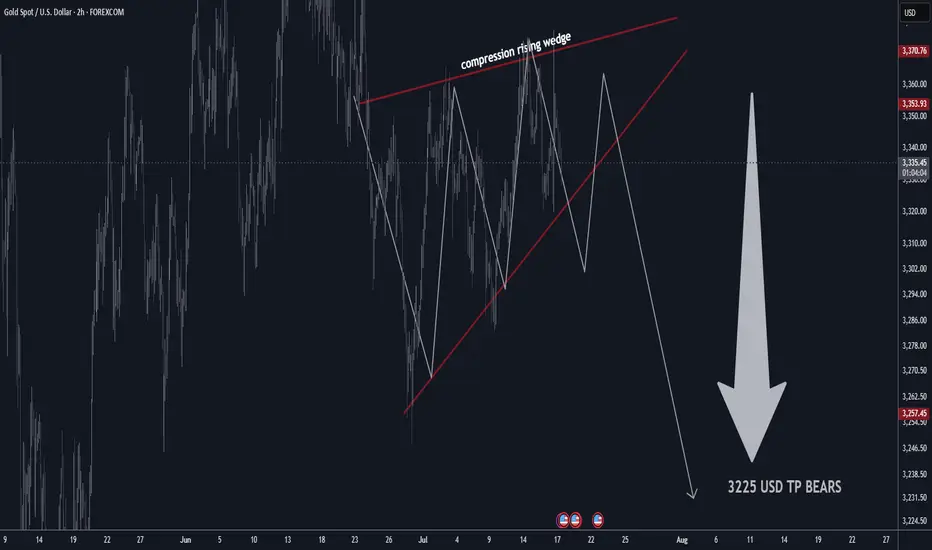
GOLD H2 Rising Wedge Expecting SellOFF TP BEARS 3225 USD📊 Gold Technical Outlook Update – H4 & 2H Chart
📰 Latest Summary Headlines
• Gold stalls near highs as technical compression signals possible breakdown
• Bearish rising wedge on 2-hour chart hints at sharp move lower
• Market volatility stays elevated amid global economic risks
• Short-term sellers targeting $3,225 if wedge pattern breaks
________________________________________
🏆 Market Overview
• Gold remains in a choppy range, struggling to clear key resistance.
• 2H Chart: Bearish rising wedge pattern identified, showing compression—expecting a potential breakdown soon.
• Overhead resistances: $3,410 / $3,460 USD will likely cap further upside.
• Major supports: $3,160 / $3,240 USD.
• If support fails, next key bear target is $3,225 USD.
• Range trading remains favored for now.
• Volatility likely to persist with no major bullish headlines on the horizon.
________________________________________
⭐️ Recommended Trade Strategy
• Bearish Setup (2H): Short sell gold at market on wedge breakdown.
o Stop loss: Above recent highs (set according to your risk tolerance and latest 2H swing high).
o Take profit: Target $3,225 USD.
• Continue to focus on selling near resistance, buying near support.
• Momentum: Watch for sharp moves as wedge resolves—be nimble!
• Always manage risk and adjust stop as price develops.
________________________________________
💡 Gold Market Highlights
• Safe-haven demand still strong due to tariffs, geopolitical tension, and U.S. fiscal concerns.
• Central banks & investors remain net buyers, but jewelry demand slides at high prices.
• Price action is dominated by institutional flows, with banks forecasting potential for gold above $4,000 next year—but short-term correction likely if wedge breaks.
• Current price: ~$3,358 per ounce. Compression suggests a larger move coming soon.
________________________________________
Summary:
Gold is at a crossroads, with a bearish wedge pattern building on the 2-hour chart. A breakdown could see a quick move to $3,225. Short sellers should act on confirmation, while bulls will look to reload at key support. Stay tactical!
Trade Journal: Missed Morning Move & Trading Into New Highs07/17/25 Trade Journal, and ES_F Stock Market analysis
EOD accountability report: +447.50
Sleep: 5 hours
Overall health: My health ring is signaling that my body isn't well the last few days.
VX Algo System Signals from (9:30am to 2pm)
— 8:53 AM Market Structure flipped bullish on VX Algo X3!
— 12:17 PM VXAlgo ES X1 Sell Signal (triple sell signal)
— 1:12 PM VXAlgo ES X3 Sell Signal
— 1:40 PM VXAlgo NQ X1DD Buy Signal
What’s are some news or takeaway from today? and What major news or event impacted the market today?
Today was a bit of a rough trading day, I missed the morning move and was a bit hesitant to make trades.
Saw a lot of MM positioning high up around 6340s and wasn't sure where to get a good entry. Wanted to go in at the MOB but they never went down there.
Sell signals were not as effective today because MM wanted to make ATH but i couldn't figure out the reasoning.
News
S&P 500 ENDS AT A NEW RECORD HIGH, VIX FALLS AS STOCKS RALLY ON SOLID EARNINGS, STRONG ECONOMIC DATA
What are the critical support levels to watch?
--> Above 6300= Bullish, Under 6290= Bearish
Video Recaps -->https://www.tradingview.com/u/WallSt007/#published-charts

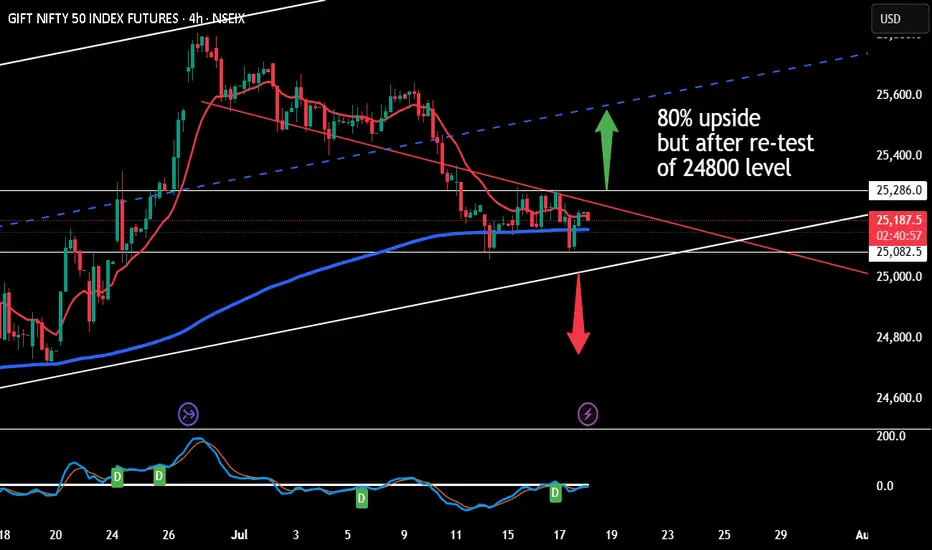
This is idea for positional trading in niftyBased on a confluence of Technical Analysis, Gann theory, and Astro-cycle studies, the market continues to experience downside pressure. This phase is likely a volume accumulation zone, which could set the stage for a stronger uptrend in the coming weeks.
The current bearish undertone is expected to gradually shift, with potential positive momentum emerging around August 5, 2025.
Scenario 1: Buy on Dip (Accumulation Zone)
Entry: Buy Nifty Futures in the 24,850 – 24,900 range
Stop Loss: 50 points
Target: 25,200 – 25,800
Note: This setup is valid only if the price retraces to this support zone, or halt before breaking out above 25,300.
Scenario 2: Breakout Buy
Entry: Buy Nifty Futures above 25,300
Stop Loss: 30 points
Target: 25,800
Note: This is a momentum-based entry upon confirmed breakout.
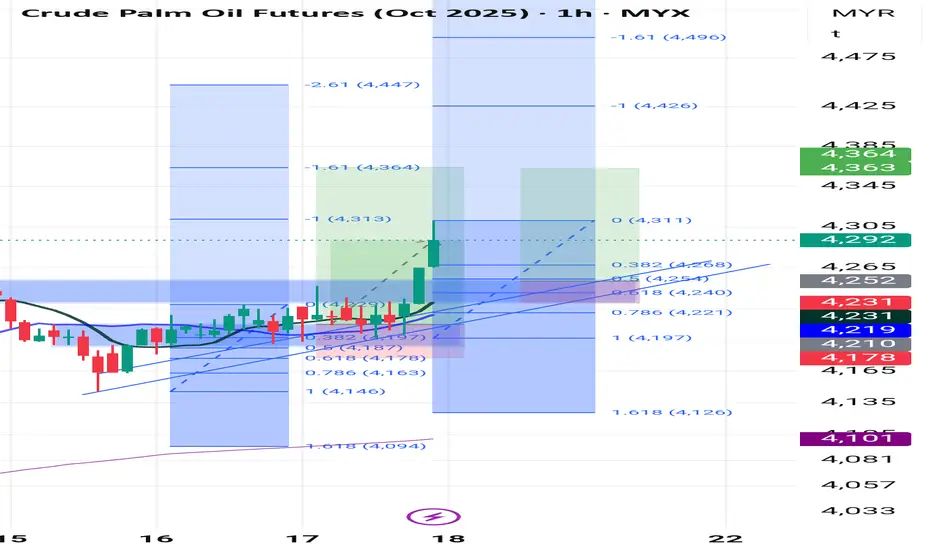
continuation bullish modeBased on the chart tf 1h, looks still strong to bullish mode. retracement area maybe between 4254 to 4230 which is area hh before (major market structure and Fibonacci retracement 0.5 to 0.618. and theres also strong support trendline in that area. however, will see how much the gap this morning .18 July. #testingpublish
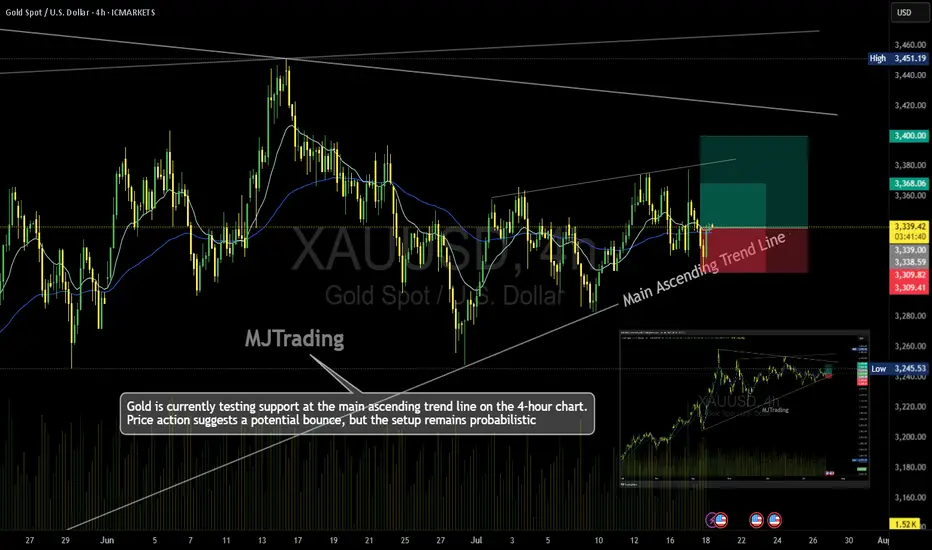
Gold (XAU/USD) – 4H Time Frame Trade Idea📈MJTrading:
Gold is currently testing support at the main ascending trend line on the 4-hour chart. Price action suggests a potential bounce, but the setup remains probabilistic—ideal for traders who operate on higher time frames and manage risk with discipline.
🔹 Trade Setup
Entry: 3340
Stop Loss: 3309
Take Profit 1: 3368
Take Profit 2: 3400
🔍 Technical Context
Price is respecting the long-standing trend line, hinting at bullish continuation.
Risk-reward ratio is favorable, especially for swing traders.
A break below the trend line invalidates the setup—hence the tight SL.
⚠️ Note: While the trend supports upside potential, failure to hold the trend line could trigger deeper retracement. Trade the probabilities, not the certainties.
In case it's not shown properly on your monitor because of different resolutions:
Psychology Always Maters:
#MJTrading #Gold #XAUUSD #Trend #Trendline #Forex #Chart #ChartAnalysis #Buy #Long