MERE TRADER BHAIYO K LIYE FREE FREE FREEYes for all traders who dint make money in this up move,
UPL Fut broke out of monthly range with good OI & all indicators suggesting strong buy.
Could b bought with mentioned stoploss & targets.
Message me for option trades.
Futures market

XAUUSDStill strongly net long, so bullish bias remains.
But this is a second consecutive drop, showing weakening bullish momentum.
Gold Bias: ✅ Bullish, but 🔻 losing strength
If this trend continues next week, it may indicate speculators are taking profits or becoming cautious.

MUTHOOTMuthootfin Fut made high of 2670 then consolidated & took support from 0.786 fib retracement & made flag n pole pattern on daily charts with decent OI & all other indicators suggesting strong buy.
Risk:Reward :- 1:2
Could b bought positionally with mentioned stoploss & target.

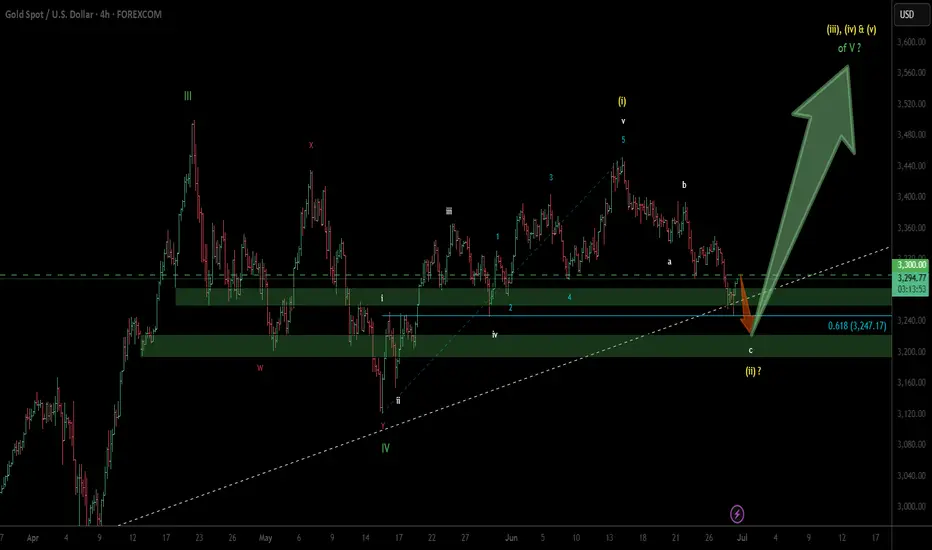
GOLD - next wave up soon...Updated Wave Count... still holding long...
Wave (ii) in yellow is possibly nearing completion.
3200 should limit any move to the downside.
previous wave count...
Gold 1Hr OutlookGotten a trendline breakout. So am expecting the move according to the path lines drawn on the chart

GOLD (XAUUSD) – June 30th OutlookWeekly: Gold opens bullish while still respecting the Dec 2024 trendline, despite the last two weekly candles closing bearish.
Daily: Currently at 3295, approaching key intraday bearish structure at 3310.
Last Week’s Bounce: From 3274 delivered 220+ pips, now becoming a pivotal reaction zone.
If 3310 Breaks: Expect continuation to 3344 – a 350-pip swing.
If 3310 Rejects: Anticipate a move back to 3274 for re-evaluation.
⚠️ Note: Today is the final trading day of the month. Watch for false breakouts and potential liquidity traps.

XAUUSD SHORT SETUPExpecting a possible bearish reversal from Gold back to sweep the liquidity below.

XAUUSD in Bearish trend XAUUSD in Bearish trend RSI diversions can be seen expected trend reversal from bearish to bullish RR1:1

Gold Short to Medium Term Outlook
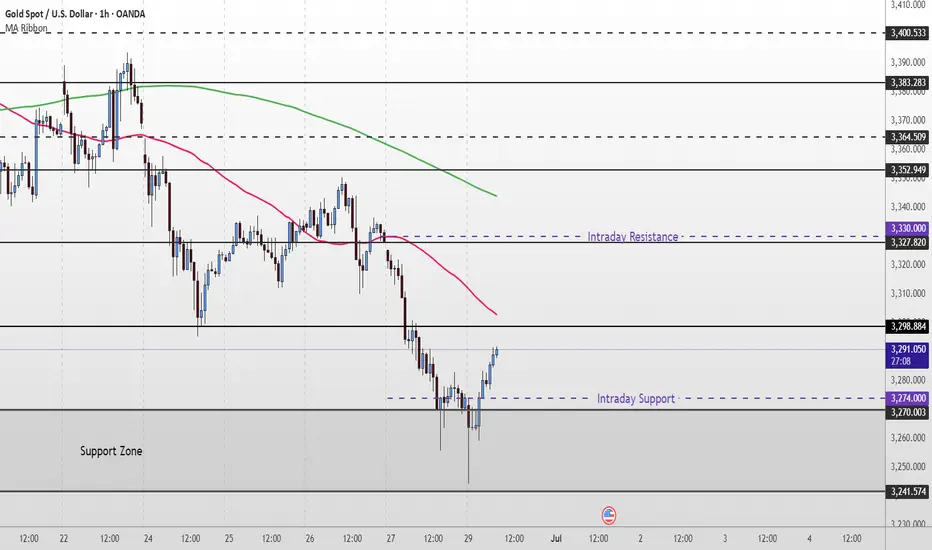
Last week, gold bounced from the lower Support Zone after briefly breaching $3,270. Price is now attempting a recovery, currently trading near $3,290, but remains below both the 50 EMA and 200 EMA — confirming bearish pressure is still intact.
For bulls to gain momentum, we need to see a clean break and hold above $3,298–$3,327which would open the path toward $3,352 and possibly higher resistance levels like $3,364 and $3,383.
Until then, this move may simply be a short-term pullback within a broader downtrend. If price fails to reclaim $3,327, watch for a drop back toward $3,270, with a deeper correction targeting the $3,241–$3,211 zone.
📌 Key Levels to Watch:
Resistance:
$3,298 • $3,327 • $3,352 • $3,364 • $3,383
Support:
$3,270 • $3,241 • $3,211 • $3,179
🧠 Fundamental Focus:
This week is packed with high-impact events — including FOMC minutes on Wednesday and Non-Farm Payrolls on Friday. Both events could trigger sharp moves in gold, so stay cautious and manage risk wisely.
Going bullish on goldPrice took out sell side liquidity and has formed a BB + FVG. Looking to for a pull back during the London morning session

WTI Oil H1 | Rising into an overlap resistanceWTI oil (USOIL) is rising towards an overlap resistance and could potentially reverse off this level to drop lower.
Sell entry is at 66.82 which is an overlap resistance that aligns closely with the 23.6% Fibonacci retracement.
Stop loss is at 70.90 which is a level that sits above the 50% Fibonacci retracement and a pullback resistance.
Take profit is at 62.51 which is a multi-swing-low support.
High Risk Investment Warning
Trading Forex/CFDs on margin carries a high level of risk and may not be suitable for all investors. Leverage can work against you.
Stratos Markets Limited (tradu.com ):
CFDs are complex instruments and come with a high risk of losing money rapidly due to leverage. 63% of retail investor accounts lose money when trading CFDs with this provider. You should consider whether you understand how CFDs work and whether you can afford to take the high risk of losing your money.
Stratos Europe Ltd (tradu.com ):
CFDs are complex instruments and come with a high risk of losing money rapidly due to leverage. 63% of retail investor accounts lose money when trading CFDs with this provider. You should consider whether you understand how CFDs work and whether you can afford to take the high risk of losing your money.
Stratos Global LLC (tradu.com ):
Losses can exceed deposits.
Please be advised that the information presented on TradingView is provided to Tradu (‘Company’, ‘we’) by a third-party provider (‘TFA Global Pte Ltd’). Please be reminded that you are solely responsible for the trading decisions on your account. There is a very high degree of risk involved in trading. Any information and/or content is intended entirely for research, educational and informational purposes only and does not constitute investment or consultation advice or investment strategy. The information is not tailored to the investment needs of any specific person and therefore does not involve a consideration of any of the investment objectives, financial situation or needs of any viewer that may receive it. Kindly also note that past performance is not a reliable indicator of future results. Actual results may differ materially from those anticipated in forward-looking or past performance statements. We assume no liability as to the accuracy or completeness of any of the information and/or content provided herein and the Company cannot be held responsible for any omission, mistake nor for any loss or damage including without limitation to any loss of profit which may arise from reliance on any information supplied by TFA Global Pte Ltd.
The speaker(s) is neither an employee, agent nor representative of Tradu and is therefore acting independently. The opinions given are their own, constitute general market commentary, and do not constitute the opinion or advice of Tradu or any form of personal or investment advice. Tradu neither endorses nor guarantees offerings of third-party speakers, nor is Tradu responsible for the content, veracity or opinions of third-party speakers, presenters or participants.

Gold Is Set to Bottom Out and Rebound This WeekAt today’s open, gold once again dipped into the 3258–3248 buy zone, then rebounded toward 3270. From a structural perspective, gold has clearly entered a downward trend, but this decline is unlikely to be one-directional—short-term rebounds and consolidations are expected along the way.
Based on my experience, below 3250 remains a favorable area for initiating long positions. Whether the price rebounds directly or continues lower before building a stronger base to challenge 3300 again, the broader outlook remains bullish as long as the 3200 support holds. A bottoming reversal this week is still the more probable scenario.
As such, the focus early this week should be on buying near the lows, with short opportunities on rebounds as a secondary strategy. Monitor key support levels for signs of strength.
This week is also packed with important data—including PMI, Non-Farm Payrolls (NFP), and the unemployment rate, in addition to regular economic releases. Given the current macroeconomic backdrop, significant market volatility is expected—bringing both risk and opportunity. Manage your exposure carefully and stay adaptable.

20250630-XAUUSD IdeaAfter the price reached the 3249 level, a candlestick with a long lower shadow followed by a strong bullish candlestick was observed. The price has now returned to the descending channel. The lower timeframe shows a bullish trend, but shorting opportunities may appear around the 3295 level.
Gold trade idea for todayExpecting a nice retracement to the supply zone
follow for more trading ideas

XAUUSD AnalysisAs from the above analysed chart I can see possible reversal from the zone 3297-3310 .
So, we can dilligently hope to find our setup from the zone .
Please follow me to find out my setup .

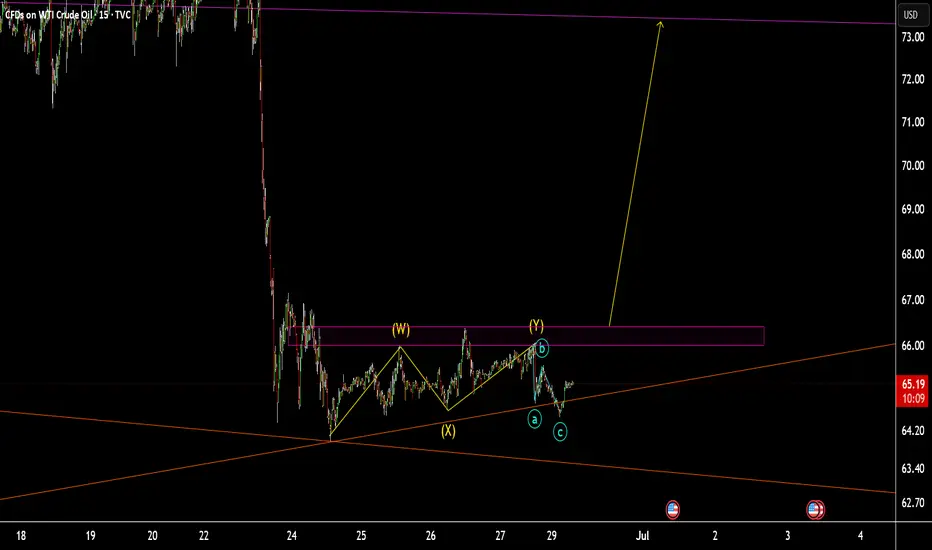
USOIL TVC:USOIL :
if it break above the purple line and shows a accumulation. so I am going to buy it.
but if it doesn't I will not open trade on it.
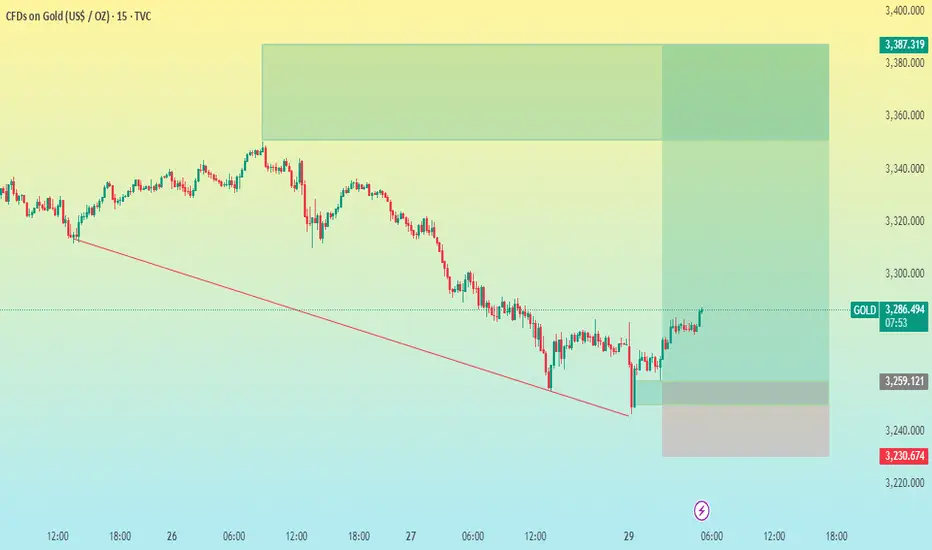
XAU/UAS 15M CHART PATTERNHere's a clear summary of your XAUUSD (Gold/USD) trade setup:
---
📈 Trade Type: Buy
Entry Price: 3285
🎯 Take Profit Levels:
TP1: 3305
TP2: 3340
TP3: 3387
🛑 Stop Loss: 3230
---
🧮 Risk/Reward Overview (from Entry 3285):
Target Distance (Pips) R:R Ratio (approx.)
TP1 (3305) +20 ~0.36:1
TP2 (3340) +55 ~1.0:1
TP3 (3387) +102 ~1.85:1
SL (3230) -55 -
---
Would you like help calculating position size, setting this up in MetaTrader, or analyzing the technical/fundamental reasoning behind this entry?
NQ Power Range Report with FIB Ext - 6/30/2025 SessionCME_MINI:NQU2025
- PR High: 22842.50
- PR Low: 22751.50
- NZ Spread: 202.75
Key scheduled economic events:
09:45 | Chicago PMI
Weekend volatility taking auction into new ATHs
Session Open Stats (As of 12:45 AM 6/30)
- Session Open ATR: 345.85
- Volume: 33K
- Open Int: 261K
- Trend Grade: Neutral
- From BA ATH: +0.1% (Rounded)
Key Levels (Rounded - Think of these as ranges)
- Long: 23239
- Mid: 21525
- Short: 20383
Keep in mind this is not speculation or a prediction. Only a report of the Power Range with Fib extensions for target hunting. Do your DD! You determine your risk tolerance. You are fully capable of making your own decisions.
BA: Back Adjusted
BuZ/BeZ: Bull Zone / Bear Zone
NZ: Neutral Zone

Copper LongsBullish Bias for copper. Looking for daily BPR target, then possibly relative equal highs.
Ideally would like to pair a bullish weekly profile with longs. If the week opens lower first and delivers to a key level, thats favoring longs. So looking for Monday, Tuesday or Wednesday to create the low of the week.
I see a daily MMBM in play. Price expanded off the breaker block. If bsl is the dol, price should expand hard of EQ of the range.

Gold Price Forecast: Bulls Defend Key Support, Eyes on TrendlineTVC:GOLD Gold (XAU/USD) bounced from the $3,261 support zone after briefly dipping to a one-month low around $3,265 in early Asian trade. The rebound came as buyers stepped in at a major demand area, rejecting further downside and suggesting bullish intent.
Macro drivers include reduced safe-haven demand following the US-China trade agreement on rare earths and a temporary ceasefire between Israel and Iran. However, expectations of a Fed rate cut—especially after weaker US consumer spending data—could limit further losses.
Technically, OANDA:XAUUSD gold has formed a double bottom around $3,261, and price action now threatens to break above a descending trendline (TL1). A confirmed breakout above minor resistance at $3,283 may open the door toward $3,311 and potentially the upper trendline near $3,330.
Key Levels to Watch:
Support: $3,261 (defended), $3,250 (monthly low)
Resistance: $3,283 (minor), $3,311 (former support turned resistance), $3,330 (TL2 trendline)
📉 Trendlines: TL1 and TL2 still capping upside; breakout would confirm bullish shift
If bulls can maintain control above $3,283 and push through the trendline, a broader recovery could follow. However, failure to clear this zone may invite renewed selling pressure.
⚠️ Disclaimer: This analysis is for informational purposes only and does not constitute investment advice.

Gold M15 Structure Plan – 3283 is the Mirror (June 30)🟡 Gold – M15 Analysis | June 30
Reflecting live market structure using principles from Chapter 9: H4–M15 Synchrony — from The Chart Is The Mirror
🔻 Setup Overview:
Gold is now trading at a M15 lower high supply zone — a short-term decision point.
Structure offers two clear possibilities :
🔸 Plan A – Short Setup
If price respects the 3283 zone and:
– M1 gives an internal structure shift
– Followed by a clean micro BOS
➡️ I’ll consider a short entry.
🔸 Plan B – Bullish Shift
If the M15 lower high breaks , it becomes a CHoCH .
Then I’ll wait for a proper BOS to confirm bullish intent.
📌 No BOS = No Trade
🧭 H4 Context Reminder:
The 4H structure still suggests price may reach the 3225 POI
before any major bullish continuation resumes.
Patience is key — let structure lead.
📖 From the Mirror Philosophy:
“Trade what the chart reflects — not what you expect.”
The market doesn’t care about bias.
It reflects your patience, discipline, and presence.
📘 Shared by @ChartIsMirror
Author of The Chart Is The Mirror — a structure-first, mindset-driven book for serious traders.

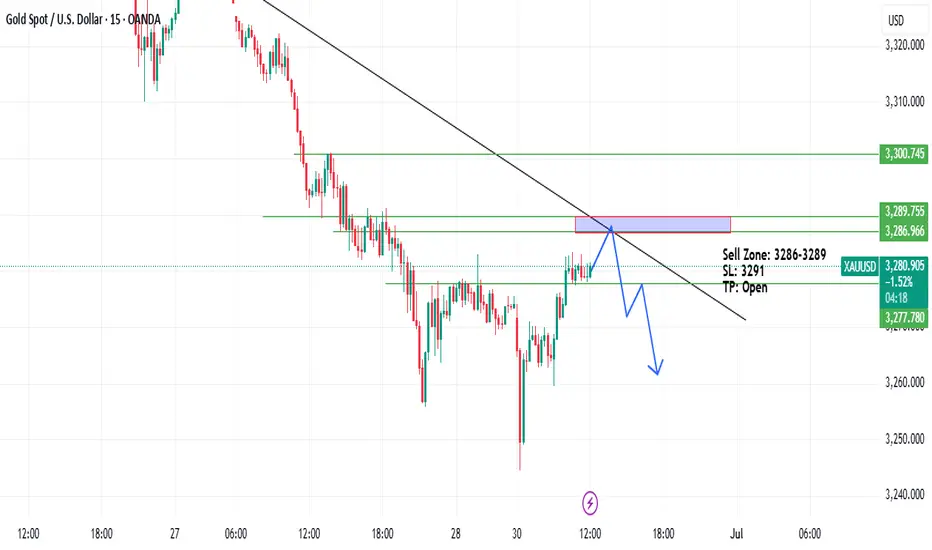
XAU/USD M15 – Intraday Bullish Setup Targeting GAP FillXAU/USD M15 – Intraday Bullish Setup Targeting GAP Fill
Gold (XAU/USD) is currently forming a bullish intraday structure after bouncing from the recent support zone. Price action suggests a potential move higher toward the gap zone near $3,324 – $3,328, which remains unfilled and acts as a key magnet for price.
🔍 Key Observations:
Support Rejection: Price bounced cleanly from a lower demand zone (around $3,259), showing strong buyer interest.
Market Structure Shift: A minor change in structure on M15 indicates a potential reversal, forming a new higher low.
GAP Zone Above: The gap around $3,324.5 – $3,328.7 offers a clear bullish target for scalpers and intraday traders.
📊 Intraday Trade Idea:
Bias: Buy (short-term)
Entry Area: ~$3,280 (buy on retracement)
Stop Loss: ~$3,259 (below recent support wick)
Take Profit: ~$3,324.5
Risk:Reward: ~1:2
⚠️ Risk Note:
Wait for a small retracement before entry to align with RR. If price breaks below $3,259, invalidate the setup as bullish momentum may weaken.
