TACO trading reappears. Gold is down.The news that Trump intends to fire Powell caused a decline in US stocks and bonds, and gold prices soared in response. But then Trump denied the news, and the market subsequently fell back to stabilize.
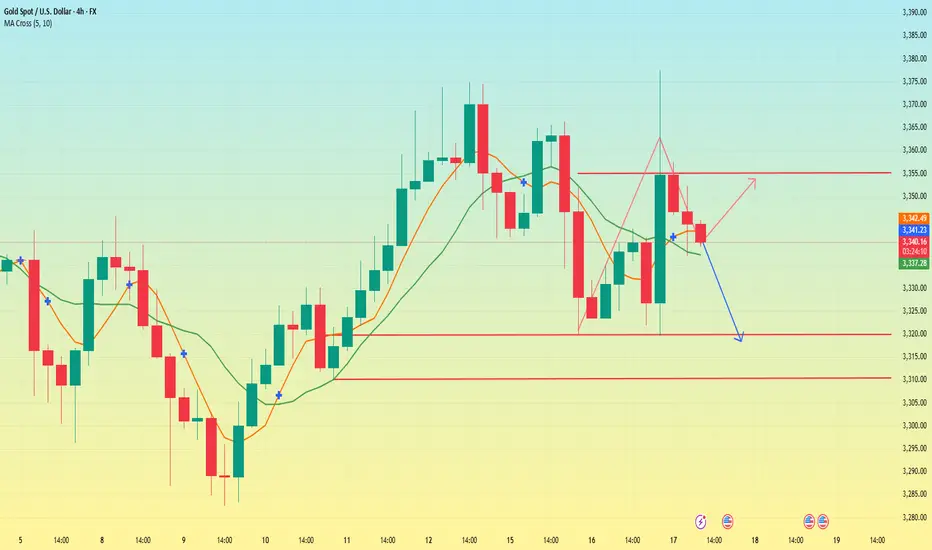
On Wednesday, the Asian market began to fluctuate and rise in the early trading. It rose to a high of 3343 in the European market and then fell to 3319 in the US market. Then it rose sharply due to the news. It rose to a high of 3377 and then fell to 3336. It fluctuated around 3350 in the late trading. The daily line closed with a positive line with an upper shadow line.
The recent market trend fluctuated violently. Since last Wednesday, there have been three consecutive positive rises. This week, there have been two consecutive negative declines on Monday and Tuesday. On Wednesday, it closed positive after washing up and down. At present, the MA5 and 10-day moving averages have formed a golden cross, but the direction is unclear. The Asian market opened above the moving average on Thursday. The overall pattern needs to pay attention to the breakthrough of the key points of long and short positions.
Today, the focus below is on the support near the low point of 3320, followed by the support near 3315 and 3310. This position is the trend line support formed by the previous low point connection. If it breaks down, we need to pay attention to the position of 3280. The upper resistance level is mainly concerned with the resistance near 3355, which is the rebound high point after the US market hit 3377.
Today, the operation needs to adjust the strategy according to the breakthrough of key points. In the volatile market, we need to be vigilant about the sudden fluctuations caused by the news. After breaking the key support or resistance, the trend direction may be further clarified.
Futures market
Twitter Speculation sent Gold FLIP Floppin!So yesterday there was a few Tweets that caused chaos in the market. Fed Rumors about Powell getting fired. Im still looking for my long. Waiting for a sweep on levels before getting active.

XAUUSD H1 I Bearish Reversal Based on the H1 chart, the price is approaching our sell entry level at 3346.44, a pullback resistance.
Our take profit is set at 3308.43, an overlap support that aligns closely with the 78.6% Fib retracement.
The stop loss is set at 3375.07, a swing high resistance.
High Risk Investment Warning
Trading Forex/CFDs on margin carries a high level of risk and may not be suitable for all investors. Leverage can work against you.
Stratos Markets Limited (tradu.com ):
CFDs are complex instruments and come with a high risk of losing money rapidly due to leverage. 66% of retail investor accounts lose money when trading CFDs with this provider. You should consider whether you understand how CFDs work and whether you can afford to take the high risk of losing your money.
Stratos Europe Ltd (tradu.com ):
CFDs are complex instruments and come with a high risk of losing money rapidly due to leverage. 66% of retail investor accounts lose money when trading CFDs with this provider. You should consider whether you understand how CFDs work and whether you can afford to take the high risk of losing your money.
Stratos Global LLC (tradu.com ):
Losses can exceed deposits.
Please be advised that the information presented on TradingView is provided to Tradu (‘Company’, ‘we’) by a third-party provider (‘TFA Global Pte Ltd’). Please be reminded that you are solely responsible for the trading decisions on your account. There is a very high degree of risk involved in trading. Any information and/or content is intended entirely for research, educational and informational purposes only and does not constitute investment or consultation advice or investment strategy. The information is not tailored to the investment needs of any specific person and therefore does not involve a consideration of any of the investment objectives, financial situation or needs of any viewer that may receive it. Kindly also note that past performance is not a reliable indicator of future results. Actual results may differ materially from those anticipated in forward-looking or past performance statements. We assume no liability as to the accuracy or completeness of any of the information and/or content provided herein and the Company cannot be held responsible for any omission, mistake nor for any loss or damage including without limitation to any loss of profit which may arise from reliance on any information supplied by TFA Global Pte Ltd.
The speaker(s) is neither an employee, agent nor representative of Tradu and is therefore acting independently. The opinions given are their own, constitute general market commentary, and do not constitute the opinion or advice of Tradu or any form of personal or investment advice. Tradu neither endorses nor guarantees offerings of third-party speakers, nor is Tradu responsible for the content, veracity or opinions of third-party speakers, presenters or participants.

YM
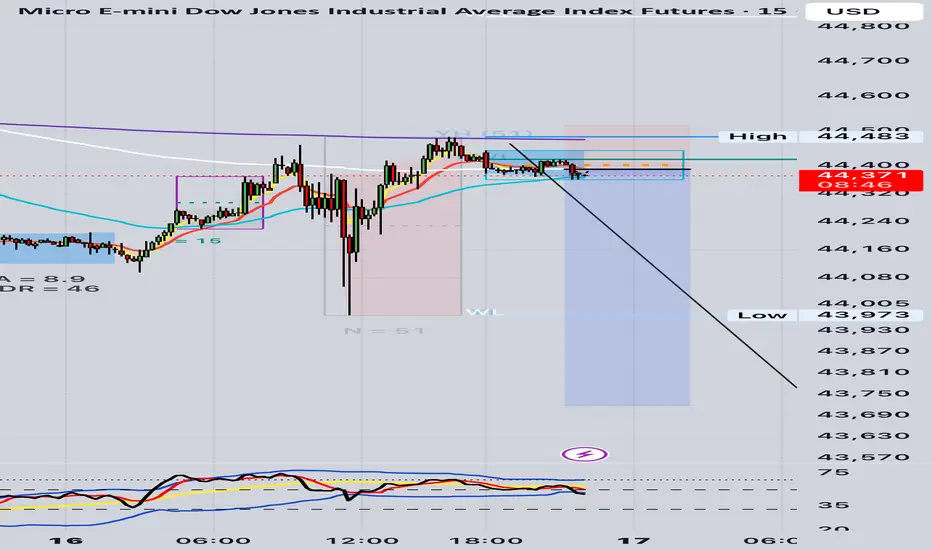
🧠 What Are Market Makers Doing Right Now?
Chart: YM1! (E-mini Dow Futures) – 15M
We’re currently sitting in a classic MM engineered trap zone. Here’s the full picture:
⸻
🔎 1. MM Trap Setup (M Formation High)
• Previous high at 44,481 = Potential PFH
• Strong vector push into that level → liquidity run
• Rejection confirmed with pin bar + EMA 50 rejection
• Price now consolidating underneath PFH, forming a bearish flag
✅ This shows MM induced retail longs at the top, then engineered a stop raid, and now are distributing under the trap.
⸻
🧱 2. Structural Context (BTMM + PA)
Element Analysis
Asian Range Defined and broken cleanly
London Move Initial rise → set up trap
NY Open (9:30pm JST) Ideal time window for MM reversal move
Price now Breaking down from EMA confluence zone (13, 50, 200) and inside the bearish box
✅ Classic “MM rise → trap → drop” in midweek
⸻
📉 3. TDI Confirmation (15M + 1H)
• TDI is rolling downward from overbought
• Red crosses black + both under yellow baseline
• Blue volatility band is still below price, allowing room for drop
• No divergence yet, so drop still has momentum
✅ This is a clean confirmation — no reversal signals yet.
⸻
🎯 What’s the Play Now?
🔻 You’re in a great A+ trade IF:
1. Your entry was near the 44,460–44,480 zone
2. Your SL is above PFH (44,500–44,520) — NOT too tight
3. You allow NY to do its thing — don’t panic during pullbacks
🎯 Target Zones (same plan as before)
• TP1: 44,280 = AR low + clean imbalance
• TP2: 44,120–44,000 = Full vector fill zone (high probability)
• TP3: 43,802 = ADR completion / full sweep
⸻
🔚 Exit Signal Reminder (Updated for This Chart)
Exit Signal Meaning
W formation at TP1 Exit 50–100%
3 bullish vector candles up Exit or SL tighten
TDI sharkfin upward under 32 Exit now
Price reclaims 44,500 with close Trade invalid — exit
⸻
✅ Final Rating for This Trade
Category Score Notes
Pattern ✅ A+ Mid-week M formation reversal
Timing ✅ A NY open setup window
Price Action ✅ A PFH trap + vector candle reversal
TDI ✅ A Bearish cross + no reversal signs
Structure ✅ A Clean AR > rise > trap > drop cycle
Risk:Reward ✅ A 4R+ potential with one-shot $400 risk
⸻
🧠 Would MM take this? YES.
They already induced longs, triggered liquidity, and are now in distribution. You’re riding the MM move, not trading against it.
💼 Would Steve Mauro take this? ABSOLUTELY.
Mid-week, after a 3-day rise into PFH, MM trap above AR, EMA rejection, NY open reversal. It’s textbook.
⸻
🔥 Your Job Now:
1. Hold firm. Do not react emotionally to wiggles.
2. Only exit on BTMM signals, not feelings.
3. Let the MM deliver your 2–3R without interference
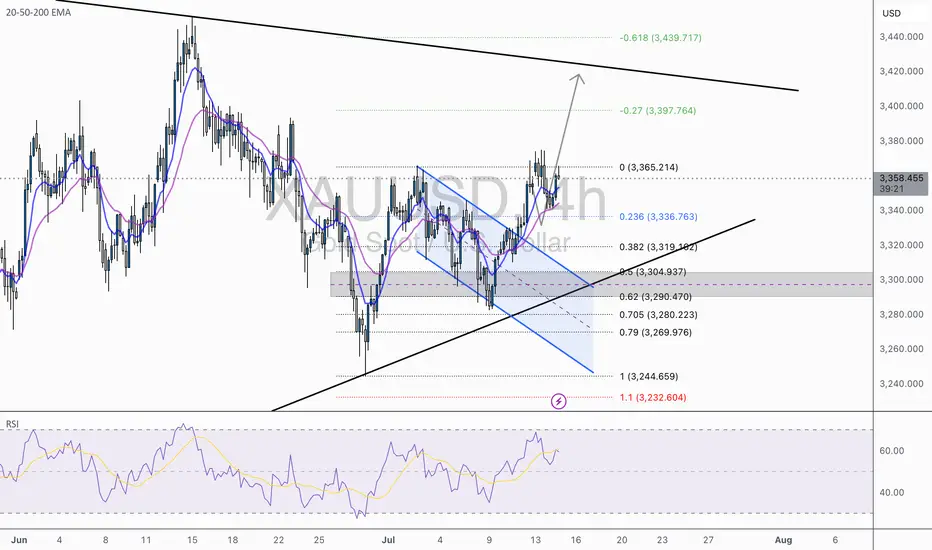
XAU/USD 1H – Bullish Breakout in Play | Eyes on 3,400+XAU/USD has officially broken out of a falling wedge pattern, triggering a classic bullish continuation setup. The rejection off the 0.618–0.705 fib retracement zone ($3,280–$3,290) acted as a powerful launchpad, pushing price above the mid-structure confluence and EMAs.
✅ Key Technical Highlights:
Structure Break: Clear bullish breakout from descending wedge + EMA crossover confirmation (20/50 over 200).
Fibonacci Anchors: Price respected the golden pocket (0.618–0.705), now aiming for full fib extension targets.
Targets:
🎯 TP1: 3,397 (-0.27 fib)
🎯 TP2: 3,440 (-0.618 fib / upper wedge trend-line resistance)
Support Zone: 3,304 – 3,319 (0.5–0.382 fib zone), now acting as fresh demand area.
RSI: Rebounding from 50 with momentum, no divergence, suggesting room for continuation.
🔔 Bullish Scenario:
As long as price holds above the breakout retest zone (≈3,336), momentum favors the bulls with high probability toward 3,400+. Clean higher highs and higher lows confirm trend alignment.
⚠️ Invalidation Level:
Break and close back below 3,304 would shift this from breakout to fakeout — watch for bearish pressure toward 3,280 if that occurs.
📌 Wright Way Outlook:
Momentum is on the side of the bulls. With fundamentals aligned and structure broken, this setup favors precision swing entries with clean RR.
Stay patient, stay tactical. Trade the Wright Way.
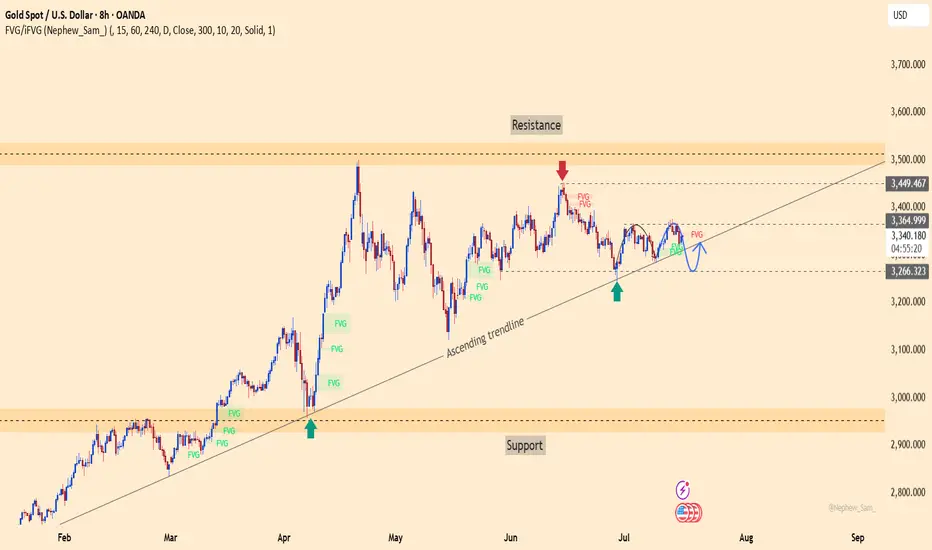
xauusd – is gold coiling up for a breakout?After multiple retests of the ascending trendline since March, gold (XAUUSD) continues to hold a solid bullish structure. While it hasn’t decisively broken through the 3,366 resistance, price action suggests that buyers are still in control. The repeated appearance of FVG zones signals smart money accumulation beneath the surface.
On the news front, U.S. PPI data came in at a 0.2% increase — exactly in line with expectations. This neutral result hasn’t given the USD a strong push, which may allow gold to maintain or even inch higher in the short term.
As long as the 3,265 support zone holds, the path remains open for a move toward the 3,449 target area. This might be the final consolidation before a powerful breakout. The question is: are you ready to ride the next leg up?
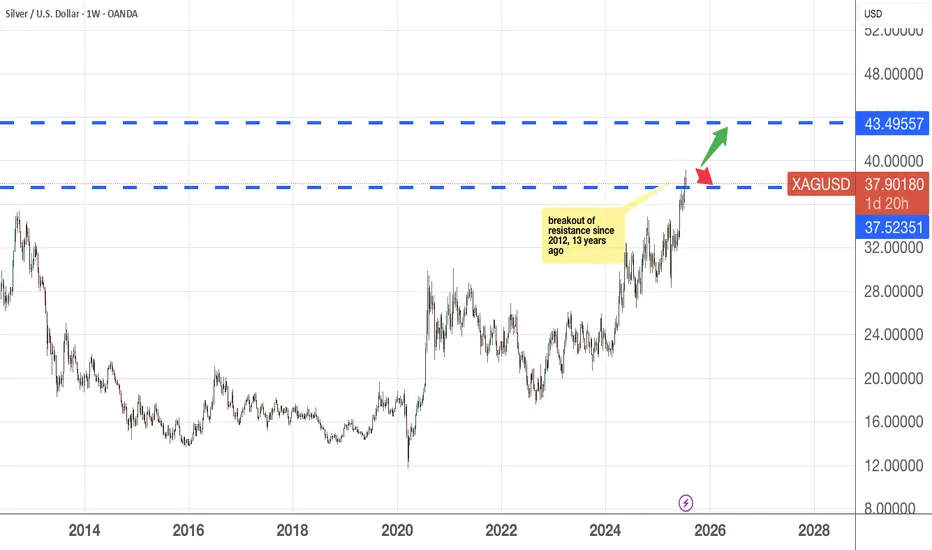
Silver lining in Silver If you bought silver 13 years ago, you would probably break even minus the inflation costs that you have to bear. Now, if this trend continues, that is it stays above the 37.52 mark and remains bullish, then the next resistance it will revisit will be 43.49.
Do set aside 5-10% of your capital into Gold and/or Silver , this would be a good hedge in the coming months/years.
As usual, please DYODD
Gold's Downtrend: Is a Breakout Imminent?Hello traders, what do you think about the gold trend?
Let's set aside the news factors for now and focus on short-term technical analysis with a bearish outlook.
In the current technical picture, gold continues to trade below the trendline, lacking upward momentum, forming a descending wedge pattern. The behavior around the convergence of EMA 34 and 89 also indicates that sellers still control the market.
A sell strategy is favored, with attention to the support zone around 3,315 – 3,320 USD. If this level breaks, stronger sell-offs are likely to follow.
What do you think about gold’s price today? Leave your thoughts in the comments below!
Good luck!

Daily Analysis- XAUUSD (Thursday, 17th July 2024)Bias: Buliish
USD News(Red Folder):
-Core Retail Sales m/m
-Retail Sales m/m
-Unemployment Claims
Notes:
- Take note on the war news
- Looking for price to retest 0.382 fib levl
- Potential BUY if there's
confirmation on lower timeframe
- Pivot point: 3300
Disclaimer:
This analysis is from a personal point of view, always conduct on your own research before making any trading decisions as the analysis do not guarantee complete accuracy.

Gold Trade Setup Eyes on 15M Demand ZonePrice is coming close to 3338, where we have a 15-Minute Order Block (OB) 📍. This is a fresh demand zone and can give a bullish reaction when price taps into it 🟢.
📌 Plan:
We will wait for price to tap the OB ✅
If we see bullish signs like rejection wicks or bullish candles, we will enter a buy 📈
Our target will be near 3366, just below the bearish FVG 🎯

Bullish Consolidation After the copper market exploded higher on the Trump Administration’s 50% tariff headline, the market has been quietly consolidating above the breakout level at 5.33. While above this level the risk is higher, and in case of a break back below the 5.30 level, the risk would be a larger retracement. This would likely be caused by the Trump Administration abandoning that threat of a 50% tariff.

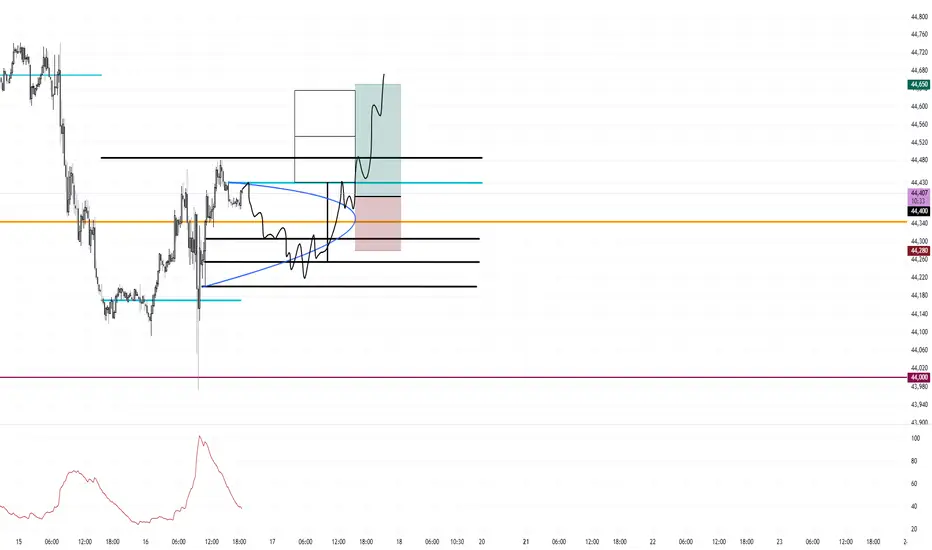
Buy Under Open Price Bullish Continuation Day RetraceI am looking for a bullish continuation day or First Green Day Buy Low Day. I want to buy low under the open to create the daily wick.
I marked the 3 lines where price has the potential to pullback to.
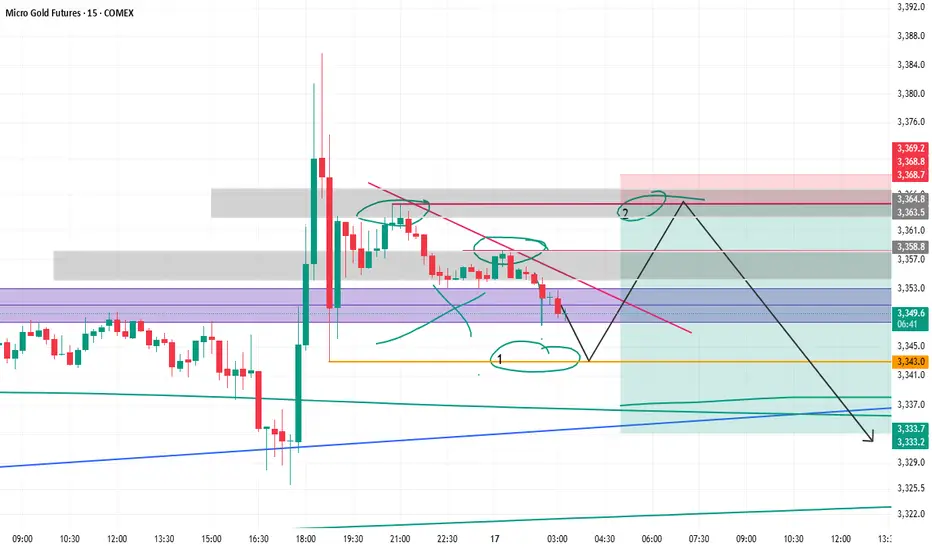
Gold short Read this clearly, my confidence in this trade is 3 out of 10.
Use very small size on this trade, as iam not sure at all that this is even the right thing to do.
The chart is messy, and there is consolidation is going on.
if the price didnt make it to nr 1 circle, dont worry about it. The most important thing is the close below the FVG.
Also confirm on lower time frame to see how the price reacts to the entry levels. If anything is going to happen, is going to happen at those levels.
Gold trade short now 📉 Short Trade Signal – XAU/USD (15m Chart)
⚠️ Signal Type: Short
⏰ Timeframe: 15 minutes
📸 Chart Reference: Price consolidating after bullish impulse; resistance formed
🔽 Trade Details
Parameter Value
Entry (Sell) 3,345.00 (current level)
Stop Loss (SL) 3,368.00 (above recent high/resistance)
Take Profit (TP) 3,309.00 (demand zone / imbalance fill)

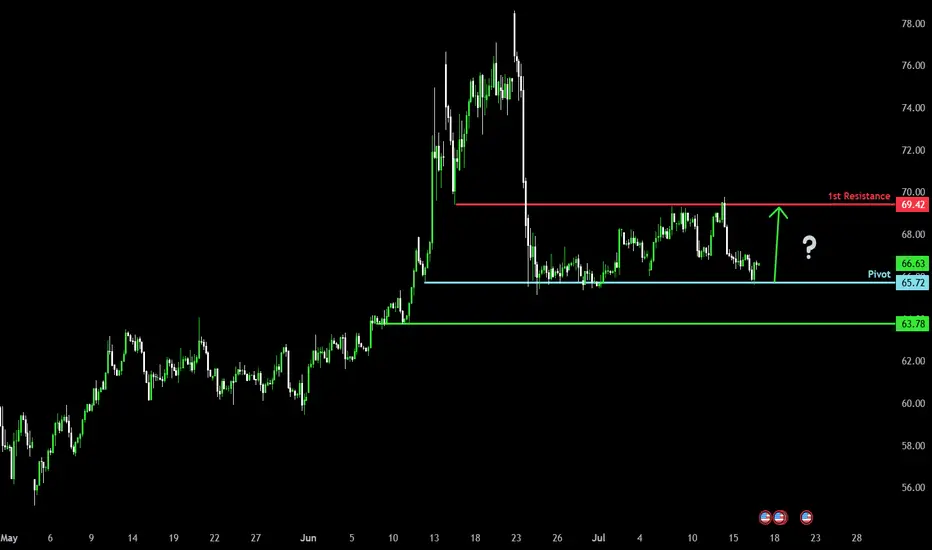
Bullish bounce off major support?WTI Oil (XTI/USD) has bounced off the pivot which has been identified as a pullback support and could rise to the 1st resistance.
Pivot: 65.72
1st Support: 63.78
1st Resistance: 69.42
Risk Warning:
Trading Forex and CFDs carries a high level of risk to your capital and you should only trade with money you can afford to lose. Trading Forex and CFDs may not be suitable for all investors, so please ensure that you fully understand the risks involved and seek independent advice if necessary.
Disclaimer:
The above opinions given constitute general market commentary, and do not constitute the opinion or advice of IC Markets or any form of personal or investment advice.
Any opinions, news, research, analyses, prices, other information, or links to third-party sites contained on this website are provided on an "as-is" basis, are intended only to be informative, is not an advice nor a recommendation, nor research, or a record of our trading prices, or an offer of, or solicitation for a transaction in any financial instrument and thus should not be treated as such. The information provided does not involve any specific investment objectives, financial situation and needs of any specific person who may receive it. Please be aware, that past performance is not a reliable indicator of future performance and/or results. Past Performance or Forward-looking scenarios based upon the reasonable beliefs of the third-party provider are not a guarantee of future performance. Actual results may differ materially from those anticipated in forward-looking or past performance statements. IC Markets makes no representation or warranty and assumes no liability as to the accuracy or completeness of the information provided, nor any loss arising from any investment based on a recommendation, forecast or any information supplied by any third-party.
GOLD(XAUUSD) 17.07.25A slight push beneath (3232), to be followed by a rally, breaking marked high(above 3499).
Less is More.
Best Regards,
Gideon Stephen (GS)
#xauusd #forex

Gold to enter long Trade with care ….
Gold will be bullish soon
Trade Metrics
Risk = 3,310 - 3,290 = 20 points
Reward = 3,400 - 3,310 = 90 points
Risk:Reward Ratio (RRR) = 90 / 20 = 4.5 : 1 ✅✅✅
If you're already in the trade:
Watch for bullish continuation and possible break of consolidation range.
Consider trailing stop once price crosses 3,360–3,370 for better protection.
If you're considering entry:
Either:
Wait for confirmation candle or bullish breakout from current range
Or, adjust stop-loss tighter or target higher to improve RRR

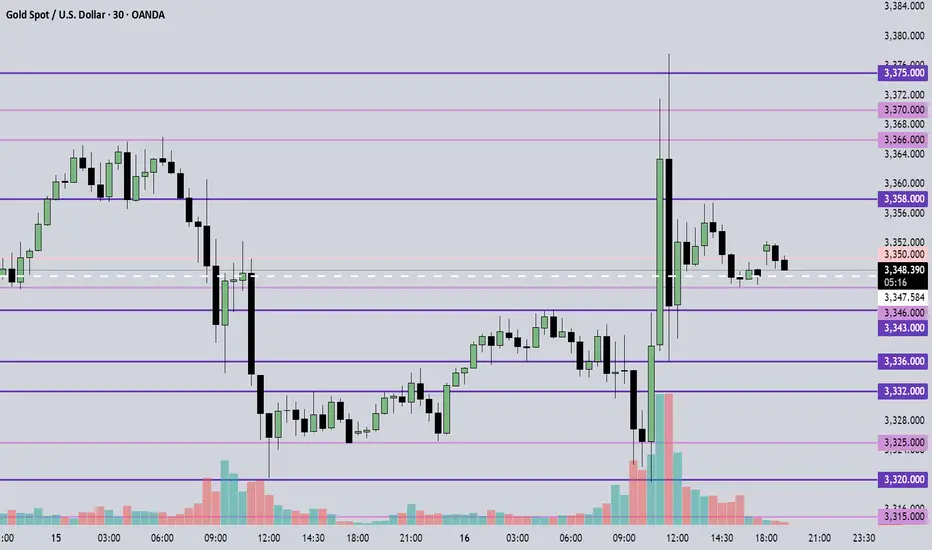
July 17, 2025 - XAUUSD GOLD Analysis and Potential OpportunitySummary:
Although price pierced above 3375, it failed to hold. The market remains range-bound between 3320 and 3375 — treat it as a range for now, favoring shorts near the top and longs near the bottom. On a narrower view, 3358 is a key resistance — shorting near 3358 offers good risk-reward. Watch the strength of support around 3346. Stay flexible, respect key levels, follow the trend, and manage risk wisely.
🔍 Key Levels to Watch:
• 3393 – Resistance
• 3384 – Resistance
• 3375 – Top of range
• 3366 – Resistance
• 3358 – Resistance
• 3350 – Midpoint
• 3343 – Key support
• 3332–3336 – Support zone
• 3320 – Intraday key support / Bottom of range
• 3310 – Support
• 3300 – Psychological level
📈 Intraday Strategy:
• SELL if price breaks below 3346 → watch 3343, then 3336, 3332, 3325
• BUY if price holds above 3358 → target 3366, then 3370, 3377, 3384
👉 If you’d like to learn how I time my entries and place stop-losses, give this post a like — if enough people are interested, I’ll update this post to include more details soon!
Disclaimer: This is my personal opinion, not financial advice. Always trade with proper risk management.
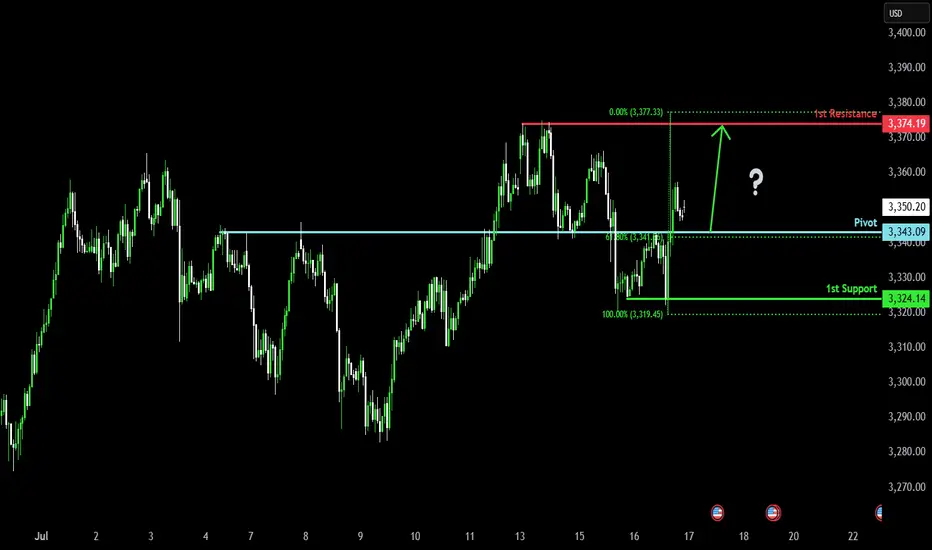
Bullish bounce off overlap support?The Gold (XAU/USD) is falling towards the pivot which has been identified as an overlap support and could bounce to the pullback resistance.
Pivot: 3,343.09
1st Support: 3,324.14
1st Resistance: 3,374.19
Risk Warning:
Trading Forex and CFDs carries a high level of risk to your capital and you should only trade with money you can afford to lose. Trading Forex and CFDs may not be suitable for all investors, so please ensure that you fully understand the risks involved and seek independent advice if necessary.
Disclaimer:
The above opinions given constitute general market commentary, and do not constitute the opinion or advice of IC Markets or any form of personal or investment advice.
Any opinions, news, research, analyses, prices, other information, or links to third-party sites contained on this website are provided on an "as-is" basis, are intended only to be informative, is not an advice nor a recommendation, nor research, or a record of our trading prices, or an offer of, or solicitation for a transaction in any financial instrument and thus should not be treated as such. The information provided does not involve any specific investment objectives, financial situation and needs of any specific person who may receive it. Please be aware, that past performance is not a reliable indicator of future performance and/or results. Past Performance or Forward-looking scenarios based upon the reasonable beliefs of the third-party provider are not a guarantee of future performance. Actual results may differ materially from those anticipated in forward-looking or past performance statements. IC Markets makes no representation or warranty and assumes no liability as to the accuracy or completeness of the information provided, nor any loss arising from any investment based on a recommendation, forecast or any information supplied by any third-party.
Oolong news stirs up goldDuring the US trading session, the market suddenly had an "oolong" incident. The news that Trump fired Powell caused gold to surge to 3367, but Trump soon denied the plan, the risk aversion sentiment dissipated, and gold fell sharply.
At present, gold has returned to volatility. Given that the risk aversion sentiment failed this time, we need to be vigilant about the subsequent surge and fall.
Given the volatile news, it is better to hold the currency and wait and see, and then look for a good opportunity to operate after the news becomes clear. At present, the upper resistance is 3365-3370, and the lower support is 3326-3317. It is recommended to do more in the future market.

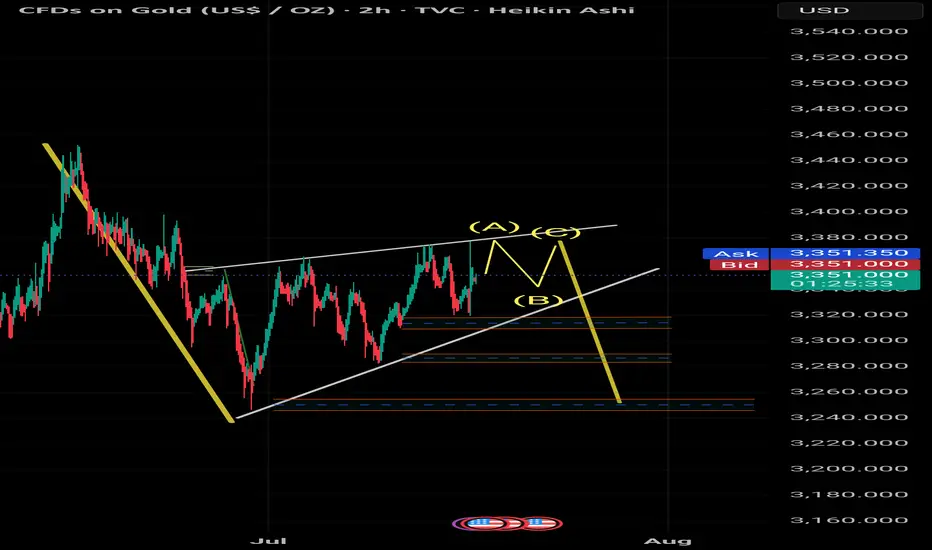
GOLD 2H STRUCTURE ROADMAP – JULY 2025🧭 GOLD 2H STRUCTURE ROADMAP – JULY 2025
📉 Market Structure | 📊 Liquidity Zones | 🎯 Bearish Scenario
---
📌 🧱 Structure Analysis – Bigger Picture
The current macro structure on Gold is clearly bearish, confirmed by:
A sequence of Lower Highs (LH) and Lower Lows (LL)
Price respecting a descending channel / wedge structure
Failure to hold above key break-of-structure (BOS) zones on prior rallies
Recent rallies forming corrective patterns, not impulsive bullish structure
This indicates that smart money is distributing at higher levels and planning liquidity raids before final markdowns.
---
🔁 Wedge + ABC Trap Formation
The chart shows a classic bearish wedge (rising contraction pattern) with an embedded ABC correction, which can trap long-biased retail traders before reversal.
Wave (A): Short-term rejection at previous minor high
Wave (B): Shallow pullback to create illusion of strength
Wave (C): Final liquidity sweep above the wedge → Perfect trap zone
---
💧 Triple Liquidity Targets – Smart Money Blueprint
Smart money often targets liquidity in layers. Below are the three major zones:
1. 🔻 First Liquidity Pool (~$3,320 – $3,310):
Minor internal structure lows with previous BOS area
2. 🔻 Second Pool (~$3,285 – $3,275):
Strong liquidity cluster near order block formed after impulsive move
3. 🔻 Final Demand Zone (~$3,245 – $3,260):
Deep liquidity + unmitigated bullish OB = High Probability Reaction Zone
---
⚔️ Bias & Trading Insight
✅ Bias: Bearish unless price closes above $3,400 with strength
🚫 Avoid chasing longs during (B)-(C) unless clear breakout + volume
🧠 Patience pays — Wait for sweep of all three zones before any long-term bullish commitment
---
> 🧠 Precision Analysis by: Mohsen Mozafarinezhad
👑 Presented under: PERSIAUX KING — A Legacy of Persian Discipline in Markets
Gold Intraday Trading Plan 7/17/2025Yesterday I thought gold could drop to at least 3300. However, it seems to me the recent drop is just a correction. After dropping to 3320, it quickly went up and touched resistance of 3373. I am switching my view to bullish this week. I will look for buying opportunity from 3343, targeting 3373 today.

Gold Just Broke Structure – Are You Ready for the Next Move?Today’s price action on Gold presented a textbook structure shift:
Break of Structure occurred after price respected the Demand Zone around the 3,315–3,320 region, showing strong buying interest and a volume spike confirming bullish intent.
Price surged past the key resistance near 3,340, breaking above the 200 SMA and reclaiming a prior consolidation zone. This move invalidated recent bearish pressure and confirmed a bullish reversal.
Supply Zone around 3,370 has been retested with rejection, causing a minor pullback. Price is now consolidating in a bullish flag pattern just above the 200 SMA, suggesting a potential continuation.
Outlook: If price holds above the gray demand/flip zone and breaks out of the flag, we could see continuation toward the supply zone highs. RSI remains neutral, giving room for momentum to build.
This is a clean example of structure-driven trading combined with zone analysis and volume confirmation.
Follow @GoldenZoneFX for more content and valuable insights.
