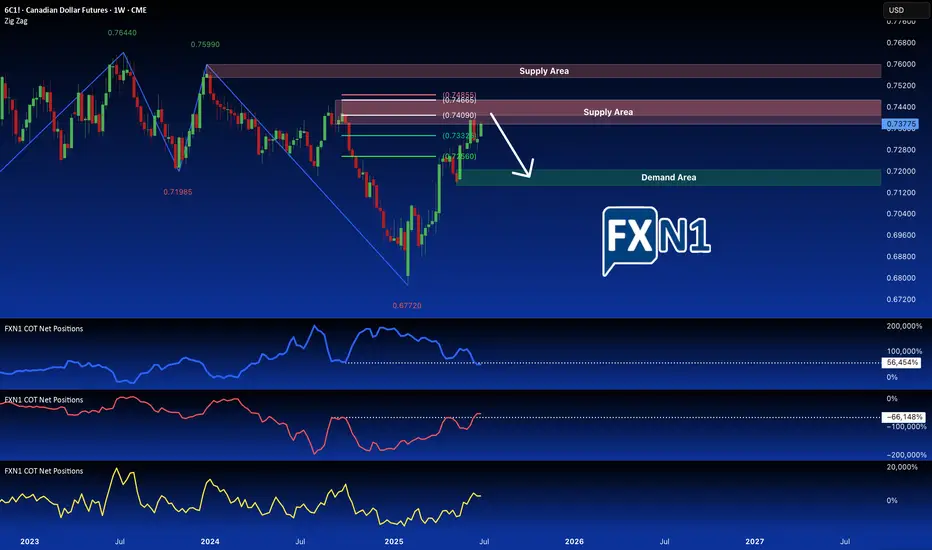
Canadian Dollar Futures (6C1!) Nears Key Monthly SupplyThe Canadian Dollar Futures (6C1!) remain in a downtrend, now testing a critical monthly supply zone after an initial rejection. With Commercials heavily short, Smart Money flat, and Retail traders still bullish, this setup favors another potential downside move. Traders should watch for a retest or breakout spike for optimal short entries.
COT Report: Who’s Betting on the Loonie?
Commercials (Big Players): Increasing short positions, signaling expectations of further downside.
Non-Commercials (Smart Money): Flat, showing hesitation—no strong conviction in either direction.
Retail Traders: Still net long, often a contrarian indicator at key turning points.
This alignment suggests that while momentum may see short-term bounces, the broader trend remains bearish.
✅ Please share your thoughts about 6C1! in the comments section below and HIT LIKE if you appreciate my analysis. Don't forget to FOLLOW ME; you will help us a lot with this small contribution.
Futures market
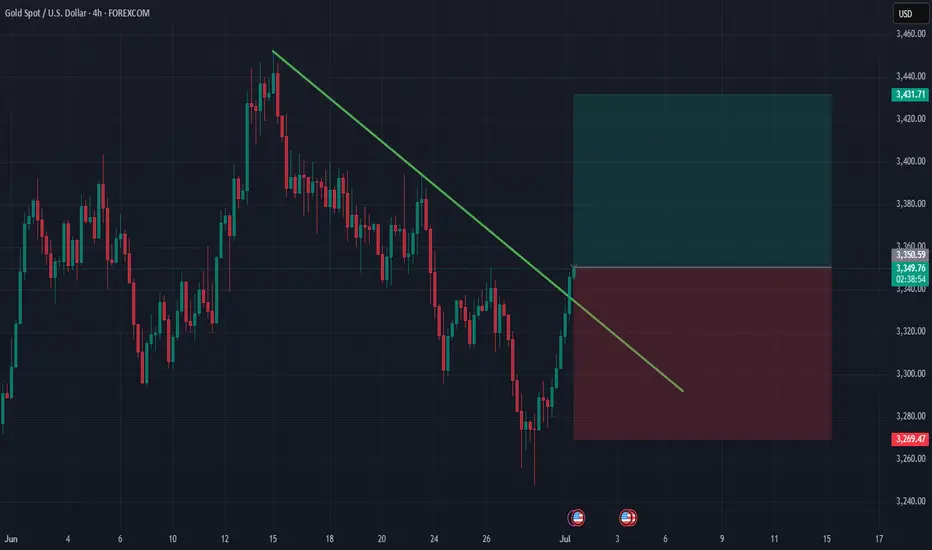
Gold Bulls Ready to Charge: $3,500 Target Could Be Days AwayThe chart shows a strong medium-term uptrend in gold that began in late 2024, carrying the price steadily higher through the first half of 2025. After peaking, price has been consolidating in a clear range bounded by a well-defined resistance and support zone.
The Resistance Zone is marked around $3,438, where price has been repeatedly rejected. Each time the market approached this level, sellers stepped in, causing retracements. This reinforces the area as a significant supply zone.
Below, the Support Region near $3,249–$3,250 has provided a floor for price action. It’s notable that this area was once a resistance, making it a classic breakout-retest structure. Buyers have stepped in multiple times to defend this level, indicating healthy demand that aligns with the broader bullish trend.
The recent candles suggest the market is trying to build momentum for another test of the resistance. Wick rejections near support indicate that buyers are showing interest again. At the same time, the overall structure remains constructive, with higher highs and higher lows visible on the longer timeframe.
The Price-Volume Trend (PVT) indicator along the bottom is gradually climbing, which suggests accumulation is still happening beneath the surface. This can be a signal that a fresh breakout attempt is brewing.
Trade Setup
Here’s how the trade idea is structured visually on your chart:
• Entry Zone: Around $3,348, near the midrange and just above support.
• Stop-Loss: ~99 points below the support area (around $3,249), offering a cushion against volatility.
• Target: Approximately $3,555–$3,560, the next major resistance above the current consolidation.
• Reward Potential: ~207 points (6.19%) upside.
• Risk-Reward Ratio: ~2.09, which is a favorable setup for a trend continuation trade.
Analysis Summary
This is effectively a range-bound bullish continuation setup. The idea is to enter on support retest and ride the next impulse leg higher. Price is consolidating above the former breakout area, with clear evidence of accumulation on the PVT. If gold can close convincingly above $3,438, it will likely trigger breakout buying interest and stop-loss clusters from short sellers, which could drive price rapidly toward your target.
However, keep in mind that failure to hold above $3,249 support would invalidate the setup and could lead to a deeper correction or range breakdown. For this reason, your stop-loss level is well-placed to limit risk.

GOLD///LONGHello. Gold is braking trend line on 4h time frame, it also looks good on weekly and daily chart. Long with 1:1 risk to reward. GL
XAUUSD:Go long
Gold continued to strengthen in the Asian session, mainly due to adverse signals from tariff talks, which spurred a sharp rebound in gold prices. At present in the 3340 near the shock, this position is a short - term small pressure, from the technical trend, is still a strong long arrangement, so I think continue to break up is inevitable. Above you can look at 3350 first, then 3368/3390.
My idea is to wait for a pullback after entering the long, at present, there is not much room for a pullback, and under the strong market, there are fewer opportunities, so you can consider the first 3336-40 direct layout of long orders. If there is a certain range of retracement to consider adding positions.
Trading Strategy:
BUY@3336-40
TP:3349-54
More detailed strategies and trading will be notified here ↗↗↗
Keep updated, come to "get" ↗↗↗

XBRUSD is testing the Support Level 66.10 👀 Possible scenario:
Oil prices were steady on July 1 as investors awaited the expected OPEC+ decision to raise output by 411,000 bpd in August. If confirmed at the July 6 meeting, it would bring this year’s total increase to 1.78 million bpd—over 1.5% of global demand.
The move, led by Saudi Arabia, aims to curb overproduction and regain market share. Meanwhile, easing geopolitical tensions and weak Chinese manufacturing data added downward pressure. Trade talks also remain in focus ahead of Trump’s July 9 tariff deadline, which could raise global trade uncertainty. Morgan Stanley sees Brent falling to $60 by early 2026 on oversupply and waning risks.
✅ Support and Resistance Levels
Now, the support level is located at 66.10.
Resistance levels are now located at 77.50 .

Gold Rebounds on Dollar Weakness Eyes Key Resistance Gold has recouped 70% of its prior week's losses, driven by dollar weakness ahead of key events: Powell's speech, PMI data, and JOLTs job openings. Breaking out of its average daily range (ADR), gold trades above the $3,350 liquidity zone. Investors await fundamental data for direction. If the data favors the dollar or Powell's tone remains hawkish, gold may dip to $3,334-$3,300. Conversely, a favorable outcome could propel gold towards $3,380-$3,400 resistance levels with minimal pullback.

XAUUSD on reversel needs correction H4 Timeframe Analysis
Gold is currently holding the bullish reversal on opening of new Month Candle.As we can see gold is Overbought on Daily candle .
What's possible scanarios we have?
BULLISH SCANARIO:
As we have seen h4 candle closes above 3335 structural resistance, If the H1-H4 candle remains above 3345 then our targets we'll be 3365 then 3380.
BEARISH SCANARIO: (PREFERRED)
On the otherhand im expecting that gold needs correction at atleast 3315-3305 area if The H4 candle closes below 3330 then buying will be limited and market will join the 3290 then 3280.
#XAUUSD

Bullish Reversal Setup on GOLD/USD Bullish Reversal Setup on GOLD/USD 💰📈
🔍 Chart Analysis:
The chart illustrates a clear bullish reversal structure forming off a strong support zone:
📌 Key Observations:
Multiple Rejections at Support 🟠
The price has reacted to the 3,300 - 3,280 USD support zone multiple times, forming a triple bottom pattern, indicating strong buyer interest.
Bullish Harmonic Pattern ✅
A bullish harmonic pattern (likely a Bat or Gartley) completed right at the support level, triggering a strong reversal with a bullish engulfing candle.
Break of Minor Structure 📊
Price broke through minor resistance near 3,340 USD, confirming bullish momentum. The breakout is supported by a retest shown with the green arrow 🟢.
Target Point Identified 🎯
The projected target is 3,460 USD, marked clearly as the next significant resistance zone. This aligns with previous price rejection areas, making it a high-probability target.
📈 Trading Outlook:
✅ Buy Confirmation: Break and retest of 3,340 USD zone.
🎯 Target: 3,460 USD.
🛡️ Support Zone: 3,300 – 3,280 USD (watch for any breakdown below this).
📌 Conclusion:
The chart signals a high-probability bullish continuation, with strong support, harmonic confluence, and structural breakout. Traders may look for buy opportunities on pullbacks with the target set at 3,460 USD. 🚀📊

Gold is unilaterally upward during the dayGold, the general trend is as described in the morning analysis. The price fell from the 3452 high point in this round. On Monday, it rebounded quickly after parallel attack and defense near 3245. The article emphasizes that the short-term strength will continue. The high point of the week may appear around Thursday's non-agricultural data. The medium-term top idea of 3500-3452 is still maintained;
It actually opened unilaterally upward from 3303 during the day and is now reported at 3340; the bullish pattern of each cycle is good, and there will be a high in the evening; short-term support is 3338, strong support is 3332; short-term resistance is 3350-3356, strong resistance is 3365-3374;

NQ NY Session longBy the looks of the London Session for NQ, it seems to be a Manipulation to prepare a reversal Long in the NY Session

SILVER Will Move Higher! Long!
Please, check our technical outlook for SILVER.
Time Frame: 8h
Current Trend: Bullish
Sentiment: Oversold (based on 7-period RSI)
Forecast: Bullish
The price is testing a key support 3,639.6.
Current market trend & oversold RSI makes me think that buyers will push the price. I will anticipate a bullish movement at least to 3,732.0 level.
P.S
The term oversold refers to a condition where an asset has traded lower in price and has the potential for a price bounce.
Overbought refers to market scenarios where the instrument is traded considerably higher than its fair value. Overvaluation is caused by market sentiments when there is positive news.
Disclosure: I am part of Trade Nation's Influencer program and receive a monthly fee for using their TradingView charts in my analysis.
Like and subscribe and comment my ideas if you enjoy them!
XAUUSD SELL OR BUY (READ CAPTION)Hi trader's what do you think about gold
current price: 3340
gold is rest now in resistance zone i think gold retest down side and giving retrcement
resistance zone 3345_3350
target point :3316_3310
stop loss 3362
please like comment and follow thank you

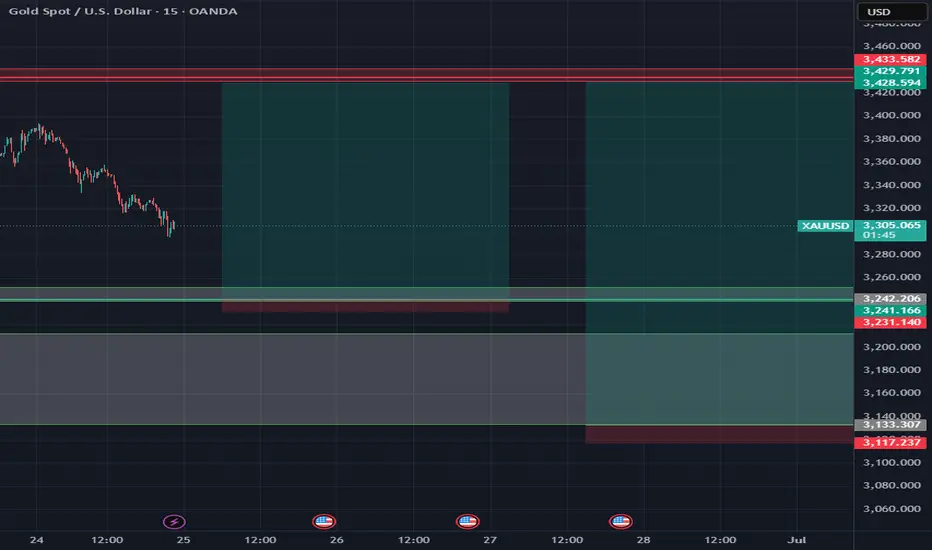
Sell signal I'm anticipating gold to reach to the Grey shaded area and reject from there, it should show us willingness to sell then I'll update you guys for the target(monthly low)

XAUUSD Analysis – 01/07: Gold Sees a Rebound Amid USD WeaknessXAUUSD Analysis – 01/07: Gold Sees a Rebound Amid USD Weakness – Is a Recovery on the Cards?
As we enter the new month, gold prices are showing signs of recovery after a significant drop, primarily driven by the weakening of the US Dollar. However, despite some positive momentum, the path to sustained growth remains uncertain.
💵 USD Weakness Fuels Gold's Potential Rebound
Recent US economic data shows a slight decrease in consumer spending, which has led to speculation that the Federal Reserve may ease interest rate hikes in the near future.
This, in turn, has contributed to a weaker USD, providing an opportunity for gold to recover slightly.
⚖️ The Federal Reserve's Role Remains Critical
The markets are awaiting further clues on the Federal Reserve's next moves, especially with the ongoing debate about the potential direction of interest rates.
While the recent economic data isn't weak enough to force a policy reversal, it hasn't been strong enough to give the Fed the confidence to continue its hawkish stance either.
🧠 What Does This Mean for Traders?
Gold is responding to macroeconomic factors but still lacks a clear, strong trend.
Volatility remains high, with sharp price fluctuations occurring after key economic and political announcements. This uncertainty suggests gold might not yet have the momentum for a definitive break-out or trend reversal.
🔶 Summary:
Gold is starting to recover after a tough month but the outlook remains cautious.
Buyers are hoping for a Fed rate cut, while sellers are banking on the USD's strength.
Traders should stay vigilant, waiting for clear confirmation before making major moves.
📊 Key Levels to Watch:
Resistance Levels: 3358 – 3360 – 3364 – 3375 – 3380
Support Levels: 3300 – 3290 – 3280 – 3275
🎯 Trading Strategy:
🔵 Buy Zone:
Entry: 3310 – 3315
SL: 3300
TP: 3320 – 3330 – 3340 – 3350 – 3360
🔴 Sell Zone:
Entry: 3370 – 3375
SL: 3380
TP: 3360 – 3350 – 3340 – 3325
⚠️ Final Thoughts:
With USD weakness persisting, gold may continue its rebound, but the market remains uncertain.
Keep an eye on macroeconomic data and geopolitical events, as they will likely shape gold's next move.

Playzone!This is just the future lookout.
Otherwise for the current scene, just looking for sell setup.
Anyway, that's it. Hope you all have a really nice profits!
Report - 1 jully, 2025Global Macro & Currencies:
The US dollar has experienced a historic slide in 2025, falling about 10% year to date — its worst first half since 1973. This dramatic weakness has been driven by a combination of political and economic factors: mounting concerns over the fiscal path under President Trump, ballooning debt loads fueled by aggressive tax cuts, and worries about the independence of the Federal Reserve as markets increasingly price in multiple rate cuts. Additionally, erratic tariff policies and renewed trade tensions have further undermined the dollar’s role as a global safe haven.
While many expected the dollar to strengthen as the US economy outperformed and global risks rose, the opposite has occurred. Instead, European currencies have surged: the euro has climbed nearly 10% against the dollar this year, and sterling has gained almost 9%. Meanwhile, the Japanese yen has remained under pressure, but there are signs that safe-haven flows may soon stabilize it, given rising geopolitical tensions and global volatility.
From a practical investment perspective, the weaker dollar provides a strong tailwind for US multinational corporations with significant overseas revenues. It also supports commodity prices broadly, as seen in gold trading near record highs at around $3,289 per ounce. Investors should consider increasing allocations to hedged international equities or adding European equity exposure, where currency gains can further enhance returns. Moreover, actively hedging USD exposure in global portfolios becomes increasingly important to protect against continued weakness and further policy surprises.
Equities & Sector Rotation Analysis:
US equities have staged a strong comeback in Q2, with the S&P 500 rising 10% in the quarter and hitting record highs. This recovery is largely driven by expectations of lower interest rates, robust corporate earnings, and renewed enthusiasm for technology and AI-focused stocks. Companies like Nvidia continue to lead, with massive gains fueled by AI infrastructure spending and optimism around future growth.
Interestingly, this rebound has narrowed the performance gap with European markets. Earlier in the year, investors rotated into European equities on hopes of fiscal stimulus and infrastructure spending, particularly Germany’s €1tn “whatever it takes” plan. While European stocks still slightly outperform on a year-to-date basis (+7% vs. +5% for the S&P 500), the momentum has clearly shifted back to the US as growth data and earnings resilience support valuations.
Sector-wise, leadership has again become narrow, with technology, communications, and financials outperforming while defensive sectors such as utilities and real estate lag. This suggests a renewed preference for growth and cyclicals over defensive positioning, at least in the short term. Small-cap stocks continue to underperform, reflecting persistent macro uncertainties and a flight to quality.
For investors, this implies a tactical tilt toward large-cap US growth and tech names could still deliver relative strength, but caution is warranted as valuations stretch and volatility could resurface with upcoming tariff decisions and geopolitical risks. European exposure remains attractive for diversification, especially if fiscal initiatives translate into stronger earnings growth, but conviction in execution is needed.
Fixed Income & Yield Curve Dynamics:
In fixed income markets, US Treasury yields have moved lower across the curve, with the 10-year yield dropping to 4.20% after peaking above 4.8% earlier this year. This decline reflects growing market conviction that the Federal Reserve will start cutting rates in September, with futures pricing in as many as five quarter-point cuts through 2025.
The recent dovish pivot by the Fed has significantly improved risk sentiment, driving demand for longer-duration assets. We see strong gains in 20+ year Treasuries (+1.0% on the day), while intermediate and short-term Treasuries have also rallied. The overall move has flattened parts of the curve, suggesting that while markets anticipate lower rates, growth concerns remain, especially as fiscal worries and debt sustainability questions persist.
Globally, yields are following a similar downward trajectory. UK gilts and German bunds have eased, as investors bet on further easing amid weaker economic data and a more cautious ECB stance. In Europe, inflation has cooled below the 2% target, supporting expectations of one more ECB cut before year-end, even as policymakers remain wary of structural inflation risks (like AI-driven wage pressures and supply chain fragmentation).
Credit spreads in US corporate bonds have remained tight, indicating strong appetite for risk despite macro uncertainties. High-yield and investment-grade bonds have both benefited from this supportive backdrop. Meanwhile, emerging market debt has rallied, helped by the weaker dollar and lower global rates, attracting inflows into local currency debt.
For investors, extending duration looks tactically appealing as rate cuts approach, but we remain cautious about heavy exposure to the long end given potential volatility from fiscal developments and geopolitical shocks. Credit remains attractive selectively, with opportunities in high-yield and EM debt, especially for investors looking to capture carry in a lower-rate environment.
Currencies & Dollar Dynamics:
The US dollar has experienced its worst start to a year since 1973, dropping over 10% year-to-date. The dollar index, which tracks it against a basket of major currencies (including the euro, yen, and pound), has fallen sharply as global investors reassess their exposure to the greenback amid Trump’s erratic trade policy, a ballooning fiscal deficit, and concerns over Fed independence.
The immediate trigger has been the combination of rising fiscal risks from Trump's proposed tax bill — expected to add $3.2 trillion to debt over the next decade — and expectations for aggressive Fed rate cuts. The perception that US economic exceptionalism might wane has undermined dollar demand as a safe haven.
The euro has benefited the most, climbing more than 13% to over $1.17 — defying earlier forecasts of a decline to parity. Meanwhile, the pound has gained nearly 9%, supported by relative political stability and a resilient labor market. The Japanese yen has strengthened as well (+12.6% YTD), despite traditionally dovish Bank of Japan policies, with investors treating it as a safe haven amid global trade uncertainty.
In emerging markets, a weaker dollar has lifted currencies and supported local debt. Brazil’s real, Mexico’s peso, and South Korea’s won have all rallied, reflecting strong investor appetite for higher-yielding assets.
However, caution is warranted: with the dollar’s sharp decline becoming a crowded trade, some technical consolidation is likely in coming weeks. We believe the dollar’s longer-term trend remains bearish but anticipate near-term volatility as markets recalibrate positions and digest fiscal developments in the US.
Investors should continue hedging dollar exposures and consider selectively increasing allocations to EM currencies and euro-denominated assets, which stand to benefit from continued dollar softness and potential European growth stabilization.

GOLD WATCH 3345-3348 SELL ZONE ,the breakout 15min descending trendline is a sign that buying will continue into 3340-3344-3348.and there we have 3hrs supply.

GOLD XAUUSD TodayThree posible scenarious
1.Now GOLD is bulish but possible is deep correct
2.UNTIL break my SSM Structure on H4 possible SSM reversal
3. If break SSM area go to new high

Xauusd 4hHello, dear traders, according to the hypotheses of the previous post, the rise in gold was due to the price hitting the trend line (hitting line strategy).
And now we have these two scenarios.
Friends, I live in Iran and I was not able to trade at all due to the war and the internet outage.
I wanted to tell you this:
Nothing is useless in this world, this war and political stories make money by deceiving society, especially through the world of the financial market. So do not pay attention to the news, even during war times, because the market has a roadmap and must hit 100% points and take direction.
Be successful and victorious and pray for us Iranians.

Ethereum Slides Toward $2,446 SupportEthereum was rejected at the $2,539.0 resistance and is falling toward $2,446.0 support. A hold here could launch a retest of $2,539.0, while a close below $2,446.0 may spark a decline to $2,397.0.

GOLD IS FORMING BREARISH TREND MARKET STRUCTUREGOLD is forming bearish trend structure in 4 hour time frame chart.
Buying pressure in market getting low.
Bearish candles indicate drop in the market.
Market may remain bearish for upcoming sessions.
Downside market may hit levels of 3255$ & 3130$.
On higher side market may test the resistance level of 3500$.

XAUUSD 15MIN - Bullish Setup I Trade Plan Above 3349This chart presents a carefully planned intraday buy opportunity on XAUUSD (Gold vs. US Dollar), focusing on short-term bullish price action.
📍 Key Levels & Setup Logic:
Buy Entry Zone: 3350
A strong potential demand area based on recent market structure. The price is expected to bounce from this level if bullish pressure sustains.
No Trading Zone: 3337–3349
This zone marks an area of high volatility and indecision. Traders are advised to avoid initiating trades within this range to prevent premature entries and whipsaws.
TP 1 – 3374.35:
First take profit level aligning with minor resistance and past consolidation.
TP 2 – 3390.91:
Second take profit target based on resistance zone and Fibonacci confluence.
Re-Entry Point:
If the price breaks and holds above 3397, a buy-side re-entry is valid at 3398, targeting continuation toward higher resistances.
TP 3 – 3420 & TP 4 – 3445 (Reversal Zone):
Strong resistance and potential exhaustion/reversal zone. Monitor price action closely here for signs of trend weakening.
SL- Previous Swing Low.
⚠️ ZONES:
🔴 No Trading Zone: 3337–3349 (Avoid trades in this range — potential indecision zone)
🔴 Reversal Zone: Near 3445 — monitor price action for potential exhaustion.
📌 Technical Commentary:
Structure favours upside as long as price sustains above the No Trading Zone.
Clean higher-low formation suggests momentum shift.
If price confirms break above 3397 resistance, bullish continuation toward 3445 is highly probable.
🔍 Trade Summary:
Strategy: Buy on Breakout & Pullback
Confirmation: Bullish bounce from 3350 or breakout above 3397
Risk Management: Avoid trades within 3337–3349; reassess if price falls below this zone
Profit Targets: Laddered exits at 3374.35, 3390.91, 3420, 3445
⚠️ Disclaimer & Important Note:
This analysis is for educational and informational purposes only. It does not constitute financial advice or a recommendation to buy or sell any financial instrument. All trading involves risk. We are not responsible for any kind of loss incurred, whether financial, emotional, or otherwise. Always do your own research and consult with a licensed financial advisor before making any trading decisions.
Trading involves significant risk, and you should never invest more than you can afford to lose. Past performance is not indicative of future results.
The trade idea shared above reflects personal market interpretation and is subject to change based on new market conditions.
📍Posted by: THEPATELCRYPTO
📈 Stay safe. Trade smart.
🔔 Follow for more ideas!
