Gold Intraday Trading Plan 7/8/2025Although I am bearish in my weekly post, I can not ignore the formation of inverted head and shoulder pattern in daily TF. I am switching back to bullish view. Gold is continuing its bull drive.
I will buy from 3320.
1st target 3360.
Ultimate target for today 3400.
Futures market

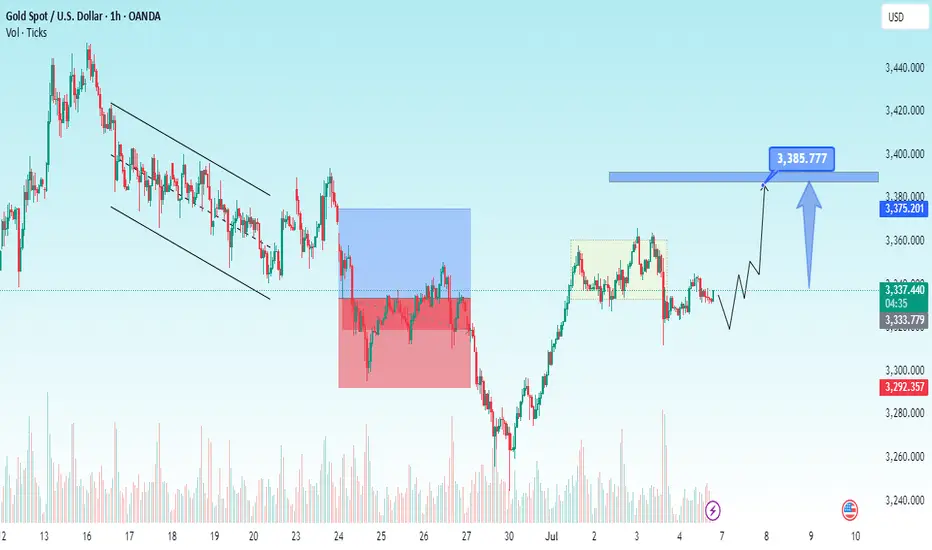
Gold expectation 1HGold had a rough time last week with news etc, but I still think its on a correction path to the main bullish channel. However, due to the news and sellers taking advantage, has pushed price into this bearish channel, and you see how price has fought to get back to its original path. I think there will be a retest of the trend line, and another bullish movement again. But looking at the price and where its sitting now (bearing channel) it could continue to go down.

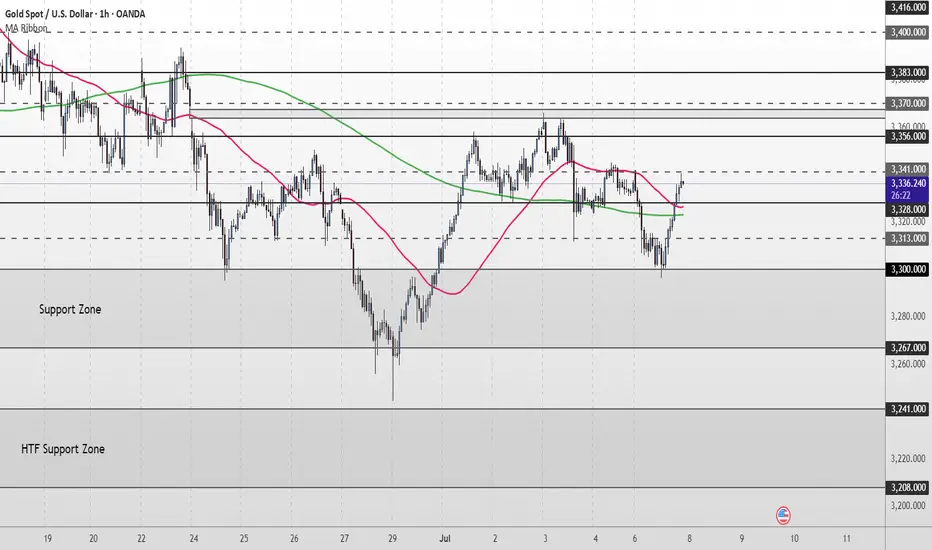
Gold Short Term OutlookGold dipped earlier in the session as the $3,328 support level failed, pushing price into the upper boundary of the broader Support Zone. From there, we’ve seen a strong bounce, with price now trending around the $3,341 minor resistance.
Price has reclaimed both the 50MA and 200MA, suggesting bullish momentum may be returning. A clean break and hold above $3,356 would likely open the path toward higher resistance levels, including $3,370 and $3,383.
However, failure to break and hold above $3,356 could lead to another pullback toward the Support Zone. If that zone fails to hold, we may see a deeper move into the higher timeframe (HTF) support area below $3,300.
📌 Key Levels to watch:
Resistance:
$3,356 ‣ $3,383 ‣ $3,400 ‣ $3,416
Support:
$3,328 ‣ $3,300 ‣ $3,267 ‣ $3,241 ‣ $3,208 (HTF Support)
#XAUUSD – H1 High Probability Setup
📊 **#XAUUSD – H1 High Probability Setup** 🔍
If you recall our **morning analysis**, we clearly mentioned that price is likely to **mitigate the zone below 3300** —
and as expected, **price tapped into 3296**, which aligned with both the **H1 Order Block** and **Golden Fibonacci zone** 🎯📉
---
📈 **Current Setup in Progress:**
We're now watching for a **bullish H1 candle close above 3353** 🔼
Once confirmed, we’ll execute a **layered buy strategy**:
🔹 **50% entry at activation** (above 3353)
🔹 **30% on retracement** (if price dips 50–60 pips below entry)
🔹 **Remaining 20%** if price dips **70+ pips** below entry zone
---
🛡️ **Stoploss:** 3338–3337 (slightly wide due to structure)
This is why we **scale into the trade** — for **better risk management** and **position control** ✅
🎯 **Minimum Target:** 100–150 pips
🏁 **Extended Target (Optional):** 3396 – for those who can hold with conviction 📊💰
---
🧠 *Follow structure, manage risk, and trust the plan. High probability setups don’t need to be rushed.*

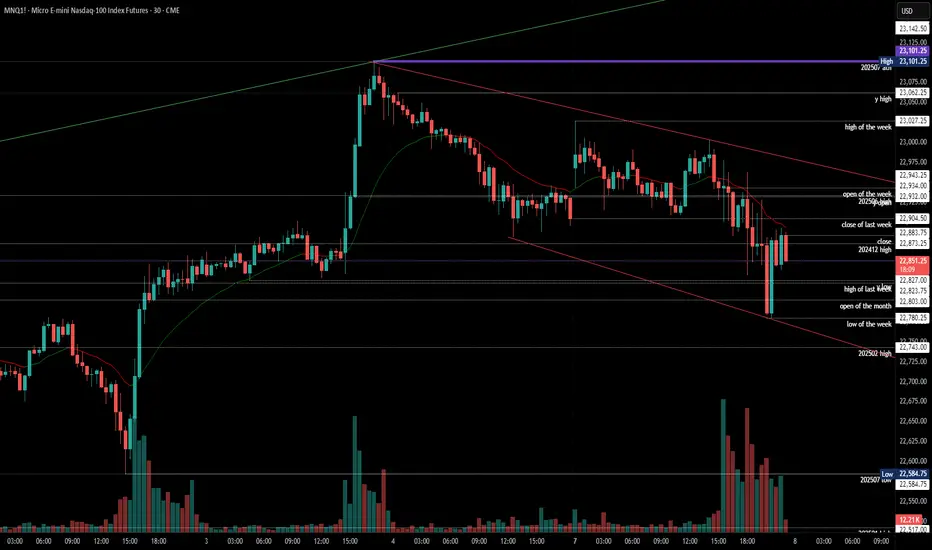
2025-07-07 - priceactiontds - daily update - nasdaqGood Evening and I hope you are well.
comment: Market is ignoring every risk under the sun because the US government is too incompetent to follow-through with their excrement show. Beyond me that we are staying up high. Got no better comment for you today.
current market cycle: bull trend
key levels: 22500 - 23100
bull case: As long as bulls stay comfortably above 22500, they are fine and sideways is a very bullish correction for them. Bears are certainly not doing much, so bulls buy every dip and the chances of a new ath are there since we are very close to it.
Invalidation is below 22500.
bear case: Bears are just not doing enough. Markets have every reason to sell hard but they don’t. Unless we see big 1h bear bars closing on their low with follow-through selling, we can not expect lower prices. We need gaps but all bears get are huge reversal bars. Below 22500 things would look better for them but for now it’s very unlikely. It’s certainly a start that we closed a 4h bar below the 4h 20ema and below last week’s close but unless we make lower lows, it does not mean much.
Invalidation is above 23100.
short term: Neutral.
medium-long term - Update from 2024-06-29: No change in plans. I expect 20000 to get hit over the next 3 months and maybe 19000 again.
trade of the day: Scalping both sides since we had many alternating bars and prominent tails.
GOLD Analysis – Weekly Outlook GOLD Analysis – Weekly Outlook 🟡📈
Price has just tapped into our Daily PD Array, precisely the Fair Value Gap (FVG), which was clearly marked. It also entered the discount zone, aligning with our bullish bias.
Additionally, we’ve seen a liquidity sweep, followed by a strong bullish reaction — a classic sign of smart money accumulation.
📍 Key Targets:
First Target 🎯: 3396
Second Target 🎯: 3451
As long as price holds above this zone, we expect the bullish move to continue. Let’s see how it unfolds over the coming sessions.
🔔 Follow for more weekly insights.
📊 See you next time!
#Gold #XAUUSD #TradingView #SmartMoneyConcepts #FVG #LiquiditySweep #PriceAction #MarketAnalysis

GBP/USD Futures – Short Trade Active📉 GBP/USD Futures – Short Trade Active
🕒 Timeframe: 1H
💼 Instrument: Micro GBP/USD Futures (M6B1!)
📍 Entry: 1.3651
🎯 Target: 1.3614
📊 Analysis:
Price tapped into a clear area of liquidity and resistance at 1.3651, aligning with previous sell pressure. I’ve entered short expecting a rejection and return toward support near 1.3614.
The market just completed a strong leg up — this is a textbook area to fade the strength and catch the retrace.
🎯 Bias: Intraday short
📲 Trade in progress – managing risk actively
#GBPUSD #FuturesTrade #MicroFutures #PriceAction #ShortSetup #CME #FXFutures #SupplyAndDemand #Forex

GOLD Spot (XAU/USD) 4H Analysis – Rejection Confirmed at Resista🔍 GOLD Spot (XAU/USD) 4H Analysis – Rejection Confirmed at Resistance 🔴🟢
📅 Date: July 7, 2025
📊 Timeframe: 4-Hour (4H)
💱 Pair: Gold vs US Dollar (XAU/USD)
📌 Key Technical Highlights:
🔴 Resistance Zone:
3,390 – 3,420 USD
Price faced strong rejection (🔴 red arrow) from this zone after forming a lower high.
This zone has previously acted as a reversal barrier.
📉 Bearish Trendline:
A well-respected descending trendline capped multiple rally attempts.
Recently broken to the upside, suggesting a possible trend shift.
🟢 Main Support Level:
3,270 – 3,300 USD
Marked by the blue-green box and multiple bullish bounces (🟢 green arrows).
Buyers stepped in aggressively around this level, preserving bullish structure.
📈 Current Price Action:
Price is consolidating just above support and attempting a retest of broken trendline resistance.
Higher low structure suggests bulls may try to reclaim 3,375–3,400 in the short term.
✅ Summary:
🧠 Bulls are defending the key support zone, forming a potential base for a reversal.
⚠️ A break below 3,280 could expose 3,230–3,200.
🚀 A close above 3,375 could open the door toward 3,420 again.
📉 Bias: Neutral to Bullish (while above main support)
🔔 Watch for breakout confirmation and volume near 3,375
🛡️ Trading Tip: Wait for confirmation candles at key zones – either a breakout above trendline resistance or a retest of main support for optimal entries.
📊 Happy Trading! 🪙💹

Report - 7 jully, 2025China’s Export Rerouting: A Strategic Response to US Tariffs
China has aggressively shifted its export strategy to circumvent the steep tariff wall erected by President Trump as part of his ongoing trade war. Recent data from the US Census Bureau shows that Chinese exports directly to the US dropped by 43% year-on-year in May, equivalent to a $15 billion decline.
However, China’s overall exports still rose by 4.8% in the same period, indicating successful reallocation of trade flows. This was achieved through a 15% increase in exports to the ASEAN bloc and a 12% increase to the EU. By rerouting products through Southeast Asia, China is effectively sidestepping US tariffs, echoing tactics seen during the initial phase of the US-China trade war under Trump's first term.
Southeast Asia as a Transshipment Hub
Vietnam and Indonesia have emerged as key transit hubs. According to Capital Economics, an estimated $3.4 billion worth of Chinese goods were rerouted via Vietnam in May — a 30% increase from the previous year. Indirect trade through Indonesia also rose sharply to $800 million, up 25% year-on-year.
Chinese exports of electronic components to Vietnam surged, including printed circuits, telephone set parts, and display modules, which alone rose by $2.6 billion, or 54% compared to May 2024. This strategic pivot underlines China’s adaptability and Southeast Asia's growing role in global supply chain realignments.
US Policy Response and Warnings
US Treasury Secretary Scott Bessent has warned that unless trade partners finalize deals with Washington, tariffs will "boomerang" back to their steep April levels starting August 1. The 90-day tariff pause, which initially calmed markets, is set to end imminently.
So far, Trump has secured only three trade agreements — with the UK, China, and Vietnam. Vietnam’s deal notably includes a punitive 40% levy on goods transshipped through its territory, specifically targeting Chinese re-exports. This demonstrates the US administration's determination to close loopholes and deter indirect circumvention of tariffs.
Implications for Trade Partners and Global Markets
Other major US trading partners, including the EU, Japan, and South Korea, remain in limbo, facing potential tariff hikes. The uncertainty has reintroduced volatility into trade-dependent markets. US officials anticipate a flurry of last-minute negotiations, but the threat of broad tariff reimposition looms large.
Trump’s approach, characterized by abrupt policy swings and negotiation brinkmanship, has already forced US allies and adversaries alike to reconsider supply chain configurations. The potential return of high tariffs risks reigniting concerns over inflation and global growth that initially triggered financial market sell-offs earlier in the year.
Financial Market Dynamics
Trump’s tariff pause had stabilized US equities and bond markets after an initial sharp downturn. However, the risk of renewed tariffs could reverse these gains, particularly if trade tensions escalate further. Investors are watching closely for any last-minute deals that might avert additional supply chain disruptions and support risk sentiment.
Meanwhile, China’s ability to maintain overall export growth despite US measures signals resilience and reinforces the importance of diversified trade relationships. For global investors, this suggests continued strength in ASEAN manufacturing and logistics sectors, as well as ongoing demand for regional infrastructure development to handle redirected trade flows.
Broader Geopolitical and Strategic Context
The rerouting highlights China’s tactical approach to trade pressure while deepening its economic ties with neighboring Southeast Asian nations. This strategy aligns with Beijing’s broader goal of strengthening its influence in ASEAN and hedging against Western economic decoupling efforts.
In parallel, the US is doubling down on "economic nationalism," threatening high tariffs unless trade partners make concessions. This could push more countries toward regional trade alliances, bypassing direct US channels and potentially undermining American market leverage over time.

GOLD - Lovers Elliott wave - looking strong Short/Medium termGOLD-----Daily counts indicate Excellent bullish wave structure.
Both appear to be optimistic and this stock invalidation number (S L) wave 2 low
target short / long term are already shared as per charts
correction wave leg seems completed (C)
Investing in declines is a smart move for short/ long-term players.
Buy in DIPS recommended
Long-term investors prepare for strong returns over the next two to five years.
one of best counter
Every graphic used to comprehend & LEARN & understand the theory of Elliot waves, Harmonic waves, Gann Theory, and Time theory
Every chart is for educational purposes.
We have no accountability for your profit or loss.

GOLD 2HOURS BULISH ANALYSISThe image shows a computer screen displaying a trading platform with a graph and various indicators. The graph is titled "Gold Spot / U.S. Dollar" and has a black background with red and green bars indicating price movements over time. A white line connects the peaks and troughs of the graph, forming a zigzag pattern.

GOLD 2 HOURS BEARISH ANALYSISMarket may be going sell side. the market which I have target will definitely achieve it.

**Title: XAUUSD Long Play: Breaking Out and Targeting Higher!****Chart: XAUUSD, 5-Minute Timeframe**
**Analysis:**
Hey everyone! Sharing a recent Gold (XAUUSD) trade setup that played out nicely.
After a period of consolidation within a descending channel (those blue parallel lines), we finally saw a strong breakout to the upside. This confirmed the shift in momentum and presented a great long opportunity.
**My Entry:**
* I went long (BUY) at **3,332.66** as price decisively broke above the channel and showed strong bullish candle closes. This entry was confirmed by the increasing momentum.
**Risk Management & Targets:**
* **Stop Loss (SL):** My initial stop loss was placed strategically below recent support and the breakout level, around **3,328.00**. This limited my downside risk if the breakout failed.
* **Take Profit (TP):** My primary take-profit target was set around **3,334.00**, aiming for the next significant resistance zone (the red shaded area on the chart).
**Current Status:**
The price has rallied well since the entry and is currently consolidating around the entry point after hitting some resistance. I'm watching closely to see if it can push through this current overhead supply to continue higher towards the final targets, or if a pullback is imminent.
**Key Observations:**
* **Channel Breakout:** The most significant signal for this trade.
* **Momentum:** Strong bullish candles driving the price up.
* **Resistance Ahead:** Keep an eye on the red shaded zone as a potential profit-taking area or reversal point.

Xauusd Going Towards BuyDespite rising selling pressure on the dollar and mixed US PCE numbers, Gold prices fell further on Thursday, reaching new four-week lows around $3,260 per troy ounce. Collaborating with the decline, recent improvements in the Israel-Iran conflict continue to fuel investor withdrawals from the safe haven region.

Xauusd Making Space In BuyGold price kicks off the week on a bearish note after facing rejection again near $3,350. US Dollar finds fresh haven demand amid renewed trade jitters as Trump’s tariff letter to go out on Monday. Gold price breaches the 50-day SMA support as the daily RSI pierces below the midline.

XAUUSD Going To Fly SoonGold price regains positive traction and reverses a part of Thursday’s upbeat NFP-inspired losses. US fiscal concerns weigh on the USD and lend support to the commodity amid trade uncertainties. Holiday-thinned liquidity might hold back the XAU/USD traders from placing fresh directional bets.
XAU/USD💰Symbol: { XAU/USD }
🟩Price: { 33077.35 }
🟥Stop: { 3282.67 }
1️⃣profit: { 3323.66 }
2️⃣profit: { 3346.85 }
3️⃣profit: { 3373.94 }
4️⃣profit: { 3394.65 }
📊Check your chart before entering.
🚨Check before use to make sure there is no important news.🚨

The sources of returns investing in the financial marketsThere are two ways to make profits in the financial markets:
Entering and exiting the market at the most appropriate times. This is called Market Timing.
Selecting the best assets for our investment strategy. This is called Security Selection.
Our thoughts on Market Timing
For an inexperienced investor, even for advanced or professional investors, it is difficult to know when is the best time to enter the market to buy and even more difficult to know when is the best time to sell, especially when there is a lot of uncertainty in the financial markets.
Trying to seek short term profits from our investments only through Market Timing is very complicated even for a professional investor.
The opposite strategy of buying and selling securities seeking short term profits based on the movements in its price, is to buy financial assets and hold them and analyse the results of our asset selection strategy after a certain period of time (buy and hold).
Our thoughts on Security Selection
Selecting the best assets for our investment is the most important task and the one that brings the most value.
What to consider:
Asset selection should follow a defined strategy.
You should have to identify the level of risk that you are able and willing to carry and match your portfolio of assets to those risk limits.
You should have to build your portfolio considering the individual risks and how the assets behave with each other to know the overall risk of the portfolio. Remember that you cannot value anything for which you don’t have metrics. Quantification in these cases is necessary. Intuitive or qualitative criteria are useless. There are tools to measure the overall risk of a portfolio.
What you should not do:
Buying assets solely on the basis of their expected return.
This way of constructing a portfolio, common among inexperienced investors, can lead you to have an aggregate of assets and not a portfolio. More worrisome is not knowing the overall risk you are bearing in your investments and that the resulting risk is one you are unable or unwilling to assume.
Did you like it? Share with your friends.
by HollyMontt

GOLD PULLISH TRENDGold in triangle correction. Wave D target: 3392-3400. Confirmation: 4-hour close above 3350. Stop loss: close below 3320.

Sell XAUUSD"Gold is moving within a descending channel on the 15-minute timeframe. My expectation is that the price will reverse at the top of the channel and drop down to the bottom. If it shows a proper reaction in the area I’ve marked in blue, I will enter a sell position."

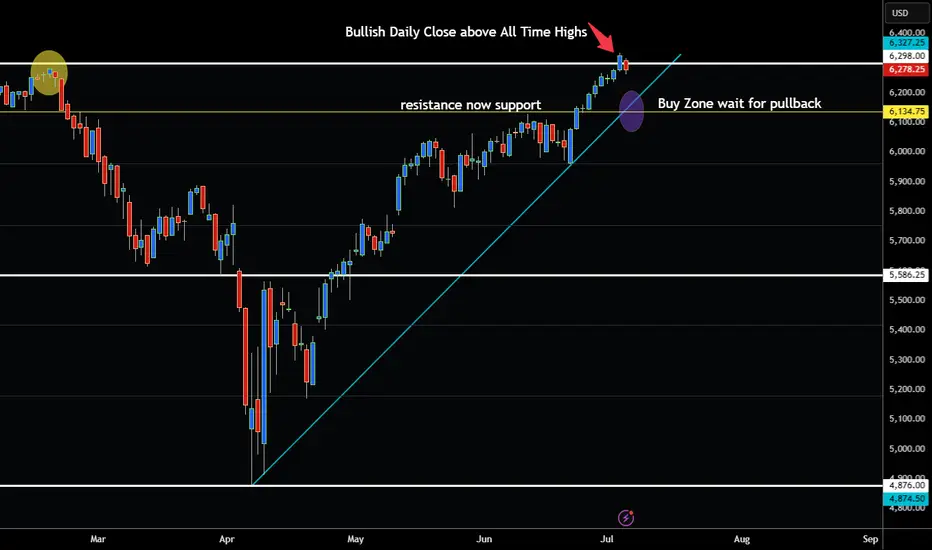
S&P 500 BULLISH BREAKOUT ABOVE ALL TIME HIGHS!Hey Traders taking a look at the S&P500 this week it is clear that we are in a strong bull market.
Notice that we broke above 6300 on the ES Futures Contract last week on July 3. This level is extremely important because it was the all time high from Feburary 2025. So now that the market has closed above this level buying opportunities can be considered at the trendline.
6135-6150 look like a good place to grab this bull again by the horns. 😁
So if your bullish wait for the pullback no need to chase the market imo. Eventually it will pullback lets see what happens July 9 WED with the Tarrifs.
Expect Volatility!
However if your bearish be very careful I don't think there is a good risk to reward ratio to shorting at this time.
Good Luck & Always use Risk Management!
(Just in we are wrong in our analysis most experts recommend never to risk more than 2% of your account equity on any given trade.)
Hope This Helps Your Trading 😃
Clifford
8/7/25 No FT Selling, Can Bulls Create FT Buying or No?
Monday’s candlestick (Jul 7) was a bull bar closing near its high.
In our last report, we said traders would see if the bears could create a strong bear entry bar, or if the market would trade slightly lower but close with a long tail below or with a bull body instead. If this is the case, it could indicate the bears are not yet strong.
The market opened lower with limited follow-through selling followed by sideways to up trading into the close.
The bulls hope to get a retest of the July 4 high and the Jun 20 high.
They must continue to create follow-through buying to show they are back in control.
The bears see the current move as a retest of the prior high (Jun 20) and want a lower high major trend reversal and a double top bear flag (with the Jun 20 high).
They want a resumption of the broad bear channel.
They must create strong bear bars to show they are back in control.
Production for July should be around June's level.
Refineries' appetite to buy so far looks decent.
Export: Up 31% in the first 5 days of July.
The market is forming a retest of the Jun 20 high and so far, it is a lower high.
The bulls need to do more to show they are back in control by creating follow-through buying trading above the Jun 20 high for a sustained move higher.
If the market continues to stall around or below the Jun 20 high, the odds of a double top bear flag (with Jun 20) will increase.
For tomorrow (Tuesday, Jul 8), traders will see if the bulls can create a follow-through bull bar testing the July 4 high.
Or will the bears be able to create a strong bear bar closing below Monday's low instead?
The market continues to exhibit frequent reversals and poor follow-through buying and selling, which are the hallmarks of trading range price action.
Andrew

15-minute candlestick chart for Gold Spot (XAU/USD)15-minute candlestick chart for Gold Spot (XAU/USD)
📉 **1. Trend Overview:**
* The overall direction is **bearish (downtrend)** — this is confirmed by:
* **Price below the 50 EMA** (black line)
* **Lower highs and lower lows**
* Continuous rejection from resistance
---
### 🟩 **2. Resistance Zone (\~3,312 to 3,320):**
* This is the area where price has **previously failed to break above** multiple times.
* Sellers dominate this level — price tends to drop when approaching here.
* A **bullish breakout above 3,320** may signal trend reversal.
---
### 🟥 **3. Support Zone (\~3,296 to 3,303):**
* This area has seen **strong buying** (look at the lower wicks and reversal candles).
* Price has bounced multiple times from this zone — it's acting as a **floor**.
* If price breaks **below this support**, further downside is likely.
---
### 📊 **4. Indicators:**
* **EMA 50 (black line)**: Shows the medium-term trend — it's sloping down, confirming bearish bias.
* **Shorter EMAs (red and blue)** are also above price, indicating pressure from sellers.
---
### 💡 **5. Price Action & Volume Insight:**
* A recent **rejection wick** at support suggests buyers are still active here.
* However, volume is increasing during the latest drop — **bearish momentum** is building.
* Watch how price behaves around 3,302–3,303 — consolidation here could lead to a breakout or breakdown soon.
---
### 🧠 **Trade Setups:**
#### **A. Bearish Scenario (Breakdown Trade):**
* 🔻 *Sell below 3,296 (support break)*
* 🎯 Target: 3,288 or lower
* 🛑 Stop Loss: Above 3,304
#### **B. Bullish Scenario (Bounce Trade):**
* 🔼 *Buy near 3,296–3,303 (support bounce)*
* 🎯 Target: 3,312–3,320 (resistance)
* 🛑 Stop Loss: Below 3,295
---
### ✅ **Summary:**
* Market is **bearish**, but currently **testing strong support**.
* Watch closely for a breakout below support or a pullback to resistance.
* Best strategy: **Sell the breakdown or sell the pullback to resistance.**
