GOLD Will Keep Growing!
HI,Traders !
#GOLD keep trading in
An uptrend along the rising support
So as the pair is approaching
A the support we will be
Expecting a bullish rebound !
Comment and subscribe to help us grow !
Futures market

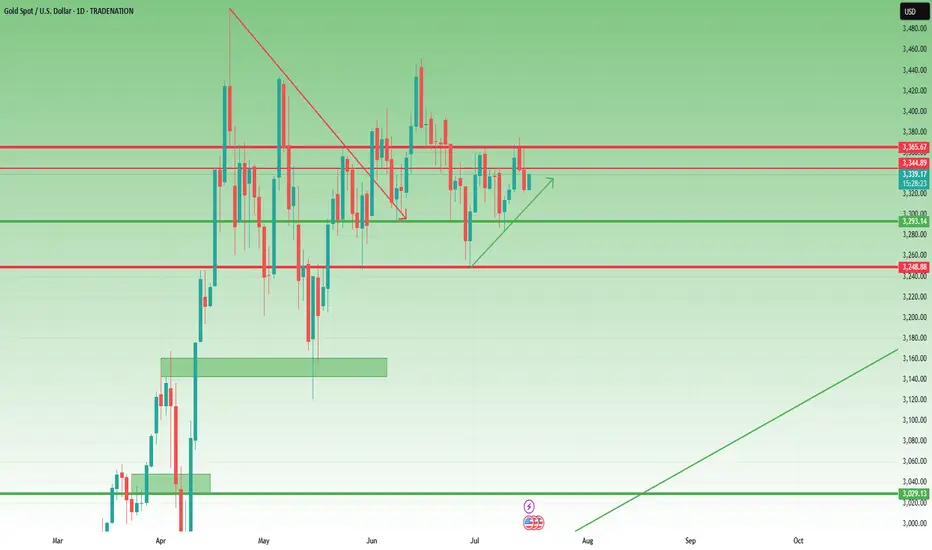
Gold – Bullish Structure Still Intact, but Bears are Knocking📉 What happened yesterday?
As expected, XAUUSD made another leg down, breaking even below my buy zone (3330–3335) and hitting a low at 3320. From there, we’re now seeing a modest rebound, with gold trading around 3333 at the time of writing.
📌 Current position:
I'm currently holding a long position. It hovers around break-even – fluctuating between small gains and small losses. Nothing solid yet.
❓ Key question:
Was this just a deep pullback within a bullish structure… or the beginning of a deeper trend reversal?
🔍 Why bulls still have a case:
• Price prints higher lows – bullish structure technically remains intact
• A clean break above 3350 would show short-term strength
• A confirmed break above 3375 would activate a bullish ascending triangle → targeting the 3450 zone
⚠️ But here's the concern:
• Yesterday’s dip to 3330 happened during the New York session (strong volume)
• The bounce from 3320 has been weak, with no follow-through
• Daily candle closed near the lows, showing a long upper wick → a classic bearish signal
• The confluence support now lies at 3310–3320. A red daily candle closing in this area could mean the medium-term trend is flipping
🎯 My trading plan:
Although I'm still holding my buy, if bulls don’t recover 3350 quickly, I will consider closing early. The break of 3310 would shift my bias bearish.
________________________________________
📌 Conclusion:
We’re in a critical zone. The bullish structure isn’t broken yet, but yesterday’s action was not encouraging. If buyers fail to reclaim control soon, the market may be preparing for a deeper correction. Stay sharp. 🚀
Disclosure: I am part of TradeNation's Influencer program and receive a monthly fee for using their TradingView charts in my analyses and educational articles.
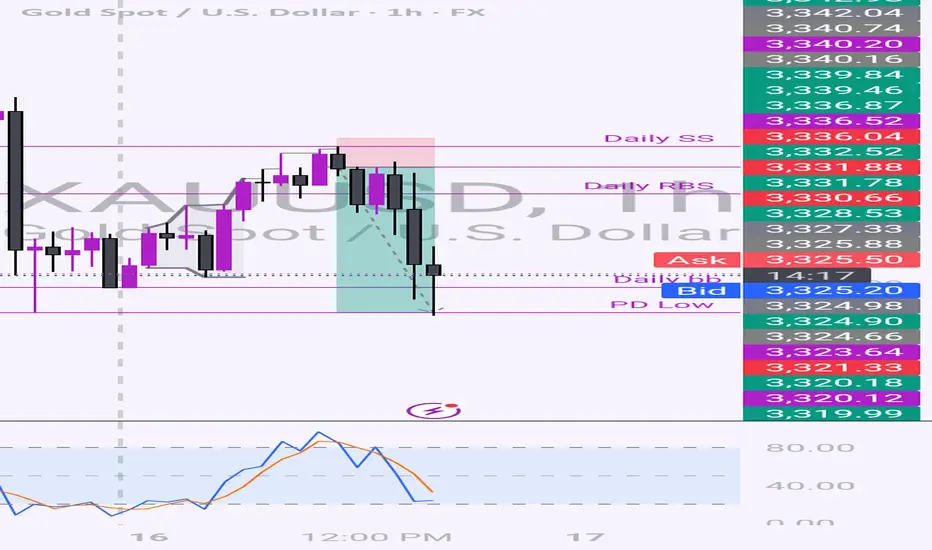
Gold Roadmap: Next Stop $3,325 After Ascending Channel Break?Gold ( OANDA:XAUUSD ) failed to touch the Potential Reversal Zone(PRZ) in the previous idea , and I took the position at $3,351 = Risk-free.
Gold is moving in the Resistance zone($3,366-$3,394) and has managed to break the lower line of the ascending channel .
In terms of Elliott Wave theory , with the break of the lower line of the ascending channel, it seems that gold has completed the Zigzag correction(ABC/5-3-5) .
I expect Gold to trend downward in the coming hours and succeed in breaking the Support zone($3,350-$3,325) and attacking the Support line again , and probably succeeding in breaking this line this time.
Note: Stop Loss (SL) = $3,396
Gold Analyze (XAUUSD), 1-hour time frame.
Be sure to follow the updated ideas.
Do not forget to put a Stop loss for your positions (For every position you want to open).
Please follow your strategy; this is just my idea, and I will gladly see your ideas in this post.
Please do not forget the ✅ ' like ' ✅ button 🙏😊 & Share it with your friends; thanks, and Trade safe.

Gold 30Min Engaged ( Bullish Reversal Entry Detected )Time Frame: 30-Minute Warfare
Entry Protocol: Only after volume-verified breakout
🩸Bullish Reversal 3329 Zone
➗ Hanzo Protocol: Volume-Tiered Entry Authority
➕ Zone Activated: Dynamic market pressure detected.
The level isn’t just price — it’s a memory of where they moved size.
Volume is rising beneath the surface — not noise, but preparation.
🔥 Tactical Note:
We wait for the energy signature — when volume betrays intention.
The trap gets set. The weak follow. We execute.
☄️Gold 30Min Engaged ( Bearish Reversal Entry Detected )
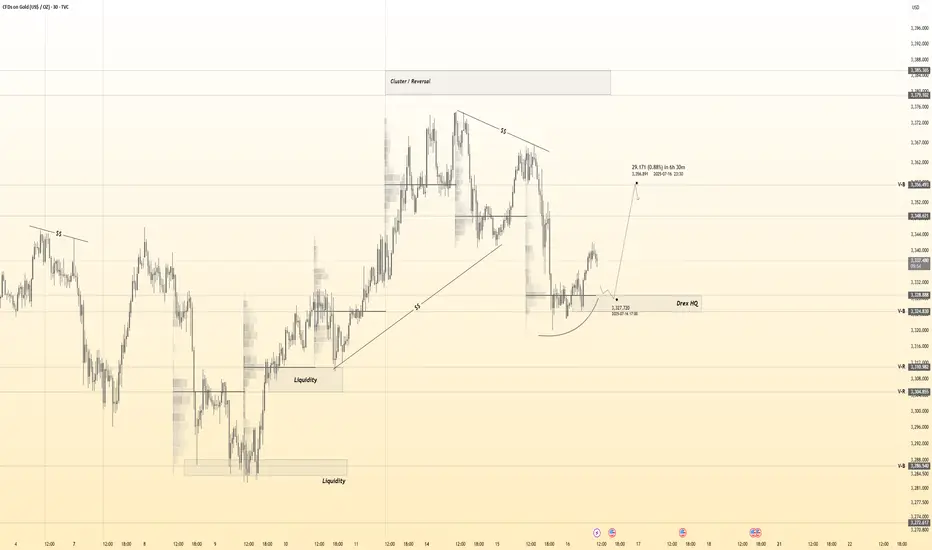
Up then Down!Hello all. price probably (Probably) will make a new High then Collapse to break the Low. be happy (wink)

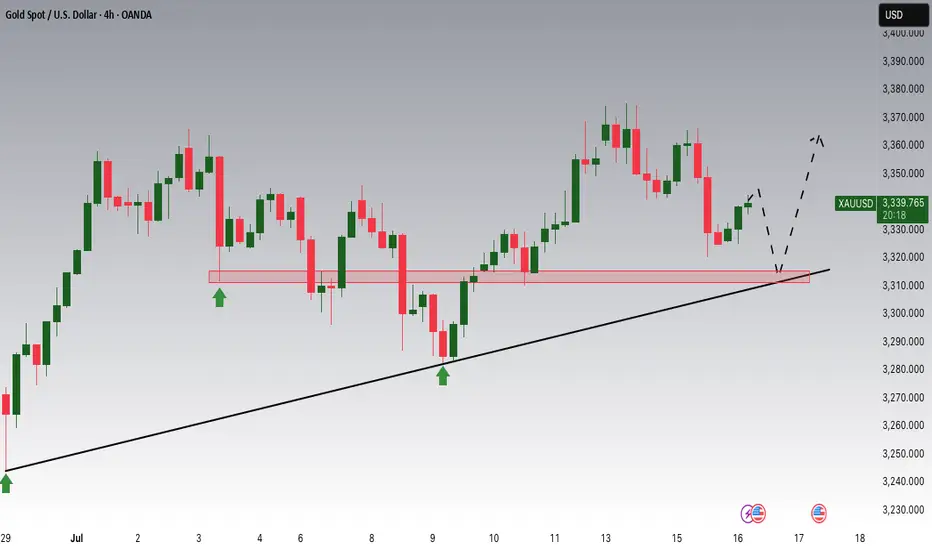
SWING TRADE OPPORTUNITY 〉LONGAs illustrated, I try to visualize what the next bullish impulse could look like if price holds 3300 as a key psychological and algorithmic price level.
Illustrated are the potential buy areas (a current one and an extended one in case a pullback occurs to manipulate lower levels in the next 24-48 hours).
This projection, if valid, could hold from now until next week, so it can be considered a swing trade to hold at least the next week and into the following one).
--
After this post, I will upload another analysis on the Daily timeframe projecting the longer term move, so make sure to go in my profile to check it out.
GOOD LUCK

XAUUSD: Market analysis and strategy for July 16.Gold technical analysis
Daily chart resistance level 3382, support level 3300
Four-hour chart resistance level 3365, support level 3320
One-hour chart resistance level 3342, support level 3325.
Yesterday, the lowest price fell to 3320, then fluctuated upward, and rebounded to 3343. As the price fell below 3341 yesterday and accelerated downward, a transition from support to resistance was formed here. Focus on the high point of the NY market rebound yesterday, 3352. Whether it can break through here will determine whether the market continues to rise or is blocked and then falls back like yesterday.
It is worth noting that the trend of the past two days is that Asia is rising and rebounding, and the NY market is falling. Today may be a cycle of yesterday and the day before yesterday. At present, gold is fluctuating and rebounding at 3320. If the NY market cannot break through 3352, it will continue to fall. For the time being, it can be sold high and bought low in this range. After falling below 3320, the next short-term target is 3310~3300.
BUY: 3324 SL: 3320
SELL: 3320 SL: 3325
SELL: 3352 SL: 3357

Breaking News - Trump vs. PowellJul 16 2025 16:56:19 CET: CBS CITING SOURCES:
TRUMP ASKED REPUBLICAN LAWMAKERS IF HE SHOULD FIRE FED'S POWELL
OANDA:XAUUSD sees upside +35$/oz after Trump has asked the republican lawmakers if he should fire Powell.
TVC:DXY weakens against TVC:EXY and TVC:JXY after Trumps question.
Volatility is increased.

Gold Spot Price (USD) - 4-Hour Chart (OANDA)4-hour performance of the Gold Spot price against the U.S. Dollar (OANDA). The current price is $3,223.660, reflecting a 1.3% decrease. Key levels include a resistance zone around $3,360.405 and a support zone near $3,294.070, with recent price action showing a potential breakout or reversal within these ranges.

GOLD has entered a NEW BULL CYCLE this month!GOLD, has been on a consistent ascend since 2k levels hitting a series of ATH taps week after week.
As with any parabolic event -- a trim down is warranted.
After hitting its ATH zone at 3500, gold significantly corrected back to 38.2 fib levels at 3100 area. 38.2 fib levels has been acting as a strong support for GOLD for quite a bit and as expected buyers has started to converge and positioned themselves back again for that upside continuation -- long term.
After hitting this fib key level gold has been making consistent higher lows on the daily conveying clear intentions on its directional narrative -- to go NORTH.
As of this present, July 2025, GOLD has seen renewed elevation in momentum metrics signifying definitive blueprint towards its next upside move.
Based on our diagram above. WE have now entered a new bull cycle that only transpires every 6 months. The last cycles happened on July 2024, January 2025, then presently July 2025 which is in progress. This is very special as we dont get to see this bullish setup on a regular basis.
Ideal seeding zone is at the current range of 3300-3350.
Mid-Long Term Target at 3400

XAU/USD: Strong Rebound from Demand Zone Strong Rebound from Demand Zone Suggests Bullish Continuation
Market Overview:
Gold has bounced confidently from the key 3320–3330 demand zone, completing a bullish AB=CD pattern while maintaining support from the 144 EMA. The uptrend structure remains intact, and the next upside target is seen near 3410.
Technical Signals & Formations:
— Completed AB=CD pattern
— EMA(144) providing dynamic support
— Support held at 3320–3330
— Renewed upward momentum aiming toward previous highs
Key Levels:
Support: 3330, 3320
Resistance: 3360, 3395, 3410
Scenario:
Primary: as long as price holds above 3340, continuation toward 3395 and 3410 is expected.
Alternative: break below 3320 would negate the current structure and target the 3282 zone.

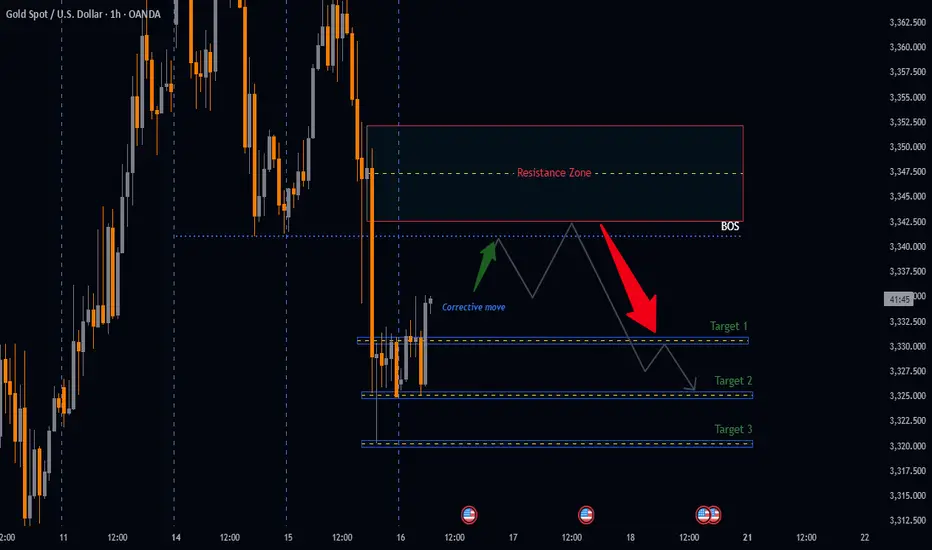
GOLD: A Bearish Trading SetupBearish Breakdown Setup
**Summary
Analysing Price action from yesterday we have got a very nice distribution leg push that broke down below our accumulation zone a good indication of downside momentum, therefore the anticipation is that price will retest our BOS an ideal zone to look for bearish setups.
📉 XAUUSD Daily Breakdown Potential setup
🔴 Distribution leg: 3366.425 - 3320.305
📉 Sell level: 3341 (BOS)
🎯 Target 1: R:R 1:2
🎯 Target 2: R:R 1:3
🎯 Target 3: R:R 1:4
🛑 Stop Loss: Above Resistance Zone
🔍 Watch: Failure to break back in = Confirmation
LIKE or COMMENT if this idea sparks your interest, or share your thoughts below!
FOLLOW to keep up with fresh ideas.
Tidypips: "Keep It Clean, Trade Mean!"
Gold Potential UpsidesHey Traders, in today's trading session we are monitoring XAUUSD for a buying opportunity around 3,310 zone, Gold is trading in an uptrend and currently is in a correction phase in which it is approaching the trend at 3,310 support and resistance area.
Trade safe, Joe.
Gold Short update After market took the Asian high and made other confluence short was taken check previous form update 💧💧
GOLD - Price can start to decline and break support levelHi guys, this is my overview for EURUSD, feel free to check it and write your feedback in comments👊
Gold initially traded inside a steady falling channel, carving lower highs at $3390 and lower lows around $3285 as bears held sway.
A brief fake breakout at $3365 briefly flipped sentiment, but sellers quickly reasserted control and pushed price back toward the channel floor.
Buyers then absorbed selling at the $3285 support area, sparking a rebound into a rising wedge pattern marked by converging trendlines.
Within this wedge, three minor breakouts failed to trigger sustained rallies, underscoring persistent resistance near the upper boundary.
I anticipate Gold to roll over from the wedge’s ceiling and break below $3365, targeting the wedge’s lower support line at $3310
If this post is useful to you, you can support me with like/boost and advice in comments❤️
Disclaimer: As part of ThinkMarkets’ Influencer Program, I am sponsored to share and publish their charts in my analysis.

Gold Analysis and Trading Strategy | July 16✅ Fundamental Analysis
The U.S. Dollar Index has risen for four consecutive trading days, reaching a high of 98.70, which continues to weigh on gold prices denominated in dollars. Recently, the Trump administration imposed a 30% tariff on goods from the European Union and Mexico, and plans to issue tariff notices to Indonesia (19%) and several other “smaller countries” (around 10%), triggering global trade tensions. Meanwhile, the ongoing escalation of the Russia–Ukraine conflict has increased safe-haven demand, providing some support for gold.
✅ Technical Analysis
Gold posted a long upper shadow bearish candlestick yesterday, indicating weak upward momentum and selling pressure near recent highs. The daily chart has shown multiple failures to break above previous highs, signaling fading bullish strength. Currently, price action remains in a high-level, low-volume consolidation, with both daily and weekly charts showing repetitive sideways movement and no clear breakout direction.
On the 4-hour chart, gold was rejected near the upper range at $3375 and fell sharply. After breaking below the mid-range support, the price found minor support near the lower band. The overall structure remains a wide-range consolidation, lacking sustained directional movement.
🔴 Key Resistance Levels: 3345–3350; if broken, gold may test the 3400 psychological level.
🟢 Key Support Levels: 3322–3330; if breached, prices could decline further toward 3300.
✅ Trading Strategy Reference
🔺 Long Position Strategy:
🔰If the price pulls back to below the $3325–$3330 zone and shows signs of support, consider entering a light long position. Set a stop-loss below $3310, targeting $3340–$3350–$3360.
🔻 Short Position Strategy:
🔰If the price rebounds to the $3344–$3350 resistance zone and stalls, consider shorting on strength. Set a stop-loss above $3355, with targets at $3320, $3310, and $3300.
✅ Risk Warning
The U.S. PPI data will be released today. If the data significantly exceeds expectations and inflationary pressures rise, gold may come under renewed selling pressure and potentially break below the key $3300 support level. Conversely, if the data is moderate, it could ease market concerns and help stabilize gold prices.

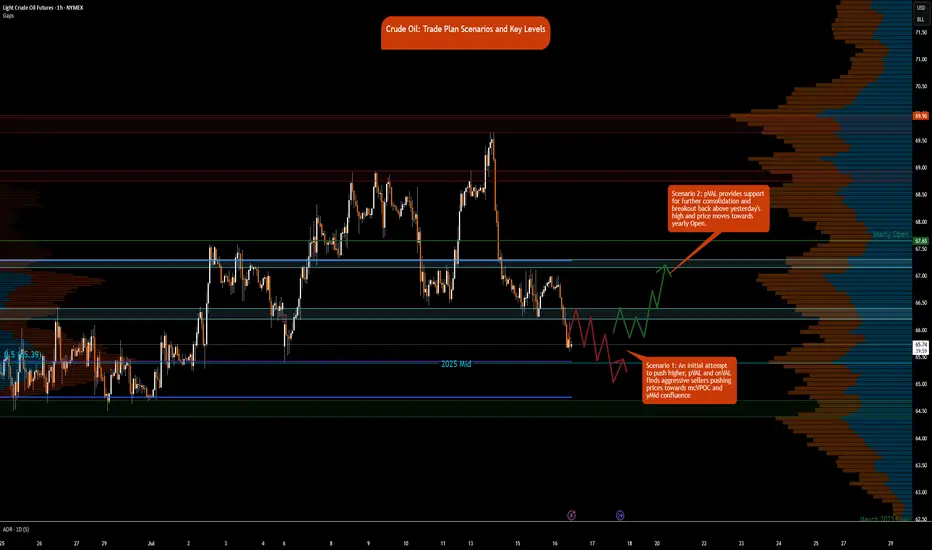
Crude Oil Trade Plan Scenarios and Key Levels
NYMEX:CL1!
It’s Wednesday today, and the DOE release is scheduled for 9:30 a.m. CT. This may provide fuel—pun intended—to push prices out of the two-day consolidation. Also, note that the August contract expires on July 22, 2025. Rollover to the September contract is expected on Thursday/Friday. You can see the pace of the roll here at CME’s pace of roll tool . The chart shows that rollover is about 70% complete, and CLU25 has higher open interest. Note, the front-month August contract is still trading at higher volume.
What has the market done?
Crude oil is in a multi-distribution profile since the peak witnessed during the Iran-Israel conflict. Crude oil formed a strong base above the 64s and traversed towards the 69s. Prices were rejected at these highs and have since reverted back towards the monthly Volume Point of Control, monthlyVPOC.
What is it trying to do?
The market is in active price discovery mode and has formed multi-distributions since June 23. The market has been consolidating after prices at highs were rejected.
How good of a job is it doing?
The market is active and is also providing setups against key levels. Patience to take trades from these higher time frame levels is what is required to trade crude oil currently. Otherwise, there is a lot of volatility and chop that can throw traders off their plan.
Key Levels:
• Yearly Open: 67.65
• Neutral zone: 67.15–67.30
• 2-Day VAL (Value Area Low): 66.40
• Neutral zone: 66.40–66.20
• 2025 Mid-Range: 65.39
• Key Support: 64.40–64.70
What is more likely to happen from here?
Scenario 1: An initial attempt to push higher, pVAL and onVAL finds aggressive sellers pushing prices towards mcVPOC and yMid confluence
Scenario 2: pVAL provides support for further consolidation and break back above yesterday's high and price moves towards yearly Open.
Glossary:
pVAL: Prior Value Area Low
onVAL: Overnight Value Area Low
yMid: 2025 Mid-Range
mcVPOC: Micro Composite Volume Point of Control
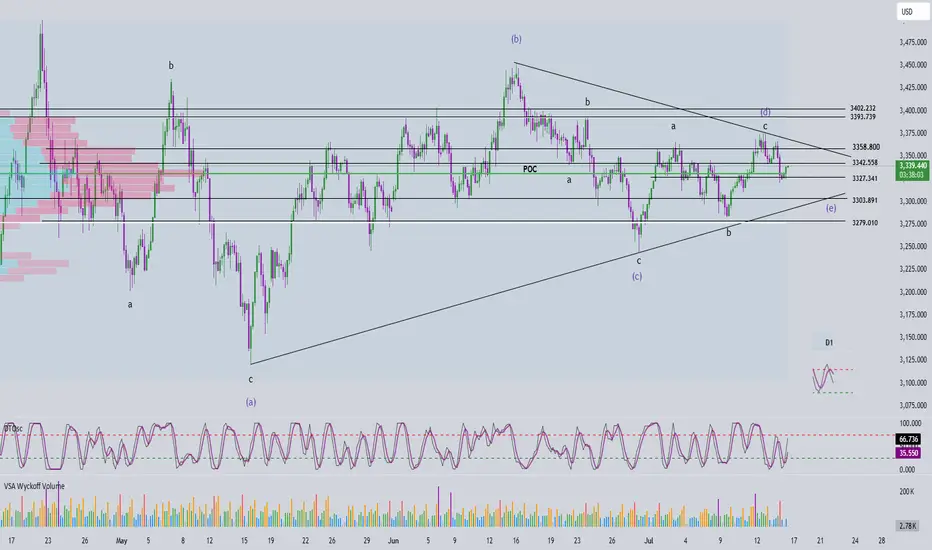
Gold Chart Triangle PatternThis structure currently favors a contracting triangle, now developing the E wave of the pattern. It remains valid as long as the price stays above 3246.550. A safe trade setup would be to wait for a breakout above the D wave.

HelenP I. Gold will continue to decline and break support levelHi folks today I'm prepared for you Gold analytics. After a prolonged period of consolidation, we can observe how price has formed a symmetrical pennant pattern. Price respected both the descending and ascending trend lines, bouncing several times from each side. Recently, gold tested the upper boundary of the pennant near the 3390 resistance level but failed to break through, confirming the strength of the resistance zone between 3390 and 3400 points. Following this rejection, the price started to decline and is now approaching the support level around 3305. If this support doesn’t hold, the price may drop further and break out of the pennant downward. In that case, the nearest significant target lies at 3280 points — near the lower trend line and previous reaction zones. Given the current structure, repeated rejection from resistance, and narrowing volatility inside the pattern, I expect XAUUSD to exit from the pennant and move down, breaking the support zone. That’s why I remain short-term bearish and set my goal at 3280 points. If you like my analytics you may support me with your like/comment.❤️
Disclaimer: As part of ThinkMarkets’ Influencer Program, I am sponsored to share and publish their charts in my analysis.

Elliott Wave Analysis – XAUUSD July 16, 2025🔄 Momentum Analysis
D1 timeframe: Momentum is currently reversing to the downside, suggesting that the price may continue to decline or move sideways in the short term.
H4 timeframe: Momentum is rising, indicating that the current recovery may continue. The next resistance zones to watch are 3342 and 3358.
🌀 Elliott Wave Structure
At present, price action is being compressed within a contracting triangle corrective pattern, with its range narrowing further—signaling market consolidation. We should closely monitor for signs of a breakout that could end this correction.
Based on the current wave structure, it is expected that wave d (green) has completed, and the current downward move is likely part of wave e (green).
The trading strategy focuses on waiting for the price to approach the lower boundary of the triangle—drawn from the low of wave a to the low of wave c—looking for confluent support areas near this trendline to identify a potential BUY opportunity.
🎯 Target & Trade Plan
BUY ZONE: 3303 – 3300
Stop Loss (SL): 3290
Take Profits (TP):
- TP1: 3327
- TP2: 3358
- TP3: 3402
CL BULLISHHello,
I just noticed that oil has a good chance of rising, with a slight short-term uptrend, and I hope this helps you with your trading.
See you soon.

GOLD FULL UPDATE – July 15, 2025 | Post-CPI TrapPost-CPI Flip Zone Battle
Hello dear traders 💛
Today has been one of those heavy CPI days — full of volatility, sweeps, and doubt. But if we read it structurally and stop chasing candles, everything makes sense. Let’s break it all down step by step, clearly and human-like.
Current Price: 3330
Bias: Short-term bearish, reactive bounce underway
Focus Zone: 3319–3320 liquidity sweep + key decision structure unfolding
🔹 Macro Context:
CPI came in slightly hot year-over-year (2.7% vs 2.6%) while monthly stayed in-line at 0.3%. That gave the dollar a short-lived boost, and gold reacted exactly how institutions love to play it — sweeping liquidity under 3320, then pausing. Not falling, not flying. Just... thinking.
That reaction matters. Why? Because it shows us indecision. It tells us that gold isn’t ready to break down fully yet, and every aggressive move today was part of a calculated shakeout.
🔹 Daily Structure:
Gold is still stuck below the premium supply zone of 3356–3380. Every attempt to rally there for the past few weeks has failed — including today.
The discount demand area between 3280–3240 is still intact and untouched. So what does this mean?
We are in a macro-range, and price is simply rotating between key structural edges.
🔹 H4 View:
The rejection from CPI at 3355–3365 created a micro CHoCH, signaling the bullish leg is now broken.
After the 3345 fail, price dropped to 3320 — but it hasn’t tapped the full H4 demand at 3310–3300.
H4 EMAs are tilting down, showing pressure. This isn’t a breakout. It’s a correction inside a larger range.
🔸 Key H4 Supply Zones:
3345–3355: liquidity reaction during CPI
3365–3375: untested OB + remaining buy-side liquidity
🔸 Key H4 Demand Zones:
3310–3300: mitigation zone from the CHoCH
3282–3270: deep discount and bullish continuation zone if current fails
Structure-wise: We are in a correction, not a clean uptrend. That’s why every bullish attempt fails unless confirmed.
🔹 H1 Real Structure
This is where things got tricky today.
Price formed a bullish BOS back on July 14, when we first pushed into 3370. That was the start of the bullish leg.
But today, we revisited the origin of that BOS, right near 3320. This is a sensitive zone.
If it holds → it’s still a retracement.
If it breaks → we lose the bullish structure and shift full bearish.
So far, price touched 3320, bounced weakly, but has not printed a bullish BOS again.
🔸 H1 Zones of Interest:
Supply above:
3340–3345: micro reaction zone
3355–3365: CPI origin rejection
3370–3375: final inducement
Demand below:
3310–3300: current flip test
3282–3270: if this breaks, bias flips bearish
Right now, we are between zones. Price is undecided. RSI is oversold, yes — but that alone is never a reason to buy. We need structure. We need BOS.
🔻 So… What’s the Truth Right Now?
✅ If 3310–3300 holds and price builds BOS on M15 → a clean long opportunity develops
❌ If 3310 breaks, and we lose 3300, structure fully shifts and opens downside to 3280–3270
On the upside:
Only look for rejections from 3355–3365 and 3370–3375
Anything inside 3325–3340 is noise. No structure, no clean RR.
Final Thoughts:
Today’s move was not random. It was a classic CPI trap: induce longs early, trap shorts late, and leave everyone confused in the middle.
But we don’t trade confusion — we wait for structure to align with the zone.
If M15 or H1 prints a BOS from demand, that’s your green light.
If price collapses under 3300, flip your bias. The chart already told you it wants lower.
No predictions. Just real reaction.
—
📣 If you like clear and simple plans, please like, comment, and follow.
Stay focused. Structure always wins.
📢 Disclosure: This analysis was created using TradingView charts through my Trade Nation broker integration. As part of Trade Nation’s partner program, I may receive compensation for educational content shared using their tools.
— With clarity,
GoldFxMinds

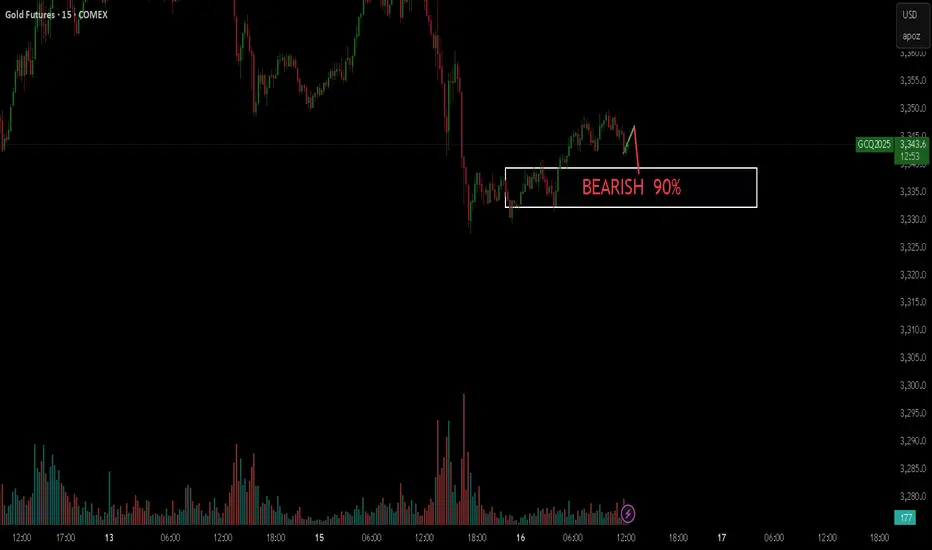
GOLD BEARISH 90%Hello,
I see a very high probability that the gold market will fall in the short term.