GOLD ON break and retest ,we have seen market reacting before my preferred sell zone.
trading is 100% probability
Futures market

The latest trend and strategy of gold on July 1:
1. Core driving logic: Intensified long-short game
Risk aversion supports gold prices
Geopolitical risks: Trump's tough stance on Iran (considering military action) triggers market risk aversion demand, and bargain hunting intervenes.
Uncertainty in trade negotiations: The deadline for negotiations on July 9 may change. If it is extended or broken, gold may be driven by safe-haven buying.
Fed policy and economic data suppression
Non-farm data is critical: If the US non-farm employment report on Thursday (July 4) is strong (low unemployment rate, wage growth), it will strengthen the Fed's expectations of raising interest rates, which is bearish for gold.
Other data impact:
ISM manufacturing PMI on Tuesday: If it is below 50 (shrinking), it may boost gold temporarily.
ADP employment data on Wednesday: As a non-farm outlook, if it is lower than expected, gold prices may rebound.
US dollar trend linkage
If the US dollar index strengthens due to economic data, it will suppress gold; on the contrary, if the US dollar pulls back, gold may usher in a technical rebound.
2. Key technical signals and points
1. Trend structure
Daily level:
The moving average system is in a short position (5/10/60-day moving average is downward), and the short-term weakness was confirmed after breaking the 60-day moving average last week.
Key support: 3247 (0.618 golden ratio + May 29 low), breaking the position will open the downward space to 3220-3200.
Key resistance: 3282 (last Friday's high) → 3305-3315 (moving average suppression + channel upper track).
1-hour level:
The moving average crosses and diverges, MACD runs below the zero axis, the bears dominate but are oversold (RSI is close to 30), and short-term rebound corrections need to be vigilant.
2. Long-short watershed
Short conditions: The price continues to be below 3282, and the rebound cannot break through 3305.
Bull conditions: After standing firm at 3282, break through 3305, or the 3247 support effectively forms a double bottom.
3. Today's operation strategy
1. Main strategy: rebound high
Entry area: 3305-3315 (strong resistance area), stop loss above 3320.
Target: 3270→3247, if it breaks down, look at 3220.
2. Secondary strategy: short-term long position at support level (quick in and out)
Entry point: 3260-3247 stabilizes (if it rebounds quickly and closes positive in 1 hour), stop loss below 3240.
Target: 3282-3300, close the position when encountering resistance.
3. Breakthrough follow-up strategy
Break up 3282: light position to chase long, target 3300, stop loss 3270.
Break down 3247: chase short, target 3220, stop loss 3255.
4. Risk warning and position management
Trade cautiously before non-agricultural data: market volatility may be amplified before the data is released, avoid heavy positions overnight.
Risk of sudden geopolitical conflict: If the situation between the United States and Iran escalates, gold may rise rapidly, and stop loss needs to be adjusted flexibly.
Strict stop loss discipline: single stop loss does not exceed 2% of the principal, and frequent transactions should be avoided in volatile markets.
Summary
Gold is currently in a volatile bearish pattern, but there is technical buying support near 3247. The operation is mainly high-altitude, supplemented by short-term long positions at key support levels. Focus:
Resistance: 3282→3305-3315
Support: 3260→3247→3220

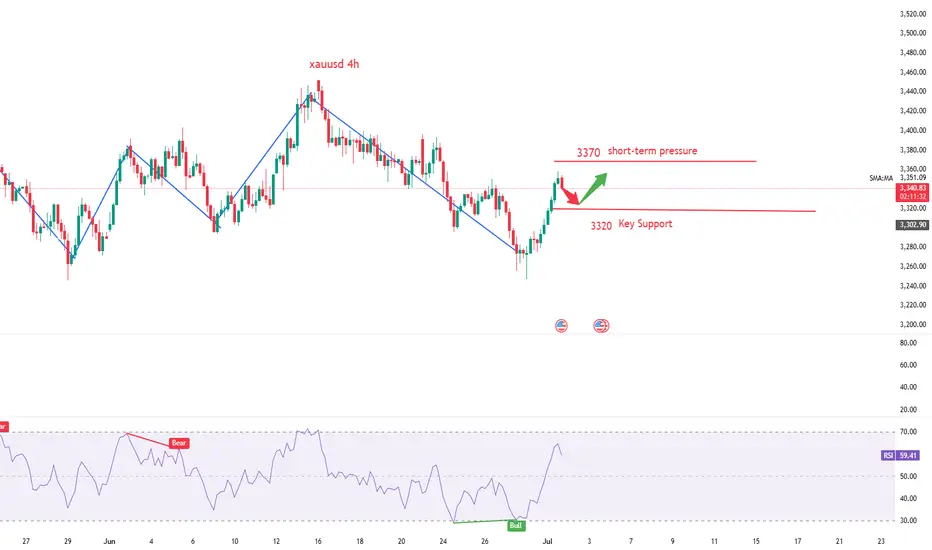
Can gold hit a new high again?During the U.S. trading session, spot gold trended higher in a volatile manner, reaching a three-day high of 3,357.88 as of 22:30. The rally was primarily driven by a weaker U.S. dollar, heightened uncertainty over U.S. trade agreements, and intensified market expectations for Federal Reserve rate cuts. The global economic uncertainties have highlighted gold's safe-haven value. Market participants should monitor the negotiation progress ahead of the tariff deadline on July 9. Traders have priced in at least two rate cuts in 2025. This Thursday's U.S. employment report may catalyze a decline in U.S. Treasury yields. Trump plans to replace Powell, demanding that the new chairman supports rate cuts. The market is focused on this week's ADP and non-farm payroll data to gauge the Fed's policy trajectory.
From a 4-hour technical perspective, the MACD has formed a bullish divergence, triggering a rebound with expanding red histogram bars. Prices are advancing along short-term moving averages, breaking through the previous range of resistance levels, indicating a short-term bullish trend. Before the non-farm payroll data, prices are expected to remain range-bound, with attention paid to safe-haven demand triggered by geopolitical risks. Focus on the opportunity for a secondary rally after the end-of-session pullback confirmation. Short-term resistance is seen at the 3,375-3,380 zone.
On the hourly chart, prices are in a narrow high-range consolidation with limited pullback momentum. Candlesticks maintain strength by relying on short-term moving averages.
you are currently struggling with losses,or are unsure which of the numerous trading strategies to follow,You have the option to join our VIP program. I will assist you and provide you with accurate trading signals, enabling you to navigate the financial markets with greater confidence and potentially achieve optimal trading results.
Trading Strategy:
buy@3330-3335
TP:3360-3365
XAU/USD Start July 20251. i start after XAU/USD break previous High and correction (fibbo 32.0) respected. based on elliot wave strategy we can targeting end of wave 3 at 3353 area and than correction wave 4 (target at fibbo 32.0 - 50.0). after target correction, continue wave 5 at target 3403 area.
2. fundamentally speaking, new months new quarter. there ins't new catalist and sentiment. Macro Economic this week focus on labour market at US and FED projection to cut rate.
3. War at Iran and Israel, Russia and Ukraine, India and Pakistan, Trade War case, etc,.
4. Will be update

Guys we selling hold right?Price has extended so much without any major retracement, we have hit a higher timeframe sup/res line and head and shoulders have formed. entered on bear engulfing breaking neckline of a head and shoulders formation. but now price is retracing back? surely just a retest of the neckline before continuing down? Sorry if this is poor analysis im new to trading. have I missed anything vital that I should have taken into account before I placed this trade?

Cypher Pattern Walkthrough on GoldA look at a potential bearish cypher pattern on gold and an opportunity to trade while the market is stuck in a holding pattern.
Akil

XAU / USD 30 Minute Chart Hello traders. All I can say is KABOOM. 100 pips in profit on this microlot sell trade. I am, as of this writing closing 75% of the trade's profit, moving my stop loss to my entry point (break even) and leaving a runner ( the remaining 25% of the trade) running. What a day. Big G gets all my thanks. Be well and trade the trend. I am very thankful that my analysis was pretty spot on.

How to Trade Double Tops & Bottoms in TradingViewLearn how to identify, validate, and trade double top and double bottom reversal patterns using TradingView's charting tools in this comprehensive tutorial from Optimus Futures. Understanding these classic chart formations can help you spot potential trend reversals and capitalize on contrarian trading opportunities in the futures markets.
What You'll Learn:
• Understanding contrarian vs. continuation trading strategies and when to use each approach
• The psychology behind buying low and selling high through reversal pattern trading
• How to identify double top and double bottom formations on any timeframe
• Key characteristics of valid double tops and bottoms, including volume confirmation
• Using TradingView's XABCD pattern tool to validate potential double top/bottom setups
• Real-world example analysis using crude oil futures charts
• Risk management techniques for trading reversal patterns
• How to calculate appropriate entry points, stop losses, and profit targets
• Setting up 1:1 risk-reward ratios for mathematical trading edge
• Understanding win rate requirements for profitable pattern trading
• How double bottom patterns work as the inverse of double top formations
This tutorial may benefit futures traders, swing traders, and technical analysts interested in contrarian trading strategies and reversal pattern recognition. The concepts covered could help you identify potential turning points in market trends and develop systematic approaches to trading these classic chart formations.
Visit Optimus Futures to learn more about trading futures with TradingView: optimusfutures.com/Platforms/TradingView.php
Disclaimer:
There is a substantial risk of loss in futures trading. Past performance is not indicative of future results. Please trade only with risk capital. We are not responsible for any third-party links, comments, or content shared on TradingView. Any opinions, links, or messages posted by users on TradingView do not represent our views or recommendations. Please exercise your own judgment and due diligence when engaging with any external content or user commentary.
This video represents the opinion of Optimus Futures and is intended for educational purposes only. Chart interpretations are presented solely to illustrate objective technical concepts and should not be viewed as predictive of future market behavior. In our opinion, charts are analytical tools—not forecasting instruments. Market conditions are constantly evolving, and all trading decisions should be made independently, with careful consideration of individual risk tolerance and financial objectives.

XAU/USD : GOLD AnalysisGold now shifts its direction downward as it was rejected from an hourly Order Block.
I am planning a short position in it, you guys can trade accordingly by managing your risk

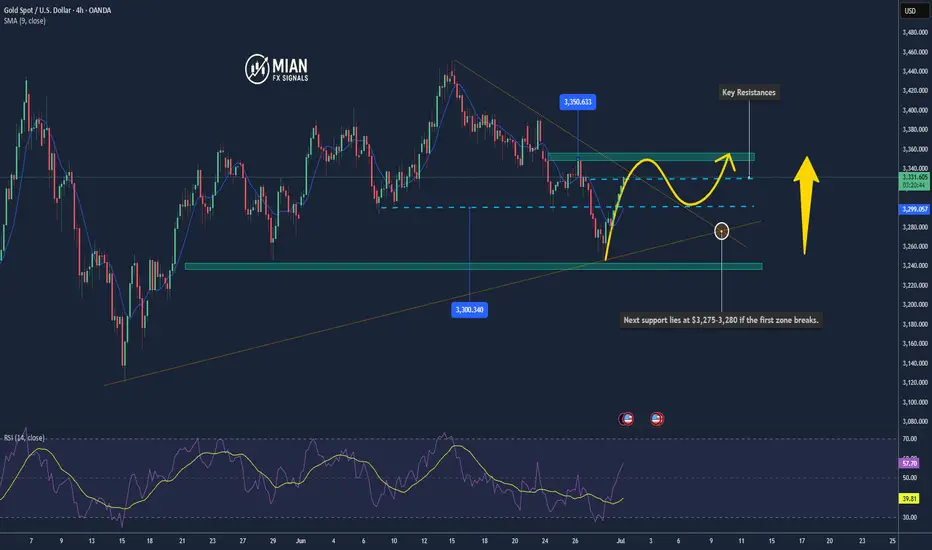
Gold Might Break Higher As It Hits $3,330 Resistance📊 Market Drivers
Gold has just climbed to $3,330/oz, supported by ongoing safe-haven demand and a slightly weaker U.S. dollar ahead of Fed Chair Powell’s speech. Investor expectations of a rate cut in September are keeping bullish momentum alive.
________________________________________
📉 Technical Analysis
• Resistance:
→ $3,330–3,335 (50-day SMA & Fibonacci level)
A breakout above $3,335 could open the door to $3,350+.
• Support:
→ $3,300–3,310 (psychological level & EMA9)
→ Next support lies at $3,275–3,280 if the first zone breaks.
• EMA09:
Price is currently above the 9-EMA, confirming a short-term bullish trend.
• Momentum Indicators:
o MACD is bullish; Stochastics is high — all signaling upside, though a short-term pullback may occur if the resistance holds.
________________________________________
📌 Outlook
Gold is likely to continue climbing in the short term if it breaks above the $3,330–$3,335 resistance zone, fueled by bullish sentiment and dovish Fed expectations.
If it fails to break higher, a minor correction toward $3,300–$3,310 could follow.
________________________________________
💡 Suggested Trade Strategy
BUY XAU/USD : $3,320–3,325
🎯 TP: 40/80/200 pips
❌ SL: $3,310
SELL XAU/USD : $3,340–3,345
🎯 TP: 40/80/200 pips
❌ SL: $3,350
Gold price rises by more than $100, will the bull run continue?📰 News information:
1. Geopolitical situation
2. PMI data
3. Global Central Bank Governors Meeting
📈 Technical Analysis:
The NY session is about to begin, and there are two things we need to pay attention to. First, the PMI data, and second, the talks between global central bank governors. If Powell again hints that the inflation outlook is weaker than expected, this will increase the Fed's easing bets and trigger a new round of decline in the US dollar. The dovish tone may help gold prices to further rebound. On the contrary, if Powell makes some hawkish or cautious remarks, this may exacerbate the recent downward trend in gold prices. The key point at present is the 3350 mark. If the 4H closing line of the NY session remains below 3350, then in the short term we are expected to continue to retreat to the 3330-3320 range. If the 4H closing line is above 3350 and stabilizes, gold may rebound to the 61.8% position, which is around 3372.
🎯 Trading Points:
SELL 3340-3350-3355
TP 3330-3325-3320
BUY 3330-3320
TP 3340-3350-3372
In addition to investment, life also includes poetry, distant places, and Allen. Facing the market is actually facing yourself, correcting your shortcomings, confronting your mistakes, and strictly disciplining yourself. I hope my analysis can help you🌐.
FX:XAUUSD FXOPEN:XAUUSD PEPPERSTONE:XAUUSD FOREXCOM:XAUUSD FX:XAUUSD OANDA:XAUUSD TVC:GOLD

How to Trade the Commitment of Traders Report Part 2Hey Traders so today in part 2 wanted to go over more about how to read the report, and what it means when you see changes in positioning.
Enjoy!
Hope This Helps Your Trading 😃
Clifford

XAUUSD - SELL After a reasonable big run up like this they will take profits
Looks like it's roiling over watching Super Trend and break of
Buffer Zone with Bearish Continuation Candle can easily Shoot back up if Wicks but should be plenty of room to make money on this one.
Hardest part is being patient
Selling seems to capitulate everyone wants to capture as much profit as possible or should I say Algo's
NY also current session so they have plenty of push and Greedy as can be !
USD has turned Strong for now also
Don't forget to protect profits when you deem fit should it run into profit trading Forex - Gold is very unpredictable their game is to take yr money deliberately - do the opposite just to snag yr hard earned cash.
Lets See : )

Gold Bounces from Demand Zone – Next Targets in Sight!By analyzing the gold chart on the 4-hour timeframe, we can see that today, price once again dipped into our key demand zone (Bullish Rejection Block) between $3245 and $3262, where it faced strong buying pressure and rallied up to $3296.
Currently, gold is trading around $3281, and as long as price holds above $3273, we expect further upside. The next potential targets are $3294, $3300, and $3309.
🎥 If you enjoyed this video analysis and found it helpful, please show your support with a LIKE and COMMENT below!
These video-style breakdowns take time and effort, and I’ll only continue them with your support 🙌
Your engagement is my biggest motivation to keep going 💛
Thanks for being part of the journey!

Gold toushes major trendlinemajor trendline on 1d timeframe
RSI divergence
Reverse of trend HH and HL
Risk 1:2

Gold Will Break to New HighThe end of the month has typically been a rough time for gold as options expirations and deliveries affect price. But after the end of the month selling completed with a climax, gold has kept rising and I expect it to continue on to recent highs and on through to new highs.
There has been a lot of talk on YouTube about $4,000 gold. The dollar continues to get destroyed. My thought is $5,000 but even at that point, I wouldn't sell any physical gold.


GOLD/USD 1 HOUR BULLISH ANALYSISthe market is expected to move up wards indicate by the green box and arropointing down wards suggesting potential opportunity

GOLD Massive Short! SELL!
My dear followers,
This is my opinion on the GOLD next move:
The asset is approaching an important pivot point 3350.4
Bias - Bearish
Safe Stop Loss - 3363.2
Technical Indicators: Supper Trend generates a clear short signal while Pivot Point HL is currently determining the overall Bearish trend of the market.
Goal - 3328.2
About Used Indicators:
For more efficient signals, super-trend is used in combination with other indicators like Pivot Points.
Disclosure: I am part of Trade Nation's Influencer program and receive a monthly fee for using their TradingView charts in my analysis.
———————————
WISH YOU ALL LUCK

JULY 1ST 2025 10a4h PO3Daily Bias = Bullish
4h Candle Closure Bias = Bullish
Structural Bias = Bullish
Waiting for 15m Liquidity Sweep or Tap into 15m BISI
Entry = 3m +CISD
Partial = 6a4h Candle High
Runner = June 30th 2025 High or greater

Beware of gold, false rise and real fall
💡Message Strategy
The global economic uncertainty has intensified recently, and the gold market has performed well. On Monday, the price of gold rose by 0.87%, hitting a bottom of $3247.87 per ounce before rebounding strongly. The upward trend continued in early trading on Tuesday. In the second quarter, the price of gold rose by 5.5%, rising for two consecutive quarters.
The main reason for this round of gold price rise is the weakening of the US dollar. The US dollar index has recorded its worst performance in the first half of the year since the 1970s. Market concerns about the expansion of the US fiscal deficit and uncertainty in trade agreements have weakened the attractiveness of the US dollar.
At the same time, global trade and geopolitical fluctuations, such as the Sino-US rare earth agreement, the progress of US-EU trade negotiations, and the uncertainty of the tariff deadline on July 9, have strengthened the safe-haven properties of gold. This week's focus is on Thursday's US non-farm payrolls report for June. The market expects 110,000 new jobs and an unemployment rate of 4.3%, which will directly affect the direction of the Federal Reserve's monetary policy.
Although the Federal Reserve is cautious about cutting interest rates, the market generally expects that interest rate cuts will be resumed in September, and the annual interest rate cut may reach 66 basis points. Trump's pressure on the Federal Reserve has also increased policy uncertainty.
Gold is driven up by multiple factors, but its future trend still depends on employment, inflation and tariff policies. Investors need to pay close attention to data and policy developments.
📊Technical aspects
Gold hit bottom and rebounded during the early trading session on Monday, and the price stopped after touching the previous low. The price stopped after touching the four-hour resistance position before the European session. The European session was under pressure before breaking through the four-hour resistance. After that, the U.S. session had consecutive positive days, and the price did not fall. Instead, it further broke through the four-hour resistance position, which means that the price still has the performance of testing the daily level resistance area. We will continue to follow the key breakthrough of 3300 on Monday and pay attention to the 3350-3360 area and then look at the pressure.
According to the daily level, after the price broke through the daily support last week, the price continued to rely on the daily resistance to bear pressure. At present, the daily resistance is at the 3360 area resistance. Below this position, gold can continue to be short.
According to the four-hour level, the four-hour key position is the key to our emphasis on short-term trends. Yesterday, the price broke through the four-hour resistance and is expected to adjust further. The current four-hour support is in the 3300 area. The price is short-term bullish above this position. After the subsequent high, it is expected to fall further after breaking the four-hour support again.
From the one-hour level, yesterday's strong closing, today's early trading again directly broke through yesterday's high position, so today's early trading low became the key. The price above this position tends to continue to test the daily resistance of 3360, so we will first look at the rebound, and wait until the price touches the daily resistance of 3350-3360, and then pay attention to further anti-K signals to see pressure.
💰Strategy Package
Short Position:3350-3360,SL:3370,Target: 3315-3300

International gold prices rise slowly and reach new highsAnalysis of gold trend:
Gold fell sharply near 3247 at the opening of Monday, then stopped falling and began to fluctuate and rise slowly. It rose to a high of 3297 before the European session, then fell back after being blocked. After dropping to 3274, it stabilized again and began to rise slowly. The US session continued to rise. Another key point in the market that everyone needs to pay attention to is that the US dollar index has now hit a new low, and the current price is 96.3. This wave of US dollar decline is extremely weak, and there is basically no sign of rebound. According to this trend, the US dollar index may continue to fall, and it is possible to go to 88. In the case of such a weak US dollar index, it is natural for gold to be supported by the market. Moreover, gold has not yet walked out of the bullish trend. Gold has turned from weakness in the early stage to strength. Next, it depends on the strength of the rise. This wave of rise is expected to see 3350-3400.
From a technical point of view, gold closed positive at a low level on Monday, and the K line was above the lower Bollinger track, turning from weak to strong. Under the bullish trend, the rise can be seen to be continuous, so the high points of the middle and upper Bollinger tracks can be seen above. In the 4-hour chart, the K-line stands firmly above the middle rail of Bollinger, and the moving average system diverges upward, showing a very obvious strong performance. Therefore, the basic idea this week is to continue to do more on the decline. In the short term, first look at the upper rail of Bollinger in the 4-hour chart at 3350. There are two points to pay attention to in the decline of the small cycle within the day, one is 3300, and the other is 3285 support. Although bullish, do not chase high. After the decline, make sure to stop the decline and continue to be bullish. Operation strategy: Go long when gold falls back to around 3320, stop loss at 3210, and target 3330-3340.

Sugar continue bearish but oversoldFOREXCOM:SUGAR Will continue go bearish but all indicators show that it is oversold. Waiting for the bullish monument and there will be a period of rolling back soon
