Gold 2hours bearish analysisThe image shows a computer screen displaying a trading platform with a chart for Gold Spot / U.S. Dollar (XAUUSD) on a 2-hour time frame from OANDA. The chart features a candlestick pattern with red and blue bars, indicating price movements over time
Futures market

Glod 2hours bearish analysis Meta AI: The image shows a computer screen displaying a trading chart for Gold Spot/U.S. Dollar on the TradingView platform. The chart is set to a 2-hour time frame and features a candlestick pattern with red and green bars, indicating price movements.

Gold 1hour bulish analysis Meta AI: The image shows a computer screen displaying a trading platform, specifically a chart for Gold Spot / U.S. Dollar on the OANDA platform. The chart is set to a 1-hour time frame and displays the price action of gold over the past two hours.

Gold 1hour bearish analysis The chart is presented in a dark mode interface, with red and green candlesticks indicating price movements over time. Various technical indicators are available, including moving averages, relative strength index (RSI), and Bollinger Bands, although none are currently applied to the chart. A replay feature is also available, enabling users to review historical price action and analyze past market trends. The overall impression suggests that the user is actively monitoring the Gold market, potentially for trading or investment purposes.

Brent Crude Oil loss of support now resistance at 7050Key Support and Resistance Levels
Resistance Level 1: 7050
Resistance Level 2: 7130
Resistance Level 3: 7220
Support Level 1: 6800
Support Level 2: 6700
Support Level 3: 6590
This communication is for informational purposes only and should not be viewed as any form of recommendation as to a particular course of action or as investment advice. It is not intended as an offer or solicitation for the purchase or sale of any financial instrument or as an official confirmation of any transaction. Opinions, estimates and assumptions expressed herein are made as of the date of this communication and are subject to change without notice. This communication has been prepared based upon information, including market prices, data and other information, believed to be reliable; however, Trade Nation does not warrant its completeness or accuracy. All market prices and market data contained in or attached to this communication are indicative and subject to change without notice.

Gold 2hours bulish analysisThe image shows a computer screen displaying a graph with a green and red bar chart. The graph is titled "Gold 2h" and has a black background with white text. The x-axis is labeled with numbers, while the y-axis is labeled with letters. A green bar is visible on the right side of the graph, accompanied by a red bar below it. The overall atmosphere suggests that this is a screenshot of a computer program or website used for tracking gold prices over time.

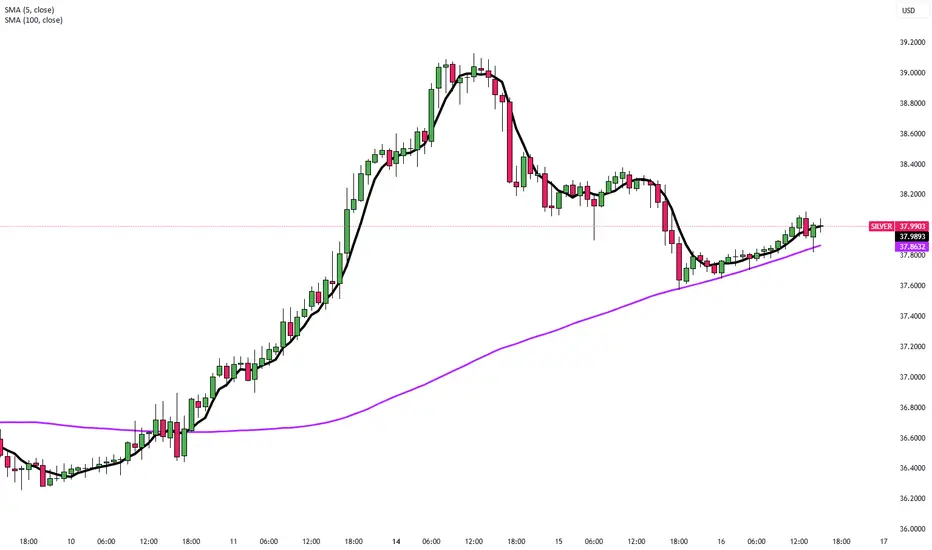
Silver Holds Gains After 14-Year HighSilver traded around $38.10 during Tuesday’s Asian session after hitting a 14-year high of $39.13 on Monday. Safe-haven demand remained firm following Trump’s threat of severe tariffs on Russia unless a peace deal is reached within 50 days. Further fueling uncertainty, NATO confirmed a new weapons package for Ukraine.
Meanwhile, Powell’s comments on inflation risks tied to tariffs raised doubts over near-term Fed rate cuts, weighing slightly on silver. Trump’s renewed criticism of the Fed Chair also reignited concerns over central bank independence. Tariff negotiations with the EU continue, though tensions persist, especially after the U.S. slapped a 17% duty on fresh tomato imports from Mexico.
Resistance is at 38.50, while support holds at 38.00.
Gold Rises as Global Tariff Pressures BuildGold edged higher to $3,350 on Tuesday after easing slightly the day before, driven by growing concern over U.S. trade policy. Trump issued formal letters to 25 countries confirming that new tariffs, including a 30% tax on imports from key partners like the EU and Mexico, will begin on August 1. Safe-haven flows supported gold prices with the rising geopolitical uncertainty.
Resistance is at $3,370, while support holds at $3,330.
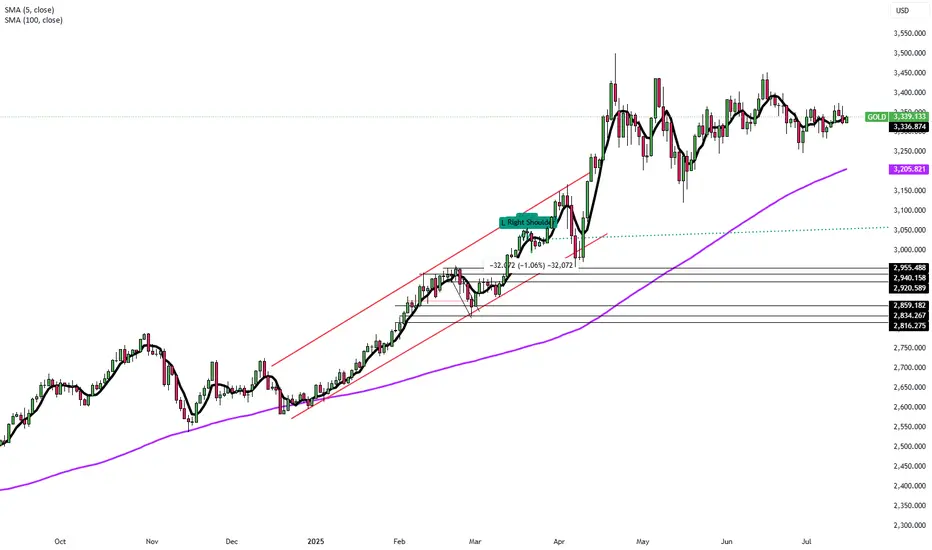
GOLD BUYGold defends 50-day SMA ahead of US PPI inflation data
Gold price attempts a tepid bounce early Wednesday as focus shifts to trade updates and US PPI data. The US Dollar retreats alongside Treasury bond yields even as risk-off flows persist. Gold price needs to crack the 50-day SMA support at $3,323; daily RSI reclaims midline.
As observed on the daily chart, Gold price is stuck between two key barriers, with the 21-day Simple Moving Average (SMA) support-turned-resistance at $3,335 checking the upside.
On the other hand, the 50-day SMA at $3,323 cushions the downside.
The 14-day Relative Strength Index (RSI) is sitting just above the midline, currently near 50.50, suggesting that buyers could retain control.
Acceptance above the 21-day SMA is critical to sustaining the renewed upside, above which the 23.6% Fibonacci Retracement (Fibo) level of the April record rally at $3377 will be put to the test once again.
Further north, the $3,400 round level will challenge bearish commitments.
In contrast, rejection at the 21-day SMA could attack the 50-day SMA support.
Sellers must find a strong foothold below the 50-day SMA on daily closing basis.
The next healthy support levels are located at the 38.2% Fibo level of the same rally at $3,297 and the July low of $3,283.
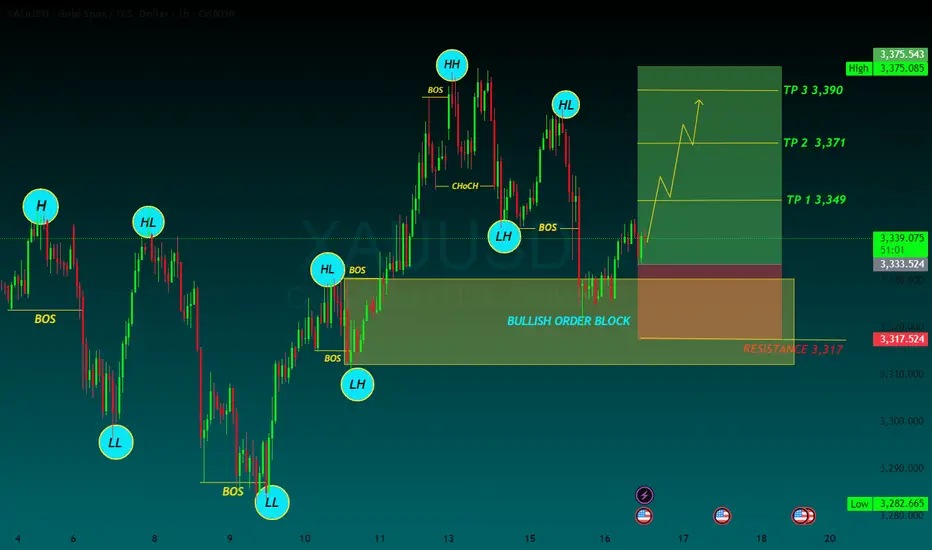
TP 1 3,349
TP 2 3,371
TP 3 3,390
RESISTANCE 3,317
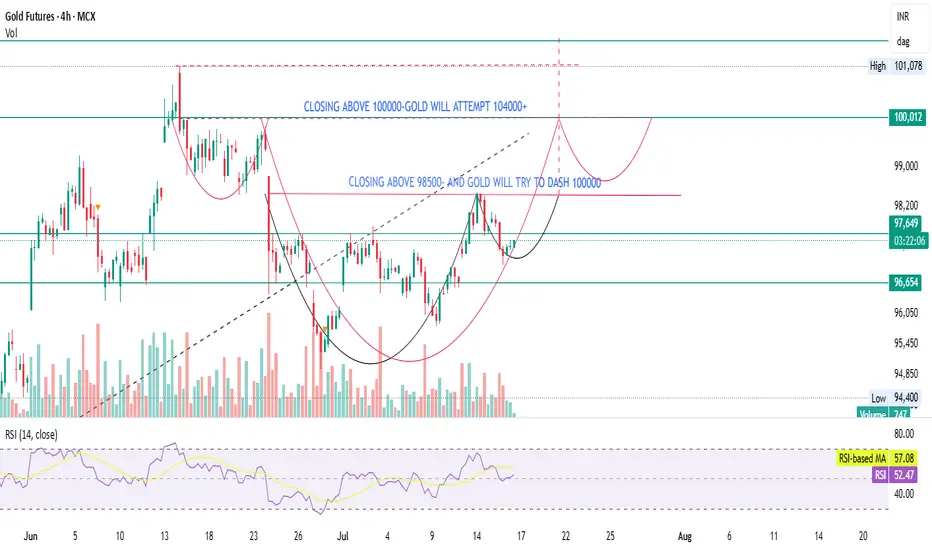
GOLD- CONTRARION OPINIONGold is forming a bullish structure, but a confirmed breakout above ₹98,500 (on volume) is essential for momentum toward ₹100,000.
If ₹100,000 is broken with strength, ₹104,000+ is a reasonable technical target.
RSI is neutral, allowing room for upside.
Watch for a volume spike and confirmation candles before entering.
WTI Crude corrective pullback testing support at 6500Trade Tensions & Inflation Impact on WTI Crude
Tariff Announcement: The US has imposed reciprocal tariffs on 22 nations, including major trade partners such as the EU, Japan, Canada, Mexico, and South Korea, after a failed trade agreement during the 90-day negotiation window.
EU Response: The EU is preparing retaliatory tariffs unless a deal is reached before the August 1 deadline, raising the risk of a trade war escalation.
Trump's Warning: The US President has threatened additional tariffs if retaliatory measures are enacted, compounding uncertainty in global trade flows.
Inflation Spike: US June CPI rose to 2.7% YoY, in line with expectations. The increase was driven by higher prices of imported goods, as tariffs begin affecting consumer costs.
Fed Policy Impact: Rising inflation weakens the case for a Fed rate cut in September, dampening liquidity expectations and investor risk sentiment.
Conclusion for WTI Crude Trading
The combination of rising inflation, tariff-driven cost pressures, and a potential stall in Fed easing is bearish for WTI crude in the near term.
Additionally, intensifying trade tensions threaten global demand outlooks, which may further weigh on oil prices.
Traders should expect near-term downside pressure on WTI crude unless there is a clear de-escalation in trade rhetoric or a surprise dovish pivot from the Fed.
Bias: Cautiously Bearish on WTI Crude near term.
Key Support and Resistance Levels
Resistance Level 1: 6830
Resistance Level 2: 6940
Resistance Level 3: 7045
Support Level 1: 6500
Support Level 2: 6435
Support Level 3: 6370
This communication is for informational purposes only and should not be viewed as any form of recommendation as to a particular course of action or as investment advice. It is not intended as an offer or solicitation for the purchase or sale of any financial instrument or as an official confirmation of any transaction. Opinions, estimates and assumptions expressed herein are made as of the date of this communication and are subject to change without notice. This communication has been prepared based upon information, including market prices, data and other information, believed to be reliable; however, Trade Nation does not warrant its completeness or accuracy. All market prices and market data contained in or attached to this communication are indicative and subject to change without notice.

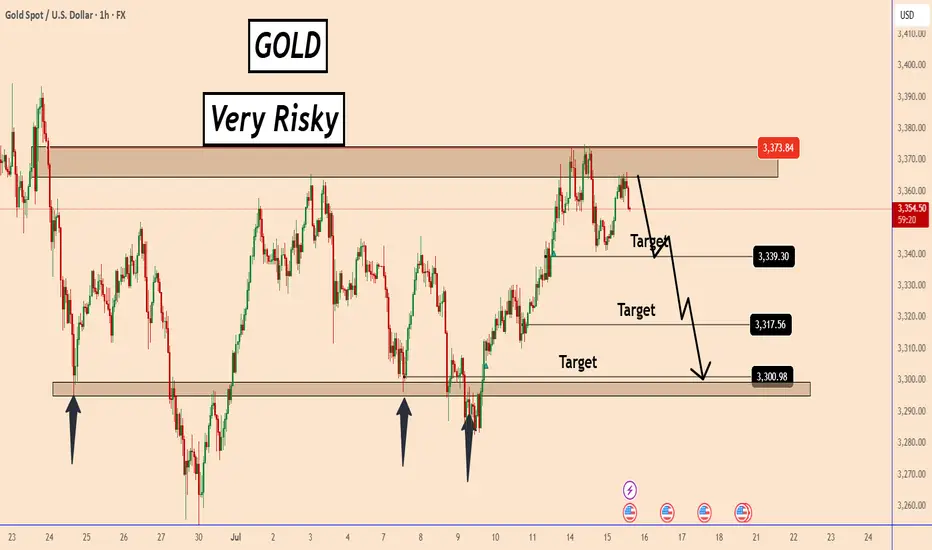
GOLD: A Short-Term Trading Setup - High RiskGOLD: A Short-Term Trading Setup - High Risk
Since July 9, GOLD has been in an uptrend, rising to 3375 as its current high.
The market focus is solely on the Fed’s interest rate cut and when it might happen. Today we have the US CPI data in about 30 minutes. The market expects the CPI to be 2.7% vs. 2.4%.
The market is expecting a bullish data, which increases the odds that the Fed will not cut rates anytime soon and should reduce the odds of an interest rate cut at the July meeting.
From a technical perspective, the price is already facing a strong zone and the chances of a decline are high. However, this trade carries a higher than normal risk, as we can never know how the market may interpret inflation data and its impact on future interest rate cuts.
You may find more details in the chart!
Thank you and Good Luck!
PS: Please support with a like or comment if you find this analysis useful for your trading day
Treat intraday fluctuations as long first and short later!Gold started to rebound near 3322 at the opening. Our long positions near 3324 are also in floating profit. We first focus on the short-term suppression of 3340-3345 on the upper side. The support below is at 3325-3320. We operate in this range. Technically, it needs to rebound and repair the demand when it falls back to 3320, so we can find opportunities to go long to grasp the profit space of the rebound.
4-hour cycle analysis: The strong dividing line of long positions below is at the 3320 first-line mark, and the short-term support focuses on the 3325-3320 range. The overall bullish rhythm of pulling back to lows and going long is maintained. Short-term pressure focuses on around 3340-3345. The overall main tone of participating in the high-altitude and low-multiple cycles remains unchanged relying on this range.
Gold operation strategy: Go long on gold when it falls back to around 3325-3320, target 3335-3340, and continue to hold if it breaks through.

downtrend, back to 3300 gold price⭐️GOLDEN INFORMATION:
Gold prices (XAU/USD) inch higher in early Asian trading on Wednesday, recovering part of Tuesday’s sharp decline to multi-day lows, though follow-through buying remains limited. Lingering uncertainty surrounding US President Donald Trump’s trade tariffs, combined with expectations that the Federal Reserve (Fed) will maintain elevated interest rates, continues to dampen risk appetite. This weaker market mood is providing modest support to the safe-haven metal.
Meanwhile, the US Dollar (USD) eases slightly after Tuesday’s surge to its highest level since late June, which is helping gold stabilize. However, persistent speculation that the Fed may delay rate cuts, following a slight uptick in US inflation, continues to bolster the greenback and could cap further gains in gold. Traders remain cautious and await today’s US Producer Price Index (PPI) release for clearer direction.
⭐️Personal comments NOVA:
Selling pressure, break 3340 downtrend line continues. Economic news is helping DXY recover
⭐️SET UP GOLD PRICE:
🔥SELL GOLD zone: 3381- 3383 SL 3388
TP1: $3370
TP2: $3360
TP3: $3350
🔥BUY GOLD zone: $3306-$3304 SL $3299
TP1: $3318
TP2: $3330
TP3: $3343
⭐️Technical analysis:
Based on technical indicators EMA 34, EMA89 and support resistance areas to set up a reasonable SELL order.
⭐️NOTE:
Note: Nova wishes traders to manage their capital well
- take the number of lots that match your capital
- Takeprofit equal to 4-6% of capital account
- Stoplose equal to 2-3% of capital account

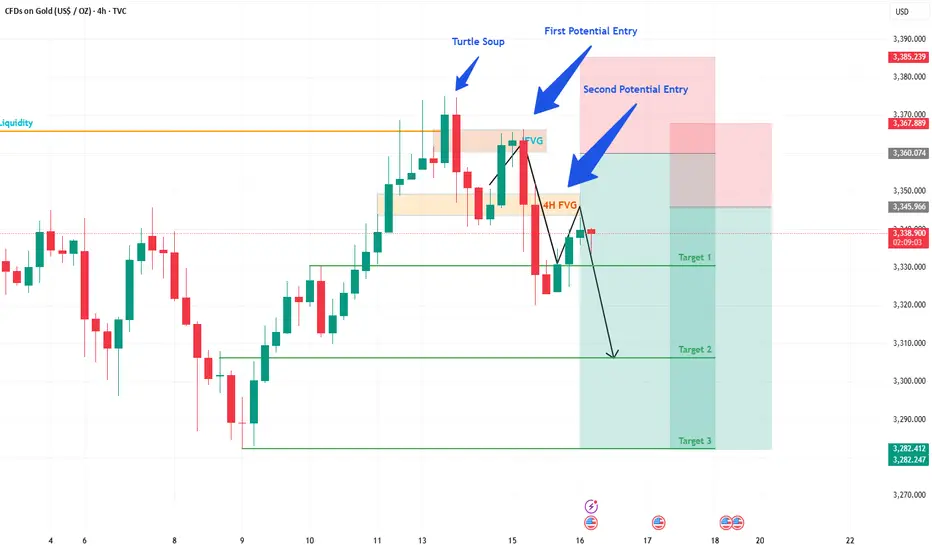
Gold Trade Update: Another Win & What's Next!Hey Fellow Traders! 👋
What a week for Gold! On Monday, I shared my Gold analysis and trade idea, pinpointing a key 1H FVG zone. And guess what? The trade played out perfectly! 🎉 The price dropped ~400 pips from our highlighted area with a tiny drawdown of just 30-40 pips. We smashed Target 1 (TP1), and the market even pushed beyond it! 🙌 Huge congrats to everyone who jumped on this trade! 💰
📈 What's Happening Now?
The price action is heating up! Gold has broken through the 4H FVG, which now acts as an IFVG. The price has retraced almost perfectly to this IFVG, triggering our second layer of entry. 🚦 This is a prime setup, and we’re eyeing TP1 again—and potentially beyond! 🌟
💡 What's the Plan?
Entry: Triggered at the IFVG retracement.
Target: Aiming for TP1, with room for more upside.
Stay sharp and manage your risk—let’s keep those drawdowns tight!
🗣️ Join the Conversation!
What did you think of this move? Did you catch the Gold trade? Drop a comment below, give this post a LIKE 👍, and FOLLOW for more trade ideas and updates! Let’s keep the momentum going and crush it together! 💪
#TradingView #Gold #PriceAction #TradingSuccess
XAU / USD 30 Minute ChartHello taders. We have news here in the US in under an hour. Saying that, I marked the scalp buy and sell areas. Smarter trading would be for a break out of the range so I can take trades with clean traffic and less choppiness. Let's see if I can get an entry, otherwise I will wait for post news / NY open to look again. Big G gets a shout out. Be well and trade the trend.

XAUUSD Short Based on a Fakeout + Rejection + Retrace Strategy💡 Strategy Flow
I'm seeing:
1. Fakeout – Price broke above resistance (3349–3350) and wicked into 3368–3372.
2. Rejection – Price quickly fell back below the resistance zone (classic bull trap).
3. Retrace to resistance – Price has now returned to the 3349–3350 zone, which is likely acting as new resistance again.
✅ Current price is sitting at the retrace area, after the initial rejection.
---
🔮 What should happen next?
According to this strategy, the next expected move is:
🔻 Rejection from resistance ➝ Bearish continuation
In detail:
> Price should fail to break resistance again.
> Sellers should step in around this level.
> If valid, price should drop, targeting:
🔹 Conservative TP: 3280
🔹 Aggressive TP: 3241.5
---
🎯 Entry Setup
Type Entry Stop Loss Take Profit Risk-Reward
Conservative 3349.0 3376.5 3280.0 ~1:1.6
Aggressive 3339.5 3378.5 3241.5 ~1:2.5
📍 Entry can be confirmed with bearish rejection candle on the resistance retest.
📈 Targeting previous swing low and major support zone around 3246–3247.
---
Symbol:
$BYBIT:XAUTSDT.P OANDA:XAUUSD
---
🧠 Strategy Logic:
This is a Smart Money-style trap play, where liquidity is swept above a well-known resistance, then price rejects and retraces back for a high-probability entry.
This fakeout–retest–drop sequence is deadly when aligned with market structure and zones like this.
---
🏷️ Hashtags:
#XAUTUSDT #XAUUSD #SmartMoney #LiquidityGrab #PriceAction #Fakeout #Retest #BearishSetup #BreakAndRetest #TradingView #SMC #TechnicalAnalysis #Forex #Crypto #StopHunt
---

Gold breast analysis (read caption) Hi trader
Good current price: 3336
Gold is break supporter zone gold now target 3320 and 3310
And stop loss 3346
Please like comments and follow thank you

Gold price fluctuated upward today: target 3400 pointsGold price fluctuated upward today: target 3400 points
Fundamentals:
CPI data: US CPI rose 0.3% month-on-month in June (the largest increase since January), and the core CPI annual rate rose to 2.9%, which strengthened the market's cooling of the Fed's expectations for rate cuts (the probability of a rate cut in September fell to 53%).
US dollar index: rose to 98.70 (a three-week high), suppressing the attractiveness of gold.
Trump's tariff policy: plans to impose tariffs of "slightly above 10%" on several small countries, and the EU plans to impose retaliatory tariffs of US$84.1 billion on US goods, supporting the safe-haven demand for gold.
Technical aspects:
(1) Short-term trend (4-hour line)
Support level: 3320, if it falls below, it will fall to 3300 or even 3222.
Resistance level: 3350 (short-term pressure level), after breaking through, it is expected to challenge 3375-3400.
MACD and RSI: Showing a tug-of-war between bulls and bears, tending to fluctuate upward in the short term.
(2) Medium- and long-term trends (weekly chart)
The rising channel remains intact, the Bollinger Band opening widens, and the medium-term target is $3,400-3,700.
Today's focus
US June PPI data (if it exceeds expectations, it may further suppress expectations of interest rate cuts).
Speech by Fed officials (pay attention to policy direction).
Progress of the trade war (if the tariff conflict escalates, gold may receive safe-haven buying).
Summary and operational suggestions
Short-term:
Gold prices fluctuate in the 3300-3400 range, pay attention to the breakthrough of the 3320 support level and the 3350 resistance level.
Strategy:
Buy on dips (try to go long with a light position near 3330 points, with a stop loss below 3320 points).
Go long after breaking through 3350 (target 3375-3400).
If it falls below 3320, it may further correct back to the 3300-3250 area.
Gold has limited safe-haven supportGold has limited safe-haven support, and the opportunity to short at high levels is emerging
Short-term safe-haven support
Trump said that he would impose a 10% tariff on small countries, which caused market concerns, and the gold price rebounded slightly to $3,342.
However, the tariff intensity is mild (only slightly above 10%), and the risk aversion sentiment is limited, which is difficult to change the weakness of gold.
The strong suppression of the US dollar
The US CPI in June hit the largest increase since January, pushing the US dollar index to 98.70 (a three-week high), and the US Treasury yield rose simultaneously.
As an interest-free asset, gold is sensitive to a high interest rate environment and is under obvious pressure in the short term.
Market sentiment is neutral and bearish
Although tariff uncertainty provides support, the technical strengthening of the US dollar + the cooling of the Fed's interest rate cut expectations have made gold weak.
Daily level: Long-term attack, shorts accumulate strength
Structure: Continuous high-level fluctuations, multiple tests of the 3375-3380 resistance failed, and the daily line closed with a large upper shadow, confirming the selling pressure.
Moving average: Although the 55-day moving average (3222) has not been broken, the short-term moving average (5-day, 10-day) crosses downward, suggesting a risk of a correction.
Key position:
Resistance: 3365 (previous high conversion position) → strong resistance 3380 (trend line suppression)
Support: 3320 (yesterday's low) → break to see the psychological barrier of 3300
4-hour level: oscillate downward, rebound to short
Form: 3375 double tops fall back, the current middle track (3350) turns into dynamic resistance, MACD crosses below the zero axis.
Operation logic:
Aggressive short: enter the 3355-3365 area, stop loss 3380, target 3320→3300.
Conservative short: wait for the rebound to around 3360 to show a stagflation signal before intervening.
Direction preference:
Bearish! Gold failed to attack several times. The strong dollar + technical breakout signal, if 3380 is not broken, the bears will dominate.
Entry and risk control:
Current price 3342: If the European session rebounds to 3355-3365, open shorts in batches, stop loss 3385, target 3320→3300.
Unexpected breakthrough of 3380: Manual stop loss, wait and see whether it is a false breakthrough.
Key reminder:
Pay attention to US retail sales data in the evening. If the dollar rises again, gold may accelerate its decline.
If the 3300 mark is broken, it will open up space to 3280 (200-day moving average).
Gold is trapped in the shackles of "strong dollar + weak safe-haven", and the technical rebound is weak. It insists on high altitude below 3380. Short-term volatility intensifies, but the trend is bearish. Be patient and wait for sniping opportunities after the rebound is weak!
Could we see the WTI oil bears getting pleased any time soon?The technical picture of MARKETSCOM:OIL is showing a possible bearish flag formation, which may lead WTI oil to some lower areas. Is that the case? Let's dig in.
NYMEX:CL1!
Let us know what you think in the comments below.
Thank you.
75.2% of retail investor accounts lose money when trading CFDs with this provider. You should consider whether you understand how CFDs work and whether you can afford to take the high risk of losing your money. Past performance is not necessarily indicative of future results. The value of investments may fall as well as rise and the investor may not get back the amount initially invested. This content is not intended for nor applicable to residents of the UK. Cryptocurrency CFDs and spread bets are restricted in the UK for all retail clients.

Excellent Profits / quick updateAs discussed throughout my yesterday's session commentary: "My position: My strategy remains the same, Buying every dip on Gold on my calculated key entry points which Gold respects and ultimately, anticipating #3,377.80 Resistance break-out to the upside."
I have broken my personal record throughout yesterday's session (#200.000 EUR Profit) using #25 and #50 Lots, Buying Gold with set of Scalp orders within #3,340's, #3,330's and final #3,327.80 reversal zone. I will not make any more moves today, will call it for the session and await tomorrow's E.U. session Highly satisfied with Profit. Needless to mention, #3,377.80 and #3,400.80 mark remains my Medium-term Target zones as I continue Buying every local Low's for us.
