Possible target ~$1800Platinum is breaking out on weekly and daily time scale our of ascending triangle and channels with big volumes.
multiyear breakout possible with high certainty as geopolitical situation will change the things for long as low trust environment (which is not new) but now with attack on Iran, and Ukrain Russian prolonged war and support to Ukraine by many big countries will change the relation for long, specially high tech items, metals and minerals.
Target based on rounding bottom pattern for multiyear breakout. In future it can surpass gold given its ornamental value and almost zero metal loss due to scratching over time.
Futures market

Is this the end of the bears of XAUUSD?2 weeks in a row, the sellers were in control. The downward force this week is strong. The possibility of a further drop in the future is highly probable. However, there's also a potential recovery next week. Overall, it's still an uptrend; however, I won't ignore the new LH that formed this week as well.

Trading Game of the Day 27-JUNE-2025Trading Plan:-
1-bias:-bearish
2-CISD
3-the price move from H2-FVG to the LOW(low of the week)
4-At the H2-FVG ,the price change its direction and make (CISD) with FVG-15M
5-Then the price move short for long term
Thank you

Soybeans Crashing Into Demand — Reversal Coming or Trap?1. COT REPORT — Updated June 17, 2025
📌 Non-Commercials (Speculators)
Long: +5,661 → 195,984
Short: -9,226 → 110,761
✅ Net Long Increase: A clear bullish shift in speculative positioning (+14,887 net contracts). This is an early indication of a sentiment reversal.
📌 Commercials (Hedgers / Producers)
Long: +6,023
Short: -5,806
➡️ The decrease in net shorts suggests improving confidence among institutional players.
📌 Total Open Interest: 846,169 (down by 12,776)
❗ This slight drop may be linked to position rotation or partial profit-taking.
2. NET POSITIONS CHART INSIGHT
Commercial traders remain structurally net short, but their exposure has been gradually declining since March.
Non-commercial traders have increased their net long positions since April, aligned with the price's technical recovery.
The current price is trading near the historical mean, indicating neutral conditions with potential room for further upside.
🕰️ 3. SEASONALITY OUTLOOK
The June–July period has historically been bearish:
June Average Performance:
Last 5 years: -39.61
Last 2 years: -38.71
July Average Performance:
Last 20 years: -44.82
Last 2 years: -34.73
📉 August and September typically continue this seasonal downtrend.
🟨 Caution is advised on initiating long positions during this phase.
📊 4. TECHNICAL OUTLOOK —
Current Structure:
Rising channel has broken to the downside with a strong bearish impulse candle.
RSI is neutral but previously showed bearish divergence.
Key Support Zones:
1035–1025: Intermediate support area already tested.
1012–994: Golden Pocket aligned with a demand block — likely target zone with high potential for reaction.
Possible Scenarios:
🔴 Bearish Continuation: A retracement followed by a move down into the 994–1000 range, where a tactical long setup may emerge.
🔵 Bull Trap and Reversal: A rapid recovery above 1050, potentially triggering a continuation to 1080 (range top).
5. EXECUTION SUMMARY
Primary Bias: Bearish in the short term
🎯 Target Zone: 994–1000
🛑 Invalidation Level: Weekly close above 1055
Tactical Long Setup: Monitor price action at 994–1000 for bullish reaction.
Macro context and speculative positioning suggest a structural bottom may develop in Q3 2025, but current conditions are not yet favorable for a full swing position.

Gold Top Down Analysis end of June 2025Welcome to my Top Down Analysis. My short trade has not yet reached TP but I explain in the video how the next few weeks might go.
My sell entry : 3443
My TP : 3214

Gold Continues to Fall Below $3,300As the week comes to a close, gold is on track for a decline of more than 1.5% during the latest trading session. So far, the bearish bias remains firmly in place in the movements of the precious metal, as demand for safe-haven assets continues to fade, mainly due to the ceasefire agreement in the Middle East conflict, which has helped restore market confidence. Since gold is a classic safe-haven asset, demand has steadily weakened in recent sessions, and as long as this situation holds, selling pressure on gold may continue to intensify.
Uptrend Breaks:
Recent selling activity has played a crucial role, as it has led to a bearish breakout below the short-term trendline, which had been consistently holding on the chart. This breakdown has now opened the door for a lateral channel to form, suggesting that market sentiment has entered a more neutral zone in the short term. If bearish pressure continues, it could pave the way for a more dominant downtrend to take shape in the sessions ahead.
Indicators:
RSI: The RSI line has started oscillating steadily below the 50 level, signaling that downward momentum is beginning to dominate. If the line continues to move away from the neutral 50 level, we could expect more consistent bearish pressure on the chart.
MACD: A similar setup is emerging on the MACD. The indicator's histogram has dropped below the neutral line at zero and is showing persistent negative readings. This signals that selling momentum remains dominant, based on the average strength of the moving averages. If this continues, it would confirm a clear bearish bias.
Key Levels to Watch:
$3,300 – Current barrier: This level aligns with the midpoint of the short-term lateral channel. Price action around this area could reinforce the neutral outlook in the near term.
$3,400 – Key resistance zone: This level marks the historical highs of the gold market. A return to this level would revive the recently abandoned bullish trend and could reestablish a more optimistic outlook.
$3,200 – Critical support: This marks the lower boundary of the short-term channel. A breakdown below this level could trigger a fresh selling trend in the coming sessions.
Written by Julian Pineda, CFA – Market Analyst

Trade Setup - XAUUSD (Gold)Timeframe: 30 Minutes
Trade Type: Short (Sell)
📉 Entry: 3275
🎯 Target: 3220
🛑 Stop Loss: 3311
📊 Technical outlook suggests potential downside pressure below the 3275 level, with RSI and price action signaling weakness.
📌 Risk management is key – always trade with proper stop loss.
⚠️ Disclaimer: This is not financial advice. Trading involves significant risk and may not be suitable for all investors. Always conduct your own analysis or consult with a financial advisor before making trading decisions.

It’s the right time to make a golden layout!Gold opened at 3328 today and started the downward mode. After the European session, it continued to fall and broke the new low. The negative opening data of the US session also continued the downward mode. So far, it has reached the lowest point of 3255 and rebounded, but the strength is not very strong. After all, the upper pressure is still very strong. In the short term, we pay attention to the previous low point of 3295-3300, and focus on the upper 3305-3311. Today, the short-term operation of gold is mainly short-selling on rebounds, and long-selling on callbacks is supplemented.
From the 4-hour analysis, the upper short-term resistance is around 3295-3300, with focus on the important suppression at 3305-3311. The rebound will continue to be mainly short and look to fall back. The lower short-term support is around 3255-3245. Relying on this range as a whole, the main tone of high-altitude and low-multiple participation remains unchanged.
Gold operation strategy:
1. Short-selling in batches near the rebound of gold near 3295-3310, with a target of 3380-3370.
2. When gold falls back to around 3345-3455, go long in batches, with the target at 3370-3380.

Analysis and strategy of the latest gold trend on June 27:
Core logic of the current market
Gold has recently shown the characteristics of oscillating bottoming out. The daily level forms a key support near 3295. If it holds this position, it may start a rebound; on the contrary, if it falls below, it may continue the downward trend. The focus of the short-term long and short competition is concentrated in the 3340-3355 area, and the breakthrough direction will determine the trend of the next stage.
Analysis of key technical signals
1. Daily level: bottoming out and rebounding, bulls are accumulating momentum
Form: The previous day bottomed out and closed positive, and the rebound continued yesterday, indicating that the 3295 support is effective and the short-term short momentum is weakened.
Key pressure: 3355 (Bollinger middle track), it is expected to test 3385 after breaking through.
Key support: 3295 (recent low), breaking below will open up downside space.
2. 4-hour level: Golden cross is bullish, but BOLL suppression has not been broken
The stochastic indicator (KD) is golden cross, short-term bullish, but the price is still subject to the pressure of 3345-3347 (BOLL middle track).
The MACD momentum column is shrinking, indicating that long and short positions are still competing, and it is necessary to observe whether it can stand above 3340.
3. 1-hour level: Moving average dead cross, short-term still has the risk of callback
The short-term moving average (5/10EMA) dead cross indicates that there is still selling pressure in the short term. If it cannot break through 3340, it may fall back to the support of 3312-3315.
Key watershed: 3340 (1-hour trend suppression), if it breaks through, the short-term will turn strong.
Today's operation strategy (key range trading)
1. Short order strategy (short under pressure near 3340)
Entry point: 3340-3345 (1-hour pressure + 4-hour BOLL middle track)
Stop loss: above 3355 (short order invalid if it breaks through)
Target: 3320-3315 (previous low support area)
Logic: Before effectively breaking through 3340, short-term high-short order can still bet on callback.
2. Long order strategy (stable long near 3315)
Entry point: 3312-3315 (yesterday's low support)
Stop loss: below 3307 (to prevent false break)
Target: 3330-3340 (reduce position in pressure area)
Logic: If the retracement does not break the support, you can bet on a rebound at a low price.
3. Breakout strategy (turn to long after stabilizing 3355)
Confirmation signal: 1-hour closing stabilizes at 3355
Target: 3385 (daily resistance)
Logic: The trend becomes stronger after the breakthrough, and you can follow the trend.
Key risk reminder
Dollar trend: If the US dollar rebounds sharply, it may suppress the rebound space of gold.
Market sentiment: Rising risk aversion (such as geopolitical conflicts) may promote gold breakthroughs.
Fed policy expectations: If the recent speeches of officials are hawkish, it may limit the rise of gold.
Summary: Sell high and buy low, wait for a breakthrough
Oscillating range: 3315-3340, you can sell high and buy low.
Breakthrough direction: If it stabilizes at 3355, it will be bullish to 3385; if it falls below 3295, the trend will turn bearish.
Trading discipline: Strictly stop loss and avoid carrying orders.

Fatty Platty PattyPlatinum
Is it time, Sir?
bodl and hodl thx
Look, Sir, chart description must be satisfying some certain minimum character limit. Therefore I tell you, buy Sir, buy. Based on this one descending line, Sir. We are in breakout mode, Sir, with confluence of averages most beautiful, Sir. The time for acquiring shiney metal is coming, Sir. This is not financial advice, Sir.

GOLD SETUP HIT TPyesterday i shared this setup on gold i entered my trades on the touch of the order block as a smart money trader i just used a simple smart money concept to kill this trade

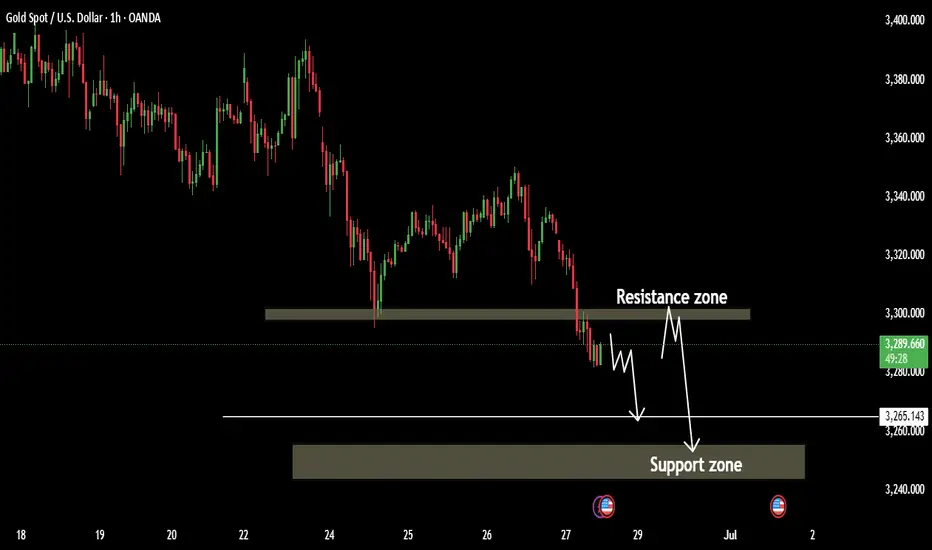
XAUUSD/GOLD/SellThe pressure from the bears is too great. In the end, the pressure from above was not broken. Instead, it broke out and fell after being under pressure. The stop loss was hit.
The current price is 3285. After gradually boosting the US dollar index. The trend of gold prices has continued to fall. More importantly, the tariff issue has been eased. At the same time, geopolitical factors are also orderly and stable. This is the news that caused the bears to attack.
History has not become the savior because of repeating itself. Of course, this is also an emergency. In some transactions, the extremely low probability of causing losses is a common problem in transactions. However, our analysis team has stabilized a high trading win rate.
Then the next trading plan is still to focus on the pressure from above. If the London market rebounds above 3300. It is still mainly selling. 3314 is an important level for short-term rebound, and we need to pay attention. Although there is no obvious sign of rebound yet, the release of short-selling pressure has been alleviated because the decline is slow. Today's main trading idea is still to sell at high levels.
The target is to focus on the position of 3264-3248. Remember the risk of buying at low levels. Do not trade independently.
CHECK XAUUSD SIGNAL READ CAPTAINbuy Setup)
Entry Zone: Around 3274.000 \3272.000
Stop Loss: 3264.000
Take Profits:
TP1: ~3280.000
TP2: ~3290.000
Final Target: 3300.000

Xauusd Going Towards BuyDespite rising selling pressure on the dollar and mixed US PCE numbers, Gold prices fell further on Thursday, reaching new four-week lows around $3,260 per troy ounce. Collaborating with the decline, recent improvements in the Israel-Iran conflict continue to fuel investor withdrawals from the safe haven region.

XAUUSD Long Setup – Watching 3247 Entry ZoneHi Traders,
The recent price action of XAUUSD has been a bit complex, but I hope this idea turns out to be profitable for everyone.
Feel free to share your thoughts if you see anything differently.
What I find most interesting is the entry zone around 3247–3245 . If we take the wave count starting from May 15, 2025 (3120.76) and consider wave 5 to be completed on June 15, 2025 (3451.52), then wave 2 should ideally retrace to around 3247.
On top of that, wave C of wave 2 seems to follow a clean 1–2–3–4–5 structure. If we treat the current move as a downtrend, wave 5 would likely complete right at 3247, which I find both accurate and technically compelling.
I'll be watching 3247 closely and plan to go long from there.


# USOIL - $40 Move? Something Major is coming?Date: 25-06-2025
#USOIL Current Price: $65.45
Pivot Point: 70.57 Support: 63.71 Resistance: 77.49
#USOIL Upside Targets:
Target 1: 87.10
Target 2: 96.71
Target 3: 106.51
Target 4: 116.31
#USOIL Downside Targets:
Target 1: 54.07
Target 2: 44.43
Target 3: 34.62
Target 4: 24.82

GOLD Expected Bearish TrendXAUUSD Gold Bearish Trend Outlook
Gold remains in a bearish trend, with technical weakness confirmed as support was tested on Friday. The metal continues to trade under pressure, driven by investor caution ahead of the upcoming U.S. Core PCE Index — a key inflation gauge.
If the data comes in higher than expected, it could delay Federal Reserve rate cut expectations, further weighing on gold prices. However, if the Core PCE data disappoints to the downside, rate cut hopes in July may resurface, providing a potential support base for gold.
Key Levels to Watch:
Immediate Support: 3365
Major Support Zone: 3350
Resistance: 3295 / 3305
Keep Eye on all data share your idea about this analysis we need support from you Guys.
XAUUSD STOP HUNT PROOFa proven risk management psychology......i knew whats on the way ....price must go down .....i need friends ...lets connect and scale up to the moon

Market next move 🔍 Disruptive Analysis of the Original Chart
1. Labeling Conflict: "Bullish" with Bearish Arrow
Disruption: The term "Bullish" is written, yet the arrow clearly shows a downward movement. This is contradictory.
Challenge: A downward movement typically suggests bearish sentiment. Either the label is incorrect, or the directional analysis is flawed.
2. Support/Resistance Confusion
Disruption:
The chart shows "Support" at around 36.15 but labels the zone below it as "Target" and "Resistance", which is illogical.
Resistance should be above the current price; support below.
Challenge: It appears that the analyst has inverted the traditional roles of support and resistance.
3. Unclear Volume Interpretation
Disruption: The volume at the bottom is not analyzed or discussed. Yet volume spikes correlate with high selling pressure near resistance.
Challenge: Without volume context, predicting price movement is speculative.

GOLD Core PCE Price Index (month-over-month): rose by 0.2%, above the forecast of 0.1% and the previous 0.1% reading. This indicates a slight acceleration in the Federal Reserve’s preferred inflation gauge, with the annual core PCE inflation rising to about 2.7% year-over-year, above expectations of 2.6%.
Personal Income (month-over-month): declined by 0.4%, worse than the forecasted 0.3% increase and down from the previous 0.8% rise. This drop suggests a weakening in household income growth.
Market and Policy Implications:
The uptick in core PCE inflation signals that underlying price pressures remain somewhat persistent, complicating the Fed’s path toward its 2% inflation target.
The decline in personal income could weigh on consumer spending going forward, potentially slowing economic growth.
The US Dollar Index reacted by edging lower, reflecting market caution amid mixed inflation and income data.
Fed officials, including Chair Powell, have emphasized a cautious approach, suggesting no immediate rate cuts until inflation dynamics become clearer.
Summary:
Core inflation is ticking up slightly, reinforcing inflation concerns, while personal income weakness points to potential softening in consumer demand. This mixed data supports a Fed stance of patience, with markets pricing in a moderate chance of rate cuts later in 2025 but expecting continued vigilance..
China Hong Kong gold vault hints at a geopolitical shift, as the Shanghai Gold Exchange's expansion, aims to enhance China's gold trading infrastructure and challenge Western dominance, potentially impacting demand and supply of physical gold need.
#GOLD

XAUUSD Bearish Setup | Support Levels in SightGold has broken down from the ascending channel, indicating a potential shift in market structure toward bearish momentum.
🔎 Technical Highlights:
Clear breakdown from the ascending channel
Price currently facing resistance near $3,323
Two key support zones:
🟩 First Support: $3,295 – potential bounce area
🟩 Second Support: $3,258 – deeper downside target
📊 Short-Term Outlook: Expecting a minor pullback before continuation lower toward the $3,295 support. If that level fails to hold, the next target becomes $3,258.
💡 Trade Idea: Watch for rejection below $3,323 for a possible short opportunity targeting $3,295 and $3,258. Keep an eye on momentum and volume.
🔔 Note: Always use proper risk management. This setup is based on current price action and may change with market dynamics.

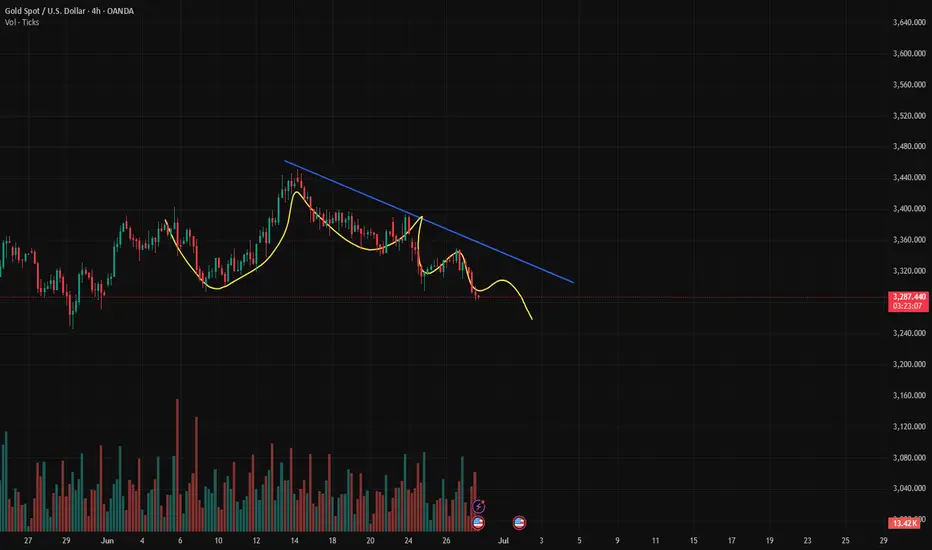
XAUUSD Long Trendline is broken. Mid Term Swing TradeXAUUSD, Long term trendline is now broken. Price should come up to that level to continue it's downward move.
* It's entirely my prediction with some logical reason but I will request everyone to see this as a reference, Thank you
