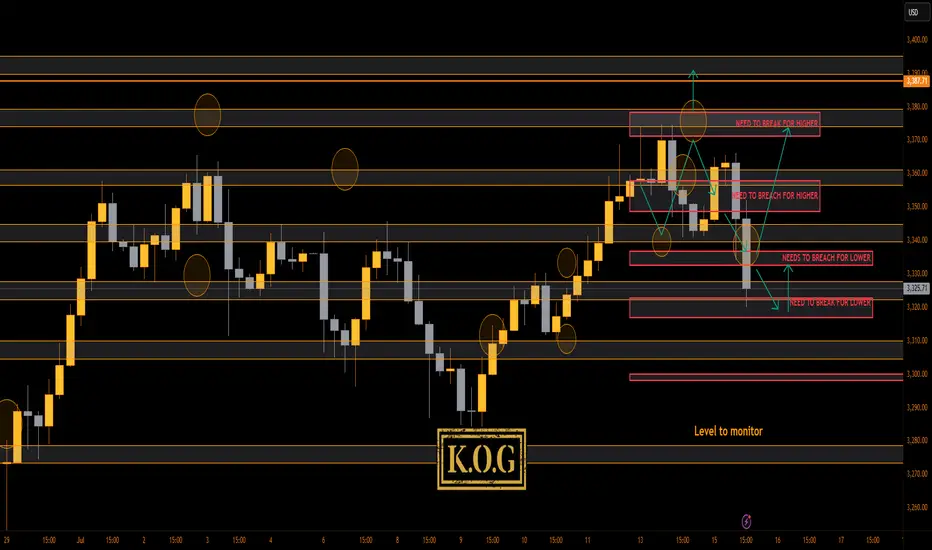
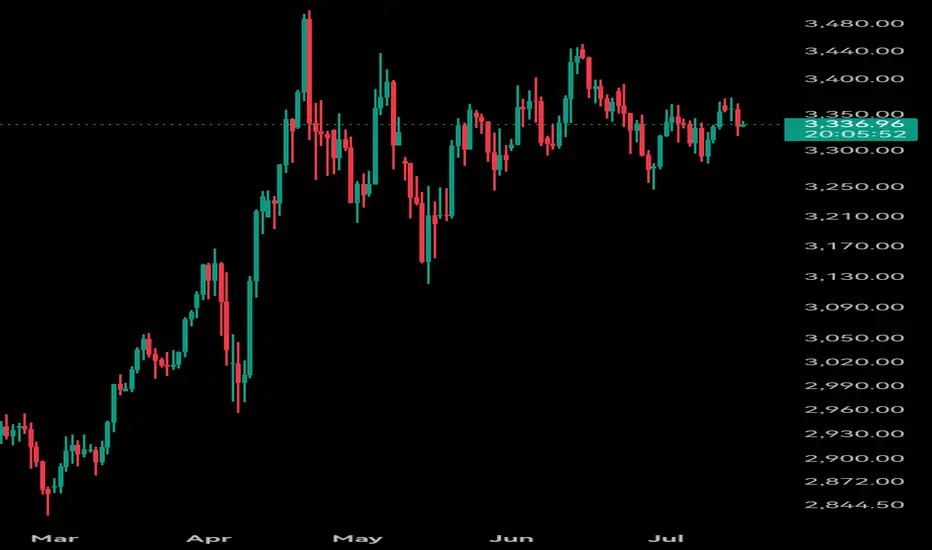
THE KOG REPORT - UpdateEnd of day update from us here at KOG:
Madness on the markets. I can honestly say, if you're less experienced in these markets, and like some of you trading with large lots and large or no SL's, you're unfortunately going to get yourself into a little bit of a pickle.
Did it go to plan today? Yes, and no! We followed the path which worked, but then we wanted support to hold at the bias level 3340 to then push us back upside. We got a small bounce for 100pips on the red box indicators but ideally we wanted this to completed the move up before coming back down. We're now at crucial support 3320 with resistance at the 3335-40 region, which, if we hold here without breaching should be a decent retracement on this move.
Other than that, I can say our plan for today wasn't as we hoped, we took an SL but then got a 100pip bounce. It is what it is
RED BOXES:
Break above 3365 for 3372, 3375, 3388 and 3406 in extension of the move
Break below 3350 for 3335✅, 3330✅, 3326✅ and 3307 in extension of the move
As always, trade safe.
KOG
Futures market
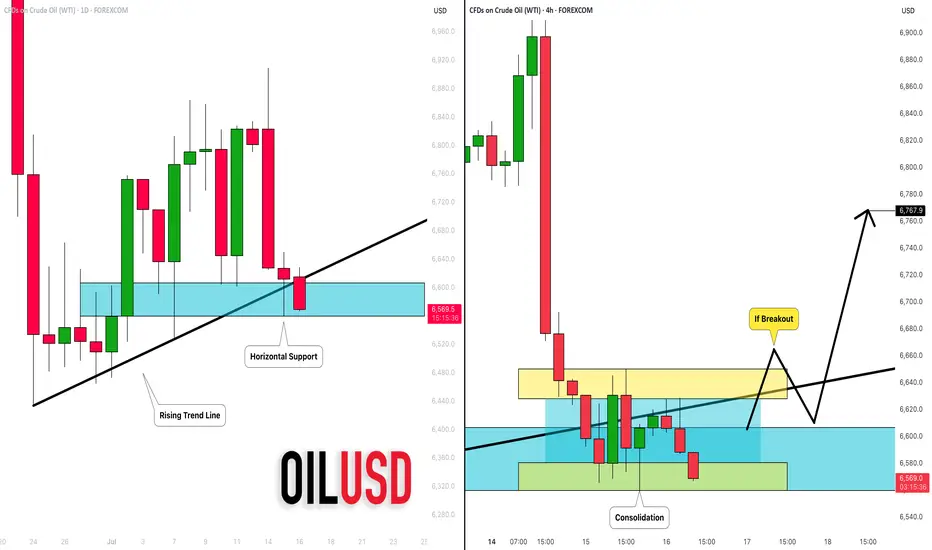
CRUDE OIL (WTI): Your Trading Plan Explained
Do not forget that today we expect Crude Oil Inventories data
release - it will be 10:30 am NY time.
Ahead of this news, the market is testing a significant daily support cluster
that is based on a rising trend line and a horizontal structure.
You signal to buy will be a bullish breakout of a minor intraday
horizontal resistance on a 4H.
4H candle close above 66,5 will be your confirmation.
A bullish continuation will be expected to 67.6 then.
I suggest waiting for the news release first and then check how
the market prices in the news. If our technicals align with fundamentals,
it will provide an accurate setup.
Alternatively, a bearish violation of a blue support will push the prices lower.
❤️Please, support my work with like, thank you!❤️
Gold is Moving Sideways – A Potential Triangle Formation?Gold is currently trading in a sideways pattern, potentially forming a triangle consolidation. This type of setup often precedes a strong breakout. At the moment, price action is showing hesitation near key resistance. Traders should wait for a confirmed breakout above the upper boundary of the triangle to validate a bullish continuation.
Patience is key—wait for the breakout before taking action.

GOLDReached static resistance📉
If it breaks above it can be bought on pullback🕯
If it falls below the resistance, it can be confirmed to sell🔽
GOLD Intraday Chart Update For 16 July 2025Hello Traders,
Today we have major news is US PPI, currently market is in tight range between 3360 to 3310
all eyes on 3360 level breakout for the day for further upward continuation
Only break below 3315 market will goes further downside
Currently we also have Bearish channel in H2 TF
Disclaimer: Forex is Risky
Breakout Theory ⭐️Daily St Buy - Trending - Focus St Buy H1
⭐️H1 St Buy - Trending - Focus St Buy m15
⭐️M15 St Buy - Trending - Focus St Buy m1

check the trendIt is expected that a trend change will form within the current support area and we will witness the beginning of the upward trend.
If the price breaks through the support zone, the continuation of the correction is likely.
If the price breaks through the support levels, the continuation of the downtrend is likely.

Gold XAU/USD Analysis for July 15, 2025: Trading Strategy and KeThe market is showing a strong upward trend, as indicated by the yellow trendline.
Fibonacci Retracement Levels:
38.2% Fibonacci Level: 3,344.79
50% Fibonacci Level: 3,344.47
61.8% Fibonacci Level: 3,347.91
Resistance Zone: The price is approaching a strong resistance level at 3,370 USD.
Technical Observations:
Gold is currently moving upward but is encountering resistance at 3,361. The price tested the 61.8% Fibonacci level and is now facing some resistance.
The Fibonacci levels suggest that if the price breaks above 3,362, the next target could be 3,370 USD.
Support Zone: If the price retraces, support may emerge near the 3,340 region.
Gold XAU/USD Trading Strategy:
Bullish Scenario:
If the price breaks above resistance at 3,362, the next target would be the 3,370 level. This could be a signal to enter Long positions near the 3,344 to 3,348 range, with a target around 3,370.
Bearish Scenario:
A retracement to the support level at 3,340 is possible. If the price drops below 3,340, further downside could be expected. In this case, a Short position could be considered if the price falls below 3,340, with a target near 3,330.
With the current upward trend, gold XAU/USD may continue to rise if it breaks the 3,362 resistance level, with the next target being 3,370 USD. However, if the price turns lower and drops below the 3,340 support level, the market may continue to decline.
Note: Be sure to monitor the Fibonacci levels and price behavior closely to adjust your trading strategy accordingly for today. If this analysis was helpful, don't forget to save it and follow for more trading strategies!

XAUUSD – Fresh Demand Zone After SweepHello Traders 👋
Today in XAUUSD, we've identified a newly formed fresh demand zone on the lower timeframes, which was created after a liquidity sweep of the sell-side lows (SSL) within the daily demand zone.
This move suggests that smart money may have engineered a stop hunt to accumulate long positions at a discount price, setting the stage for a potential bullish reversal or continuation from this area.

Here is a bearish analysis of the gold market, based onHere is a bearish analysis of the gold market, based on current market dynamics and potential risk factors:
### 1. **Short-Term Technical Pressure**
- **Key Resistance Level Suppression**: Gold recently faced strong resistance near **$3,374**, with the **0.618 Fibonacci retracement** level on the daily chart acting as a barrier. A failure to break above this level could trigger a pullback.
- **Overbought Signal**: The **RSI (14-day)** is approaching **70**, indicating overbought conditions. While the **MACD** has formed a golden cross, momentum appears weak, suggesting a potential short-term correction.
- **Double-Top Pattern Risk**: If gold fails to sustain above **$3,374**, a **double-top pattern** could form, leading to a further decline toward the **$3,356** support level.
### 2. **Fed Policy Expectations in Flux**
- **Rate Cut Expectations Priced In**: Markets have already priced in a **90%+ probability of a September Fed rate cut**. If upcoming economic data (e.g., CPI, jobs reports) surprise to the upside, these expectations could diminish, putting downward pressure on gold.
- **Sticky Inflation Risk**: If **June CPI** exceeds expectations (market consensus: **3.1% YoY**), real interest rates could rise, increasing the opportunity cost of holding gold.
### 3. **Declining Safe-Haven Demand**
- **Tariff Policy Fatigue**: Market reactions to **Trump’s tariff policies** have weakened. Any progress in **US-China or EU trade talks** could further reduce safe-haven demand.
- **Geopolitical De-escalation**: Signs of **Russia-Ukraine peace talks** or easing **Middle East tensions** may reduce gold’s appeal as a hedge.
### 4. **Institutional Bearish Sentiment**
- **Citi Warns of a Gold Peak**: Citi analysts suggest gold may trade in a **$3,100–$3,500 range in H2 2025**, but a deeper correction could occur in **2026** if global economic concerns ease and household gold holdings remain elevated.
- **High Household Holdings Risk**: Global household gold allocations are at **50-year highs** (e.g., **15–18% in India**), potentially limiting future buying power and acting as a downside catalyst.
### 5. **Stronger Dollar & Rising Treasury Yields**
- **Dollar Strength**: If the **Fed delays rate cuts** or US economic data outperforms, the **USD could rebound**, weighing on dollar-denominated gold.
- **Higher Bond Yields**: A rise in the **10-year Treasury yield above 4.5%** would increase gold’s opportunity cost, making it less attractive.
### **Potential Downside Targets**
- **Short-Term Support**: **$3,260** (key psychological level). A break below could test **$3,225** or even **$3,200**.
- **Medium-Term Correction Risk**: If risk appetite improves, gold may enter a deeper pullback toward **$3,000–$3,100**.
### **Conclusion**
While gold’s long-term outlook remains supported by **central bank buying and de-dollarization trends**, short-term risks include **overbought conditions, shifting Fed expectations, and fading safe-haven demand**. Traders should monitor **key data (CPI, NFP) and Fed signals**—a break below **$3,260** could confirm a bearish trend.
Gold continues to declineAccording to yesterday's analysis, the price of gold fell, and now we expect this upward correction to be a path for a further decline in the price of gold.

Gold continues to declineAccording to yesterday's analysis, the price of gold fell, and now we expect this upward correction to be a path for a further decline in the price of gold.

Gold Price Analysis Bullish Continuation PossibleBullish Trend Formation: We see a series of higher highs and higher lows forming on the chart, suggesting a potential continuation of the bullish trend. However, the market has recently pulled back from the previous peak at 3,340.69, which is now being tested as support.
Fibonacci Retracement Analysis:
The current pullback has reached the 0.5 level around 3,334.32, a strong support zone. This area could offer a potential long entry if the price reacts positively from here.
The 0.618 Fibonacci level at 3,335.82 is also significant, often acting as a final retracement level before the market continues its bullish move.
Support Testing: If the price holds above the 0.618 level, we could expect a price rally towards the resistance at 3,372.00, with possible extension above it.
Trend Continuation: If the price breaks below 3,335.82, consider watching for further downside potential with the next target being the 0.5 level, near 3,334.32.
Trade Strategy (Buy on Support):
Entry: Around 3,334.32 or 3,335.82 (depending on price action confirmation).
Target: 3,340.69 (next resistance zone).
Stop-Loss: Set just below the 0.5 Fibonacci level around 3,327.95 to manage risk effectively.
The current chart is showing a potential for a bullish continuation, with key support levels at 3,335.82 and 3,334.32, backed by Fibonacci retracement. Watching the price action around these levels will be crucial for entering a potential buy position.
Remember to adjust your strategy based on the actual market movements and confirm the trend with price action before making a trade.

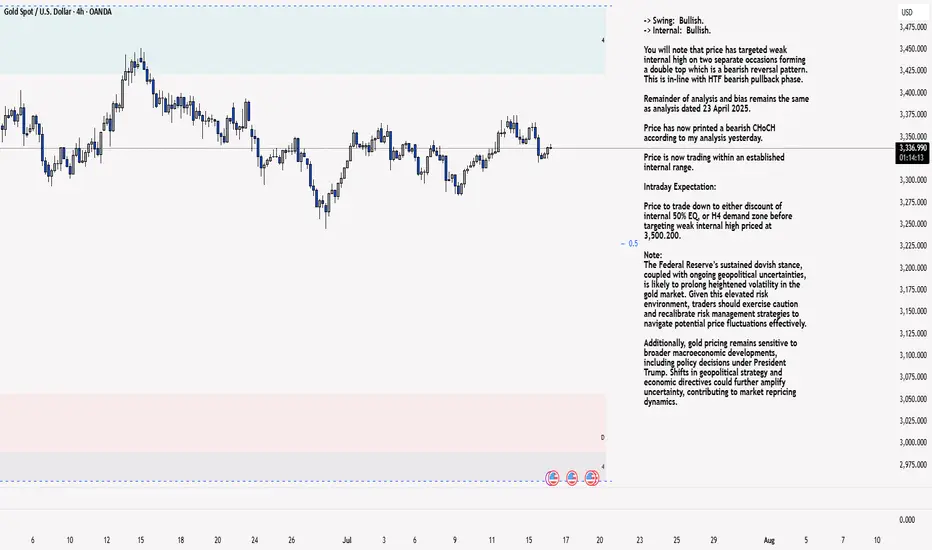
XAU/USD 16 July 2025 Intraday AnalysisH4 Analysis:
-> Swing: Bullish.
-> Internal: Bullish.
You will note that price has targeted weak internal high on two separate occasions forming a double top which is a bearish reversal pattern. This is in-line with HTF bearish pullback phase.
Remainder of analysis and bias remains the same as analysis dated 23 April 2025.
Price has now printed a bearish CHoCH according to my analysis yesterday.
Price is now trading within an established internal range.
Intraday Expectation:
Price to trade down to either discount of internal 50% EQ, or H4 demand zone before targeting weak internal high priced at 3,500.200.
Note:
The Federal Reserve’s sustained dovish stance, coupled with ongoing geopolitical uncertainties, is likely to prolong heightened volatility in the gold market. Given this elevated risk environment, traders should exercise caution and recalibrate risk management strategies to navigate potential price fluctuations effectively.
Additionally, gold pricing remains sensitive to broader macroeconomic developments, including policy decisions under President Trump. Shifts in geopolitical strategy and economic directives could further amplify uncertainty, contributing to market repricing dynamics.
H4 Chart:
M15 Analysis:
-> Swing: Bullish.
-> Internal: Bullish.
H4 Timeframe - Price has failed to target weak internal high, therefore, it would not be unrealistic if price printed a bearish iBOS.
The remainder of my analysis shall remain the same as analysis dated 13 June 2025, apart from target price.
As per my analysis dated 22 May 2025 whereby I mentioned price can be seen to be reacting at discount of 50% EQ on H4 timeframe, therefore, it is a viable alternative that price could potentially print a bullish iBOS on M15 timeframe despite internal structure being bearish.
Price has printed a bullish iBOS followed by a bearish CHoCH, which indicates, but does not confirm, bearish pullback phase initiation. I will however continue to monitor, with respect to depth of pullback.
Intraday Expectation:
Price to continue bearish, react at either M15 supply zone, or discount of 50% internal EQ before targeting weak internal high priced at 3,451.375.
Note:
Gold remains highly volatile amid the Federal Reserve's continued dovish stance, persistent and escalating geopolitical uncertainties. Traders should implement robust risk management strategies and remain vigilant, as price swings may become more pronounced in this elevated volatility environment.
Additionally, President Trump’s recent tariff announcements are expected to further amplify market turbulence, potentially triggering sharp price fluctuations and whipsaws.
M15 Chart:
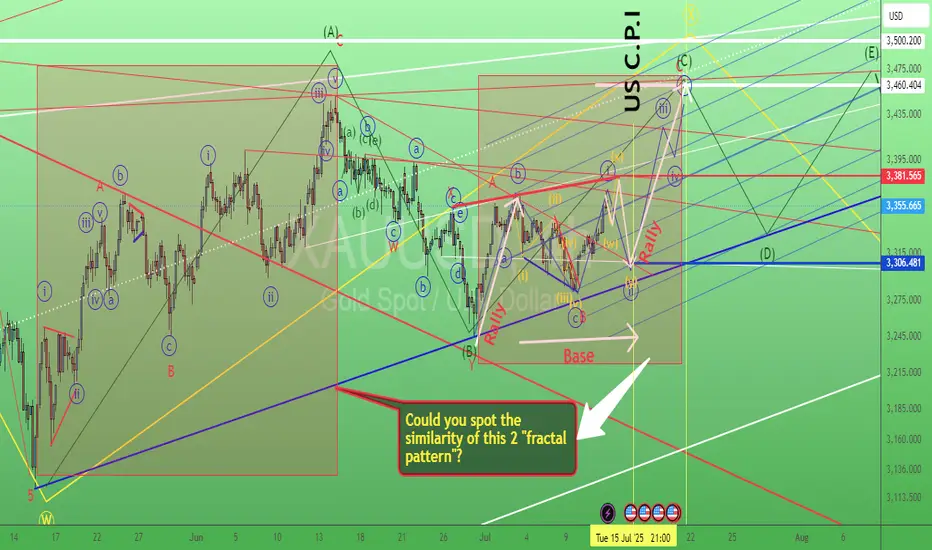
Gold swing trade setup 13/July/25XAUUSD. Based on the latest "speed" development of chart instead of forming a triangle pattern gold probably building a "flat" "Base" before rallying toward 3460 +/- Coming Tuesday US CPI could be the "trigger" for launching the rocket..
Head and Shoulders always at the end Hello Traders,
as we saw last month was big moves with the war happening and at the end was all drama and market makers loaded with profits and its time to take and enjoy the profits we reached to the o.6 from the the large move and now is the continuation its a perfect entry to the second wave same like the prev one targets as shown and good luck its just my opinion the catalyst is the tariff on Russian allies

Learn 2 Essential Elements of Forex Gold Trading
In the today's post, we will discuss how Forex Gold trading is structured, and I will share with you its 2 key milestones.
Trading with its nuances and complexities can be explained as the interconnections of two processes: trading rules creation and trading rules following.
1️⃣ With the trading rules, you define what you will trade and how exactly, classifying your entry and exist conditions, risk and trade management rules. Such a set of consistent trading rules compose a trading strategy.
For example, you can have a following trading plan:
you trade only gold, you analyze the market with technical analysis,
you buy from a key support and sell from a key resistance on a daily, your entry confirmation is a formation of a reversal candlestick pattern.
You set stop loss above the high/low of the pattern, and your target is the closest support/resistance level.
Here is how the trading setup would look like.
In the charts above, all the conditions for the trade are met, and the market nicely reached the take profit.
2️⃣ Trading strategy development is a very simple process. You can find hundreds of different ones on the internet and start using one immediately.
The main obstacle comes, however, with Following Trading Rules.
Following the rules is our second key milestone. It defines your ability to stay disciplined and to stick to your trading plan.
It implies the control of emotions, patience and avoidance of rationalization.
Once you open a trade, following your rules, challenges are just beginning. Imagine how happy you would feel yourself, seeing how nicely gold is moving to your target after position opening.
And how your mood would change, once the price quickly returns to your entry.
Watching how your profits evaporate and how the initially winning position turns into a losing one, emotions will constantly intervene.
In such situations, many traders break their rules , they start adjusting tp or stop loss or just close the trading, not being able to keep holding.
The ability to follow your system is a very hard skill to acquire. It requires many years of practicing. So if you believe that a good trading strategy is what you need to make money, please, realize the fact that even the best trading strategy in the world will lose without consistency and discipline.
❤️Please, support my work with like, thank you!❤️
I am part of Trade Nation's Influencer program and receive a monthly fee for using their TradingView charts in my analysis.
XAU / USD 1 Hour ChartHello traders. Happy Wednesday. Taking a quick look at the hourly chart, as per my last analysis, we did move down, a bit lower than i expected, and then pushed back up. Saying that, I have marked my current area to watch for the retest to push up some more, or do we move back down to retest the support area. Patience is key, and I can see both scalp buys and sell trade set ups. Big G gets my thanks. Let's see how things play out with the current 4 hour and 1 hour candles. Be well and trade the trend.


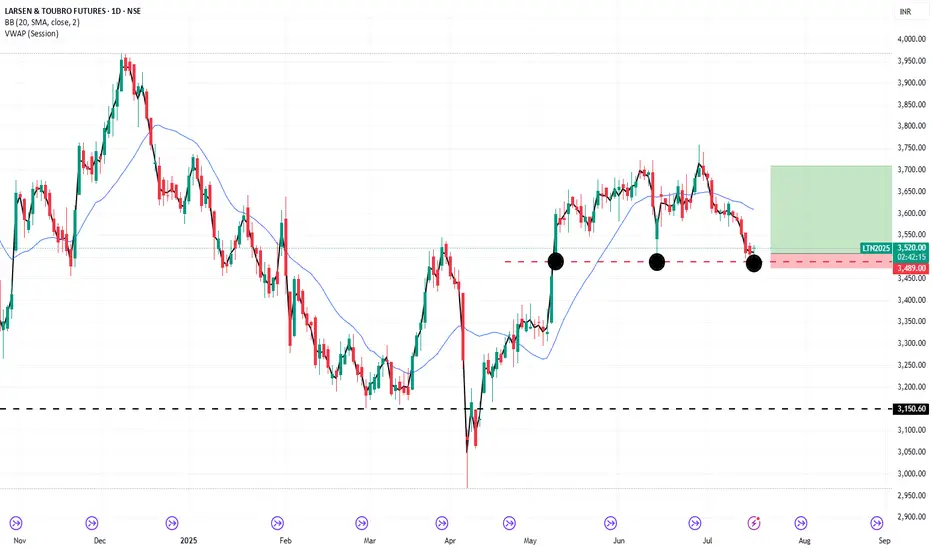
0.5:2 = risk:rewardIts third time LT is taking support @ 3480 & bouneing back, if it sustains & close above 3525 then it ll target 3700.
Very good Risk:Reward Ratio.
Could b bought @ cmp Wih Stoploss of 3475 & target of 3700
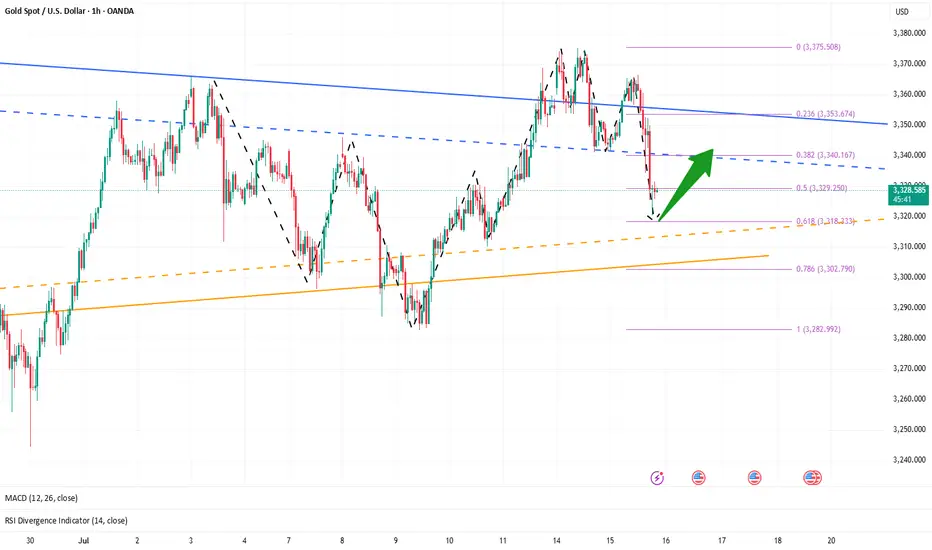
Golden Support Holds — Bulls Poised for Another Leg Higher"If gold cannot break through the 3365-3375 area, gold will fall under pressure again, or refresh the recent low of 3341, and continue to the 3335-3325 area." Gold's performance today is completely in line with my expectations. Gold just retreated to a low of around 3320, but soon recovered above 3325, proving that there is strong buying support below.
From the current gold structure, the short-term support below is mainly concentrated in the 3320-3310 area. If gold slows down its downward momentum and its volatility converges when it approaches this area, then after the gold bearish sentiment is vented, a large amount of off-site wait-and-see funds will flow into the gold market to form strong buying support, thereby helping gold regain its bullish trend again, thereby starting a retaliatory rebound, or a technical repair rebound.
Therefore, for short-term trading, I still insist on trying to go long on gold in the 3330-3320 area, first expecting gold to recover some of its lost ground and return to the 3340-3350 area.
Gold 16.07.25Over the last 2 weeks there was this redistribution model forming, where i yesterday found an entry. The Initial distribution i was looking for in may never hit it's target, so i might be able to ride this trade all the way down. The time displacement on the last tap wasn't the best, so there might be another move into the POI's, where i then have to reenter. It would suck a little bit though, atm it's an 39 R/R.
BUY XAUUSD 16.7.2025Trend Resumption at H1: BUY at M15
Type of order: Limit order
Reason:
- The price brokeout the sub key of M15, confirming the uptrend into main key M15.
Note:
- Management of money carefully at the price of sub key M15 (3335)
Set up entry:
- Entry buy at 3325
- SL at 3319
- TP1: 3335
- TP2: 3347
Trading Method: Price action (No indicator, only trend and candles)
