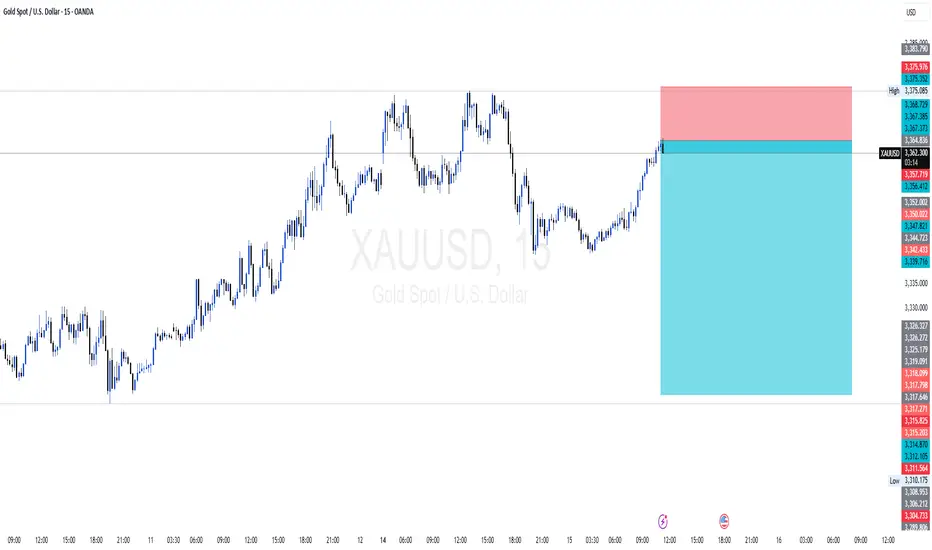
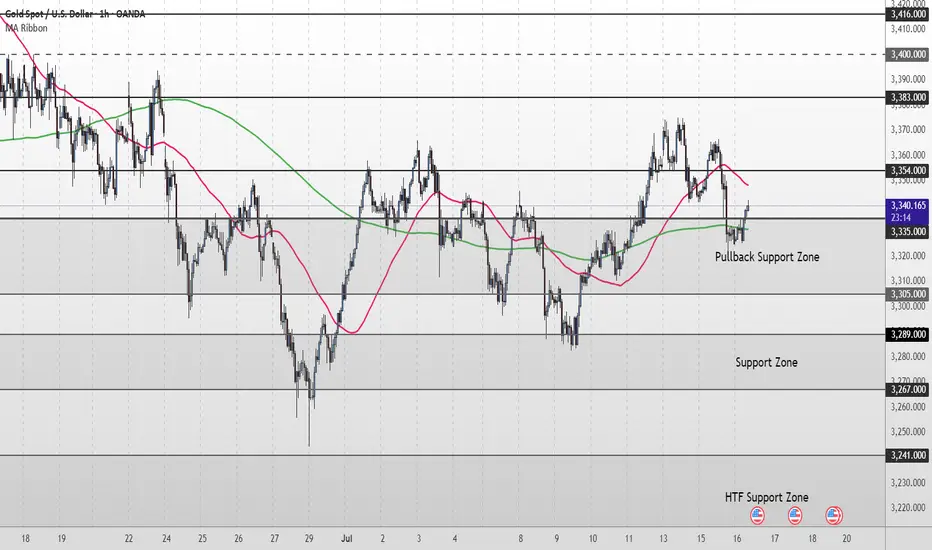
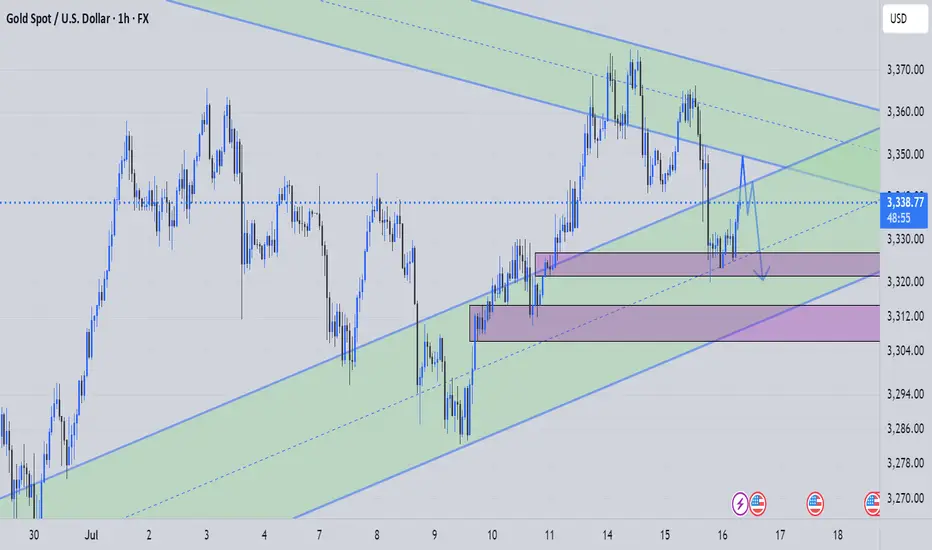
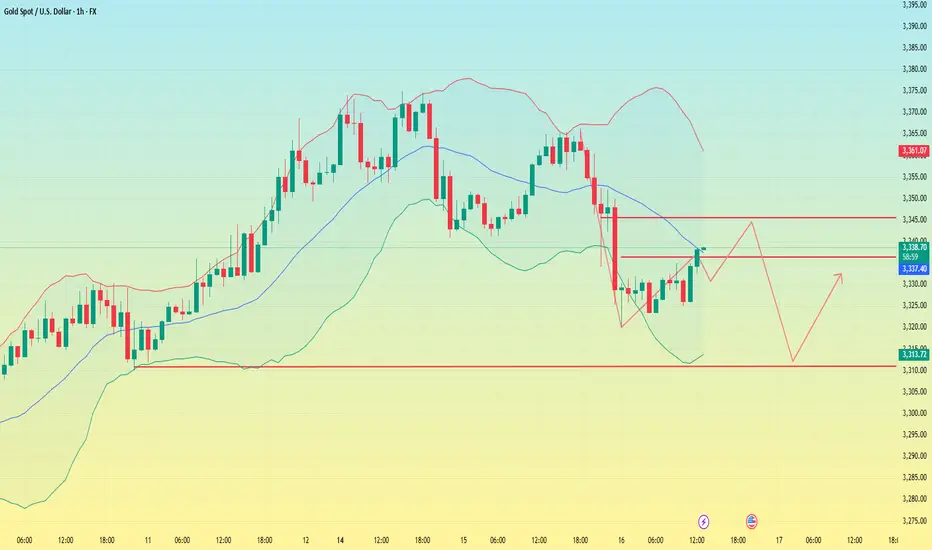
Gold Short Term OutlookGold has pulled back sharply from the 3,354 resistance but found support inside the Pullback Zone (3,335–3,3305 where buyers have stepped back in. Price is now attempting to reclaim ground, trading around 3,341, with the 50MA acting as dynamic resistance overhead and the 200MA as dynamic support.
For the bullish move to continue, we need to see a clean break and hold above 3,354. That would reopen the path toward 3,383 and 3,400, with 3,416 as the higher-timeframe target.
If price fails to clear 3,354 and rolls over again, watch the Pullback Zone (3,335–3,305) for signs of exhaustion. A break below 3,305 would shift focus to the deeper Support Zone (3,289 - 3,267) and potentially toward 3,241 - 3,208 if bearish pressure accelerates.
📌 Key Levels to Watch
Resistance:
‣ 3,354
‣ 3,383
‣ 3,400
‣ 3,416
Support:
‣ 3,335
‣ 3,305
‣ 3,289
‣ 3,267
‣ 3,241
🔎 Fundamental Focus – PPI Release Today
Today’s U.S. Producer Price Index (PPI) will be closely watched as a follow‑up to yesterday’s CPI data.
Futures market
Gold sell at 3.345 area Classic pullback on the 1 hr chart , broke down through double top formation to 3323 should rebound back up to under double top resistance of 3345, then look for signal to pull directly down to 3300 fib support level . So watch at the 3345 point for pullback here sell there

Public short selling profit, NY short-term multiple layoutInterest rate futures data showed that the results were in line with our previous expectations, with a lower rate cut this month and a higher probability of a 25 basis point cut in September. In the short term, gold may first take profits and then rebound. NY session trading has just begun. Bros can pay attention to the 3335-3330 area below. If it falls back and stabilizes, you can consider participating in long positions, defending 3325 and targeting 3355-3365.
OANDA:XAUUSD

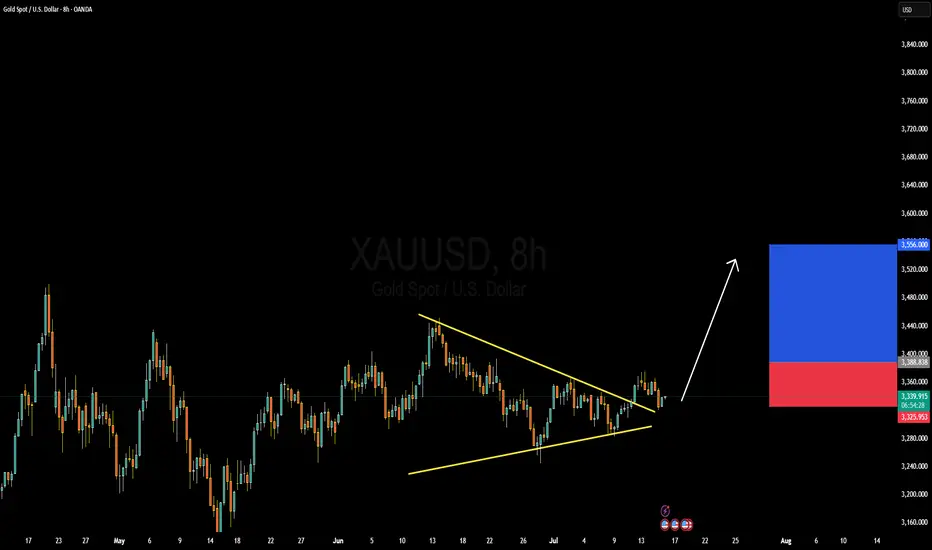
XAUUSD Forming Falling WedgeGold (XAUUSD) has recently completed a textbook falling wedge breakout, confirming a powerful bullish reversal setup on the higher timeframes. This pattern, known for its strong trend-continuation potential, has played out beautifully. After a period of consolidation and lower highs, price has decisively broken above wedge resistance and is now pushing higher with strong bullish momentum. We've already captured significant profit from the breakout zone, and price action suggests another wave to the upside is imminent.
Fundamentally, gold continues to benefit from growing geopolitical tensions, elevated inflation concerns, and central bank reserve accumulation. With the Federal Reserve leaning cautiously dovish due to signs of a softening labor market and cooling inflation, real yields are under pressure. This is supportive for gold, especially as markets begin to price in potential rate cuts before year-end. The weakening US dollar and stable treasury yields are reinforcing demand for precious metals, particularly among institutional investors seeking safety and hedge assets.
Technically, gold has broken its bearish structure and is forming a new bullish leg, supported by strong volume and RSI divergence at the lows. The breakout from the falling wedge pattern has opened up upside targets toward recent swing highs and potentially even all-time highs if macro conditions remain favorable. With price now above key moving averages and consolidating above the wedge breakout zone, the technical bias is clearly bullish.
This move aligns well with seasonality and macro risk flows. As risk-off sentiment slowly builds and inflation risks remain unresolved globally, gold is regaining its status as a premier safe-haven asset. Expecting continued follow-through in the coming weeks, with clean structure and fundamentals favoring bulls, this setup remains a high-probability opportunity to ride the next impulsive bullish leg.
16th-July-Wed-Nifty Projection and grid system Hello Everyone
This is the projection for 16th-Wed Grid System
depending on the price action we see that market has opened and is bearish range
will be interesting to see where the close will be for the day
Grid-_-Work's
thank you for your time

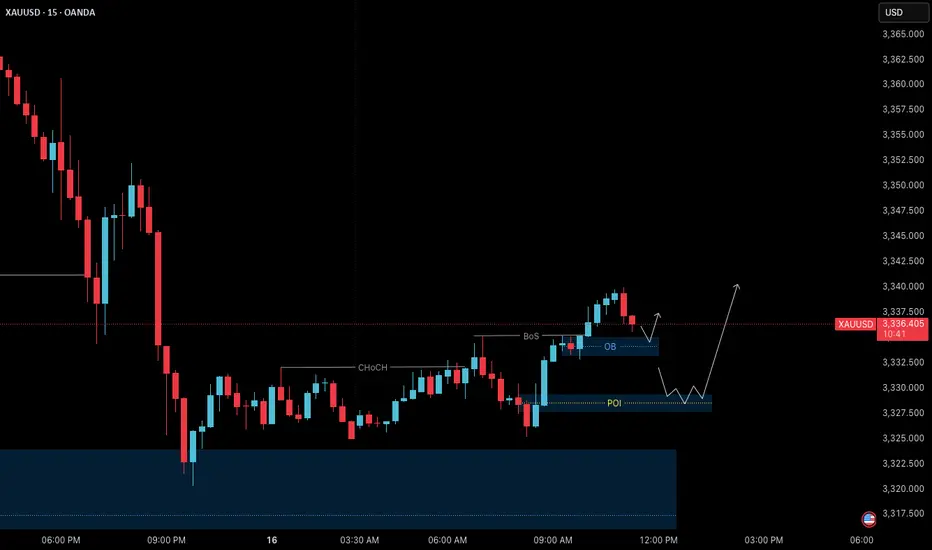
Gold – Bullish Structure Confirmed | July 16 Outlook🟢 Gold (XAUUSD) – July 16 Analysis | Uptrend Resumed After H4 OB Test
As outlined in our previous post — Gold – H4 Structure at Key Decision Point | July 14 Outlook , price has now tested the H4 order block near 3320, which we marked as a high-probability reversal zone.
Following this, the market has shown clear signs of strength — with both internal structure shift and a Break of Structure (BoS) on M15, confirming that the uptrend has resumed.
🔍 Structure Alignment:
✅ H4: Bullish continuation after OB test
✅ M15: ChoCH + BoS → confirms trend alignment with H4
📌 Key Intraday Levels to Watch:
🟩 3335–3333 (M15 Order Block & Breaker Level):
→ A short-term OB just before our main POI
→ If price respects this zone with LTF confirmation (M1 Micro-ChoCH + BoS), we may plan an early long entry
🟩 3327.7–3329.4 (Main M15 POI Zone):
→ High-probability continuation zone
→ On retest + LTF confirmation → plan for long setup
📈 Trade Plan:
→ Watch 3335–3333 OB first
→ If respected with M1 confirmation, early entry is valid
→ If that zone fails, wait for price to revisit 3327–3329 POI
→ Same confirmation rules apply
In both cases, target new HH, in line with current trend momentum
📖 When price respects structure and confirms behavior, don’t second-guess — follow the process.
📘 Shared by @ChartIsMirror
2nd Leg Down Likely on the DailyNews impact yesterday pushes the market higher only to reverse throughout the day. A retest of swing low is expected for a bearish continuation. With another news coming, perhaps a minor pullback then chop and drop.
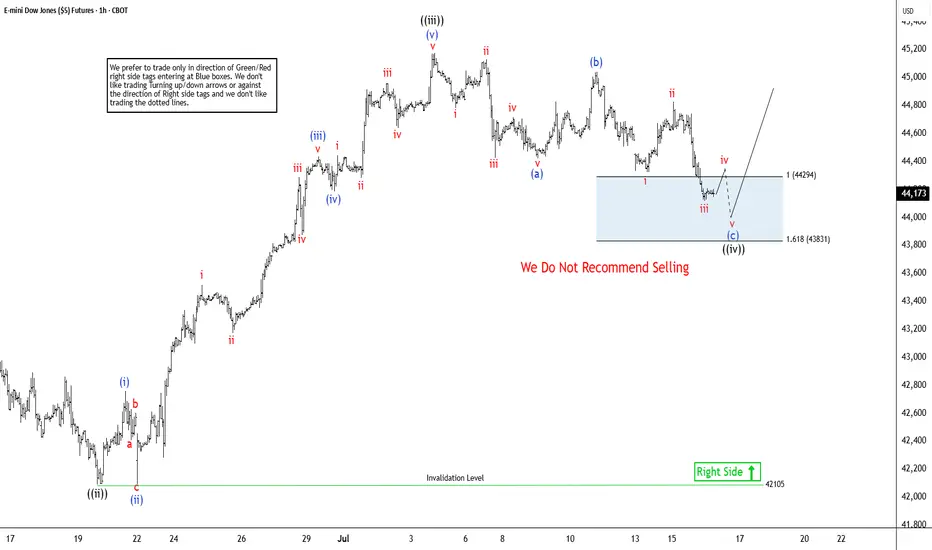
Dow Jones Futures (YM_F) Expects Rally From Extreme AreaThe Dow Jones E-mini Futures (YM_F) favors impulsive rally from 4.07.2025 low of 36708. It is trading close to the previous high of 1.31.2025 of 45227. A break above that level will confirm the bullish sequence. Other US indices like Nasdaq & S & P 500 futures already confirmed the new high in daily, calling for more upside against April-2025 low. As per latest Elliott wave sequence in Dow Jones, it favors upside & pullback in 1-hour remain supported in extreme area to rally higher. Since April-2025 low, it placed 1 at 42976 high & 2 at 41236 low. Above there, it favors upside in 3 of (1) & expect one more push higher, while dips remain above price trendline. We like to buy the pullback in 3, 7 or 11 swings at extreme area for next rally.
Within 3, it ended ((i)) at 43316 high, ((ii)) at 42088 low & ((iii)) at 45177 high. In wave ((iii)), it ended (i) at 42759 high, (ii) at 42096 low, (iii) at 44435 high, (iv) at 44185 low & (v) at 45177 high. Currently, it favors pullback in zigzag correction in ((iv)) & expect small downside in to 44286 – 43815 area before resume upside in ((v)) of 3. Within ((iv)), it placed (a) at 44482 low, which subdivides in 5 swings. It placed (b) at 45043 high in 3 swings bounce that almost corrects 90 % of (a). Currently, it favors downside in (c), which should unfold in 5 swings in to extreme area. Within (c), it placed i at 44324 low, ii at 44827 high & iii at 44118 low. It favors bounce in iv before final down in v to finish the (c) of ((iv)) against 6.19.2025 low before rally resumes towards 45500 or higher levels. In 4-hour, it expects two or more highs to finish the impulse sequence from April-2025 low before it may see bigger correction
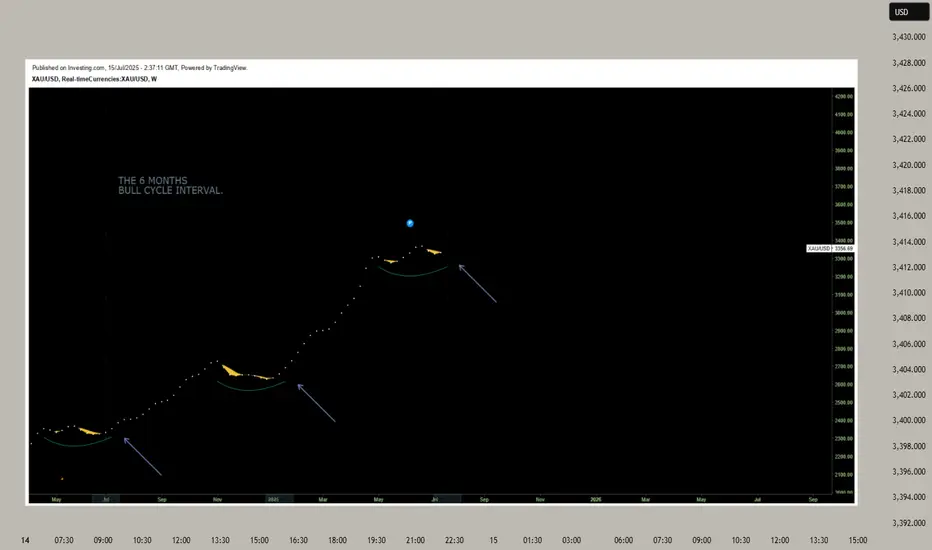
GOLD has entered a NEW BULL CYCLE this month! GET LOADED now!GOLD, has been on a consistent ascend since 2k levels hitting a series of ATH taps week after week.
As with any parabolic event -- a trim down is warranted.
After hitting its ATH zone at 3500, gold significantly corrected back to 38.2 fib levels at 3100 area. 38.2 fib levels has been acting as a strong support for GOLD for quite a bit and as expected buyers has started to converge and positioned themselves back again for that upside continuation -- long term.
After hitting this fib key level gold has been making consistent higher lows on the daily conveying clear intentions on its directional narrative -- to go NORTH.
As of this present, July 2025, GOLD has seen renewed elevation in momentum metrics signifying definitive blueprint towards its next upside move.
Based on our diagram above. WE have now entered a new bull cycle that only transpires every 6 months. The last cycles happened on July 2024, January 2025, then presently July 2025 which is in progress. This is very special as we dont get to see this bullish setup on a regular basis.
Ideal seeding zone is at the current range of 3300-3350.
Mid-Long Term Target at 3400
TAYOR.
Trade safely. Market is Market.
Not financial advice.
XAUUSD 1HXAUUSD 1H Technical Analysis
📈 Expected Scenario:
Your projection implies the following:
Short-term pullback into the 3,305–3,315 demand zone.
A bullish reversal from this level, supported by price structure and prior demand imbalance.
Upside targets: First at 3,365 (minor supply), then extension toward 3,385–3,400.
This view is technically valid, as the market seems to be collecting liquidity below intermediate lows while maintaining structural integrity.
📌 Key Zones ("Your Borders"):
🔽 Demand Zone (Support)
Location: 3,305 to 3,315
Purpose: Your chart illustrates this as the primary reaccumulation zone. It aligns with a mid-structure demand zone and could serve as the launchpad for the next leg up, especially if paired with bullish order flow or volume confirmation.
Below this: A deeper, stronger demand lies around 3,285–3,295 (also marked by your 0.5 level at ≈3,286.14), which may act as a final liquidity grab zone before continuation.
🔼 Supply Zones (Resistance)
Lower Supply: 3,355–3,365
Upper Supply: 3,375–3,385
These zones represent potential profit-taking areas for any longs initiated at the demand. A breakout above 3,385 would suggest a continuation toward the 3,400–3,420 macro resistance.

xauusd setup"🌟 Welcome to Golden Candle! 🌟
We're a team of 📈 passionate traders 📉 who love sharing our 🔍 technical analysis insights 🔎 with the TradingView community. 🌎
Our goal is to provide 💡 valuable perspectives 💡 on market trends and patterns, but 🚫 please note that our analyses are not intended as buy or sell recommendations. 🚫
Instead, they reflect our own 💭 personal attitudes and thoughts. 💭
Follow along and 📚 learn 📚 from our analyses! 📊💡"
Xausd techinical analysis.This chart is a 1-hour candlestick chart of Gold Spot (XAU/USD) with various technical indicators and annotations. Here's a breakdown of the key elements:
---
🔍 Technical Analysis Overview:
1. Price:
Current price: 3,338.205
Up by +13.200 (+0.40%)
2. Chart Patterns:
Bullish Harmonic Pattern (Possibly a Bat or Gartley): Formed prior to the upward movement.
The pattern suggests a potential reversal zone (PRZ) around the 3,330 area, which seems to have held as support.
3. Yellow Path (Projected Price Action):
Suggests a bullish scenario:
Continuation of higher lows and higher highs.
Targets:
~3,348 (mid resistance)
~3,360–3,370 (major resistance zone)
4. Support & Resistance Zones (Purple lines):
Support: Around 3,330 (confluent with PRZ and recent bounce).
Resistance levels:
~3,348–3,350
~3,360–3,370
Trendline resistance (descending pink line) intersects around 3,360.
5. Volume & Event Markers:
**Purple

Gold has bounced back after tapping into the Fair Value Gap.📈 Gold Market Daily Outlook 💰
Gold has bounced back after tapping into the Fair Value Gap (FVG) and clearing liquidity below recent lows.
🔥 Price is now heading into a key bearish FVG zone on the 4H chart.
📊 Key Level to Watch:
If $3339 breaks with strong bullish momentum, we could see a further push towards $3350 and beyond.
⚠️ Reminder:
This is not financial advice — always DYOR (Do Your Own Research)!

Gold (XAU/USD) 4-hour chart4-hour chart of Gold (XAU/USD)** showing a key technical setup near the \$3,344 level. Price action is testing a significant **resistance zone** highlighted in grey, with two possible scenarios unfolding from this level.
**Chart Analysis Overview:**
* Gold has been in a **bullish short-term trend**, forming higher lows and pushing above the **EMA 7, 21, and 50**, all converging near the \$3,324–\$3,331 area (acting as dynamic support).
* Price is now approaching a **multi-tested resistance zone** near \$3,360–\$3,390, where it has previously faced selling pressure.
* Volume is rising, supporting the current bullish momentum.
**Scenario 1: Bullish Breakout (Green Path)**
**Conditions:**
* Price breaks and holds above the \$3,360–\$3,390 resistance zone.
* Continued bullish momentum supported by trade tensions, safe-haven demand, and Fed uncertainty.
**Target:**
* First target: \$3,400
* Extension: \$3,420–\$3,440 zone if momentum strengthens.
**Invalidation:**
* Failure to hold above \$3,360–\$3,390 range could limit upside potential.
**Scenario 2: Bearish Rejection (Red Path)**
**Conditions:**
* Price gets rejected from the resistance zone (\$3,360–\$3,390).
* Fails to establish support above the breakout level and drops back below \$3,330.
**Target:**
* Immediate support at \$3,310–\$3,290
* Deeper correction towards \$3,260–\$3,220 if bearish pressure increases.
**Confirmation:**
* Look for bearish candlestick patterns near resistance (e.g., shooting star, bearish engulfing).
* Drop below EMA cluster (\$3,324–\$3,331) to confirm weakness.
**Conclusion:**
Gold is at a decision point near major resistance. A breakout above \$3,390 could extend the bullish rally, while failure to break this level may invite sellers and trigger a correction. Watch price action around this resistance for confirmation of the next move.

Gold fluctuates downward. Can it break through?The CPI data released is in line with expectations, the tariff storm is still continuing, inflation rebounds and the Fed's expectations of interest rate cuts have cooled. Gold rebounded to 3366 and then fell, and is currently fluctuating around 3330.
From the current trend, gold fell strongly and broke through the Bollinger middle rail and the moving average support. The daily line focuses on the Bollinger middle rail under pressure near 3340, and the short-term support is at 3310. At present, a staged top pattern has been formed and the K-line double top is around 3366. The Bollinger moves downward and the price is in a downward channel.
For short-term operations, Quaid believes that the strategy of rebound shorting can still be followed.
Short near 3345, stop loss 3355, profit range 3330-3310
Long near 3310, stop loss 3300, profit range 3330-3345
Using 1 min time frame for entries on VX algo & day tradingwhat time frames do you use to confirm entries outside of a buy signal?
If I am day trading, I will mainly use the 1 minute time frame to look for moving average support and resistance, and read the candle stick patterns as well from that chart.
However, there are times I'll switch to a 5 minute and 10 minute time frame to take a look at levels for moving averages and see what the candle stick patterns are from there.
So for example, today we had 3 of the x1 sell signals around 9:31, so we pull up the 1 min chart, we are getting confirm break of the 1st moving average support = bearish confirmation #1, follow by DHC = Bearish confirmation #2 , and the sell signal is already 3 confirmations, so we need to short ASAP.

Gold intraday key resistance at 3343-3348The analysis indicates a bearish trend in gold, support by downward price movement. Short position below 3350 with target 3320 and 3310.

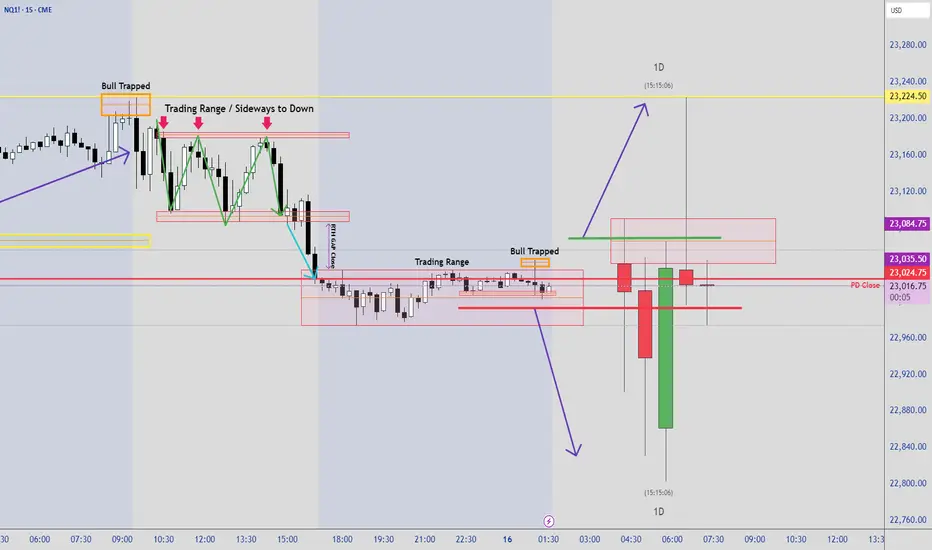
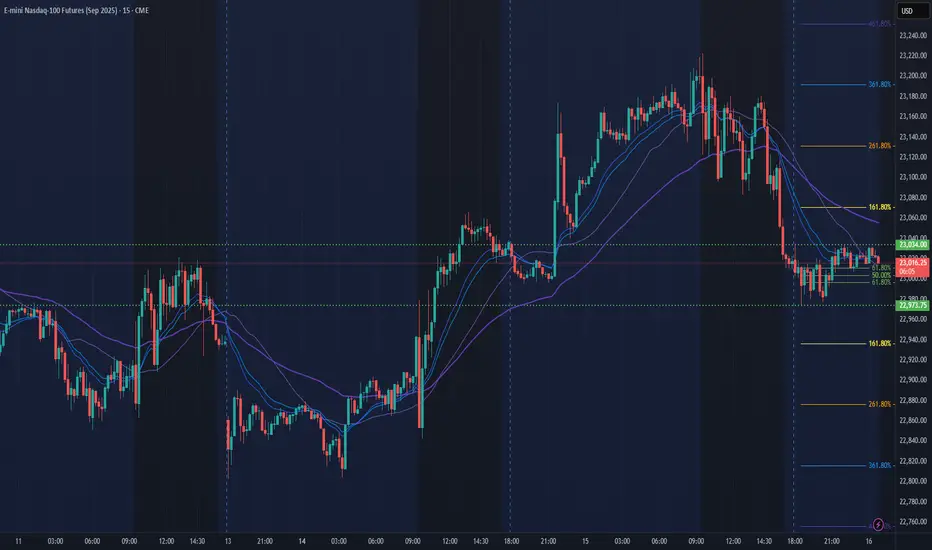
NQ Power Range Report with FIB Ext - 7/16/2025 SessionCME_MINI:NQU2025
- PR High: 23034.25
- PR Low: 22973.75
- NZ Spread: 135.5
Key scheduled economic events:
08:30 | PPI
10:30 | Crude Oil Inventories
AMP margins raised overnight for expected PPI volatility
Session Open Stats (As of 12:25 AM 7/16)
- Session Open ATR: 277.22
- Volume: 27K
- Open Int: 277K
- Trend Grade: Neutral
- From BA ATH: -0.8% (Rounded)
Key Levels (Rounded - Think of these as ranges)
- Long: 23239
- Mid: 21525
- Short: 20383
Keep in mind this is not speculation or a prediction. Only a report of the Power Range with Fib extensions for target hunting. Do your DD! You determine your risk tolerance. You are fully capable of making your own decisions.
BA: Back Adjusted
BuZ/BeZ: Bull Zone / Bear Zone
NZ: Neutral Zone
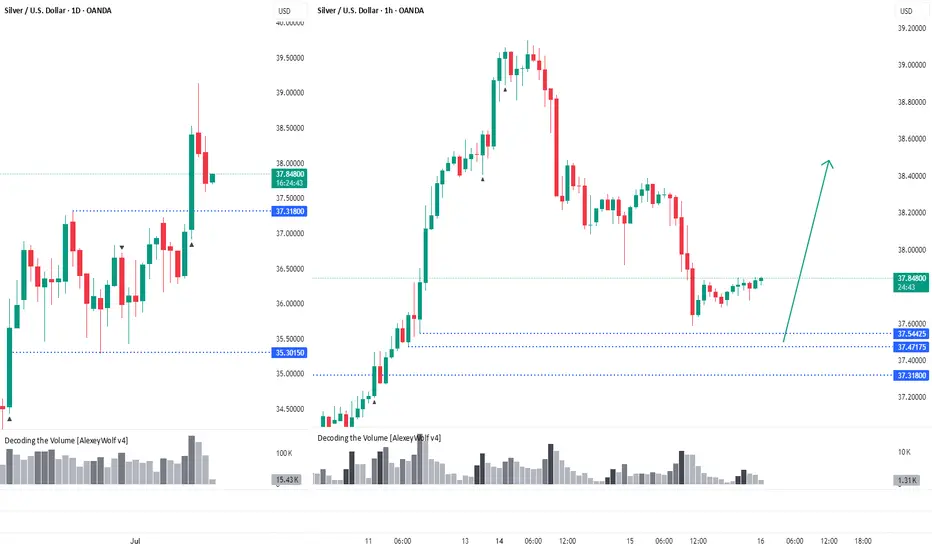
Silver. The price has pulled backHi traders and investors!
On the daily timeframe, the price has broken out of the sideways range through the upper boundary at 37.31.
The price has pulled back close to levels where potential buy patterns could form — 37.54, 37.47, and 37.31.
This analysis is based on the Initiative Analysis concept (IA).
Wishing you profitable trades!
What Gold actually wants to sayThis trend line shows on daily chart that gold is sustaining on his supports and rising day by day, Pure bullish in long run for swing and position trading.

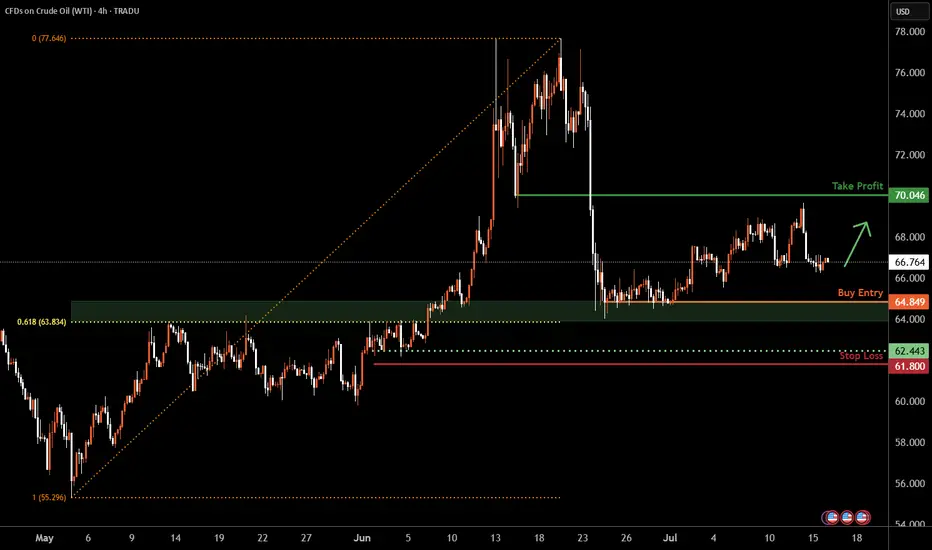
WTI Oil H4 | Potential bounce off a multi-swing-low supportWTI oil (USOIL) is falling towards a multi-swing-low support and could potentially bounce off this level to climb higher.
Buy entry is at 64.84 which is a multi-swing-low support that aligns closely with the 61.8% Fibonacci retracement.
Stop loss is at 61.80 which is a level that lies underneath a multi-swing-low support.
Take profit is at 70.04 which is a pullback resistance.
High Risk Investment Warning
Trading Forex/CFDs on margin carries a high level of risk and may not be suitable for all investors. Leverage can work against you.
Stratos Markets Limited (tradu.com ):
CFDs are complex instruments and come with a high risk of losing money rapidly due to leverage. 63% of retail investor accounts lose money when trading CFDs with this provider. You should consider whether you understand how CFDs work and whether you can afford to take the high risk of losing your money.
Stratos Europe Ltd (tradu.com ):
CFDs are complex instruments and come with a high risk of losing money rapidly due to leverage. 63% of retail investor accounts lose money when trading CFDs with this provider. You should consider whether you understand how CFDs work and whether you can afford to take the high risk of losing your money.
Stratos Global LLC (tradu.com ):
Losses can exceed deposits.
Please be advised that the information presented on TradingView is provided to Tradu (‘Company’, ‘we’) by a third-party provider (‘TFA Global Pte Ltd’). Please be reminded that you are solely responsible for the trading decisions on your account. There is a very high degree of risk involved in trading. Any information and/or content is intended entirely for research, educational and informational purposes only and does not constitute investment or consultation advice or investment strategy. The information is not tailored to the investment needs of any specific person and therefore does not involve a consideration of any of the investment objectives, financial situation or needs of any viewer that may receive it. Kindly also note that past performance is not a reliable indicator of future results. Actual results may differ materially from those anticipated in forward-looking or past performance statements. We assume no liability as to the accuracy or completeness of any of the information and/or content provided herein and the Company cannot be held responsible for any omission, mistake nor for any loss or damage including without limitation to any loss of profit which may arise from reliance on any information supplied by TFA Global Pte Ltd.
The speaker(s) is neither an employee, agent nor representative of Tradu and is therefore acting independently. The opinions given are their own, constitute general market commentary, and do not constitute the opinion or advice of Tradu or any form of personal or investment advice. Tradu neither endorses nor guarantees offerings of third-party speakers, nor is Tradu responsible for the content, veracity or opinions of third-party speakers, presenters or participants.
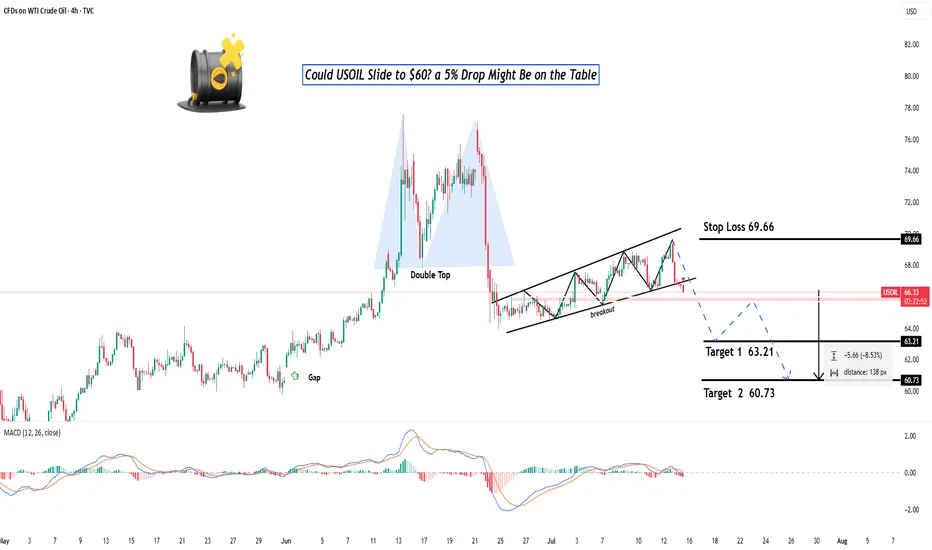
Could OIL Slide to $60? a 5% Drop Might Be on the Table? Hey Realistic Traders!
Price action is weakening. Will USOIL find support or slide further?
Let’s Break It Down..
On the 4H timeframe, oil has formed a double top pattern followed by a neckline breakout, which is a classic sign of a potential shift from a bullish to a bearish trend.
This breakout was confirmed by a break below the bullish trendline, accompanied by consecutive bearish full-body candlesticks that reinforce the bearish momentum. Afterward, the price formed a bearish continuation pattern known as a rising wedge, which was followed by a breakdown.
The combination of bearish reversal and continuation pattern breakouts signals further downside movement and confirms the shift into a bearish trend.
Therefore, we foresee the price forming lower lows and lower highs toward the first target at 63.21, with a potential extension to the close the gap at 60.73.
The bearish outlook remains valid as long as the price stays below the key stop-loss level at 69.66.
Support the channel by engaging with the content, using the rocket button, and sharing your opinions in the comments below.
Disclaimer: This analysis is for educational purposes only and should not be considered a recommendation to take a long or short position on USOIL.
XAUUSD Shortat 15 min TF i can see a short trade as price has retraced so well now it is the time to short it till 3309