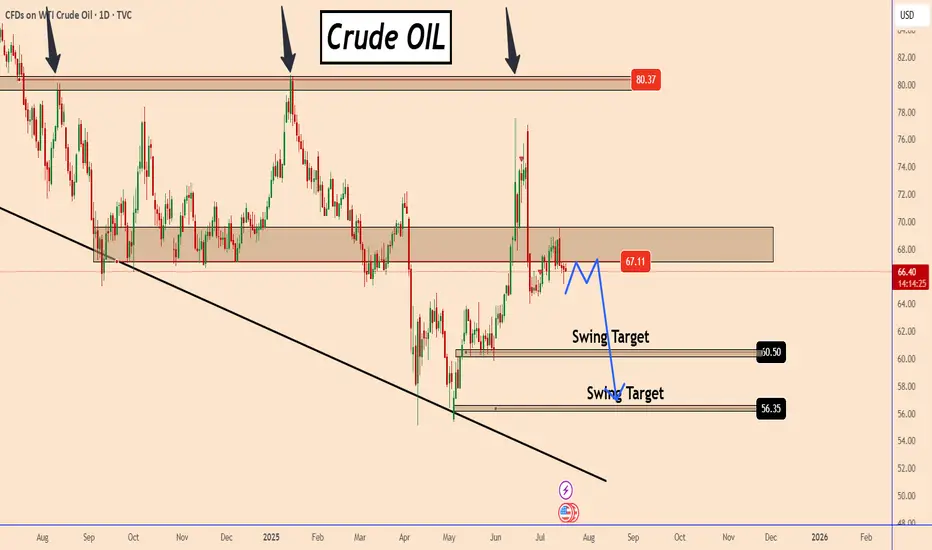
OIL: The Chances To Drop Are Growing FurtherOIL: The Chances To Drop Are Growing Further
OIL has days in this zone. Overall it's developing as I explained earlier.
The price increased a bit more than expected but again it's in a strong structure zone and is holding strong.
I think that OIL has to create a better pattern, but overall it looks poised to drop further from this zone with targets 60 and 56
You may find more details in the chart!
Thank you and Good Luck!
PS: Please support with a like or comment if you find this analysis useful for your trading day
Futures market
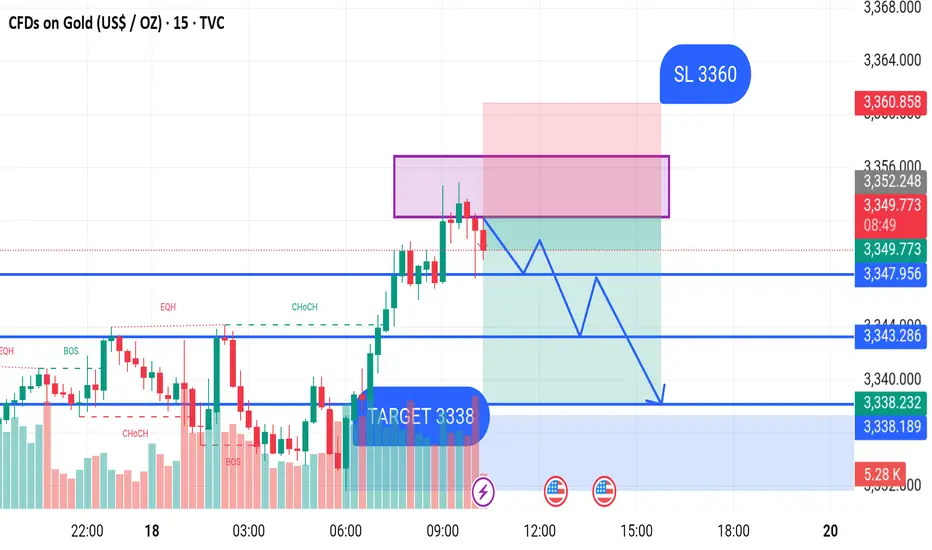
XAUUSD Analysis Of next waveSo the Analysis of gold is that if 3343-3345 holds we can travel to 3392-3388 as mentioned there the wave completion target is there

Gold prices are on the rise again!Market news:
In the early Asian session on Friday (July 18), spot gold fluctuated in a narrow range and is currently trading around $3,336 per ounce. London gold prices staged a thrilling "deep V" market yesterday, hitting a daily low of $3,309 during the session and recovering to 3,339 at the end of the session. Strong US retail sales and employment data drove the dollar to rebound and US Treasury yields to rise, putting pressure on interest-free assets such as gold. Despite this, geopolitical tensions and rising tariff risks are still providing bottom support for the gold market. The international gold market is currently in a multi-game of Fed policies, US economic data, US dollar trends and tariff policies. The Fed's position of postponing interest rate cuts, strong retail and employment data, and the rise in the US dollar and US Treasury yields have suppressed gold prices in the short term. This trading day needs to pay attention to the preliminary value of the University of Michigan Consumer Confidence Index in July and US real estate market data, pay attention to the G20 Finance Ministers and Central Bank Governors Meeting hosted by South Africa, and pay attention to news related to the international trade situation.
Technical Review:
Gold closed with a small positive line with a long upper shadow yesterday. Although it ended the continuous negative trend, it still faced sideways resistance below 3374, and the overall market still needs to be treated as a shock consolidation. From a large cycle perspective, gold has entered a convergent triangle consolidation phase of nearly three months. Among them, the lower track support line gradually moved up to above 3310. The support strength of this position continues to increase as the consolidation time lengthens. If the price touches or approaches this point, you can decisively try to buy the bottom layout.For two consecutive trading days, gold has been consolidating in a larger range of 3377/3310, and finally closed at the starting point of the daily Bollinger band middle track at the end of the trading day. Gold returned to the middle axis of the range at 3340. The daily chart Bollinger band middle track, the RSI indicator middle axis flattened, the four-hour chart hourly chart Bollinger band middle track, and the RSI indicator neutral middle axis. On Friday, the layout of the day will still be based on a wide range of fluctuations. Look at the 3320/3360 range first. Alternating buying and selling cycles, large range of wide fluctuations!
Today's analysis:
In the past two days, gold has always risen in the US market due to news. Last night, Trump called on the Federal Reserve to cut interest rates, and gold rose again. However, judging from the recent market, the market stimulated by the news is still unsustainable. Since gold has rebounded now, gold will continue to sell at a high level in the early trading.
Excluding yesterday's market affected by Trump, the gold price operation pattern this week is close to perfect, and it has been steadily operating under the suppression of the downward trend line. Therefore, the market has given a clear direction. It is OK to sell when the Asian market rebounds to the pressure level. Gold is still in a fluctuating downward trend in 1 hour!
The downward trend resistance of gold has moved down to around 3350. Before gold effectively breaks through 3350, gold is under pressure at 3350 and continues to sell at high prices. Today, Friday, the probability of gold having a big market is relatively high, and if there is a big market on Friday, it is basically weak throughout the day. If it is strong, it is strong throughout the day. As long as gold continues to be weak in the European market, it is likely that gold will continue to fall today.
Operation ideas:
Buy short-term gold at 3317-3320, stop loss at 3308, target at 3340-3360;
Sell short-term gold at 3352-3355, stop loss at 3364, target at 3330-3310;
Key points:
First support level: 3323, second support level: 3310, third support level: 3290
First resistance level: 3348, second resistance level: 3360, third resistance level: 3377

Crude oil---sell near 67.50, target 65.00-60.00Crude oil market analysis:
Crude oil has also started to fluctuate recently. Pay attention to the impact of contract delivery on the trend of crude oil. The daily line of crude oil does not show the strength of its rebound. In terms of operation, it is still a rebound sell. Crude oil continues to be bearish. The situation in the Middle East has not made any major moves temporarily, and the support for crude oil is limited. Pay attention to the selling opportunities near 67.30 today.
Operational suggestions:
Crude oil---sell near 67.50, target 65.00-60.00

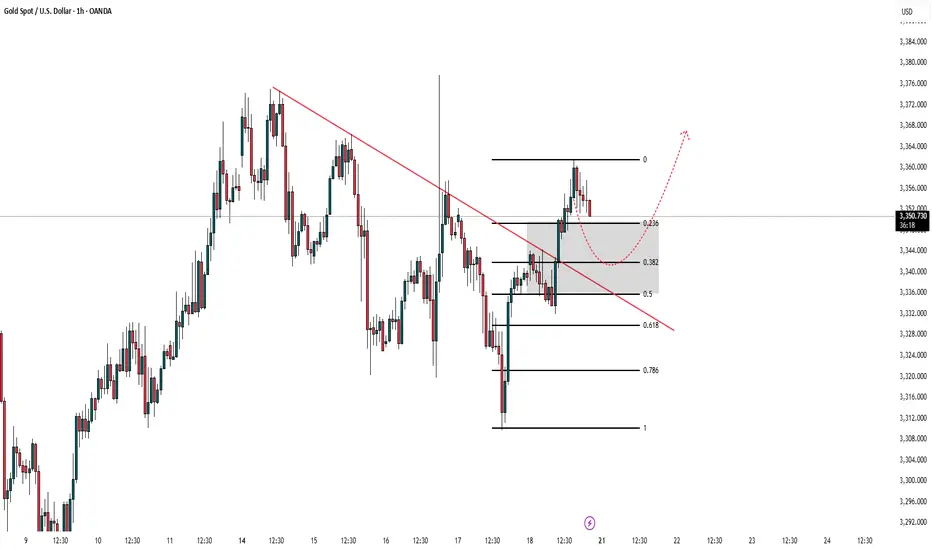
xau next week mapDear all traders wish you bests and hope you were profitable.
clear breakout happend from trend line.
expect a retracement as it has strong movement i think 23.6 would be enough
then you can search for a buy levels in lower timeframe like 15min
if wanted to trade sell we have to find clear structure and good momentum in 1 min or 5min
keep your risk management stay in market
good weeknd "ITS JUST GOOD BUSINESS"
Market Volatile Amid Geopolitical Tensions & Fed Rumors Gold 17/07 – Market Volatile Amid Geopolitical Tensions & Fed Rumors
🌍 Macro Sentiment: Uncertainty Continues
The global gold market opened Thursday with high volatility following headlines that former U.S. President Donald Trump was considering firing Fed Chair Jerome Powell. Though Trump later denied the claim, the initial rumor spiked fear in financial markets.
At the same time:
🇮🇱 Israel launched airstrikes on Syria, escalating regional tensions.
🇪🇺 The EU proposed new tariffs on U.S. imports, increasing global economic friction.
🏦 Inflation concerns persist as BlackRock warns about delayed price pressures from earlier tariff hikes.
📉 These factors have turned gold into a temporary safe haven, but investors should remain cautious as the market is still undecided about direction.
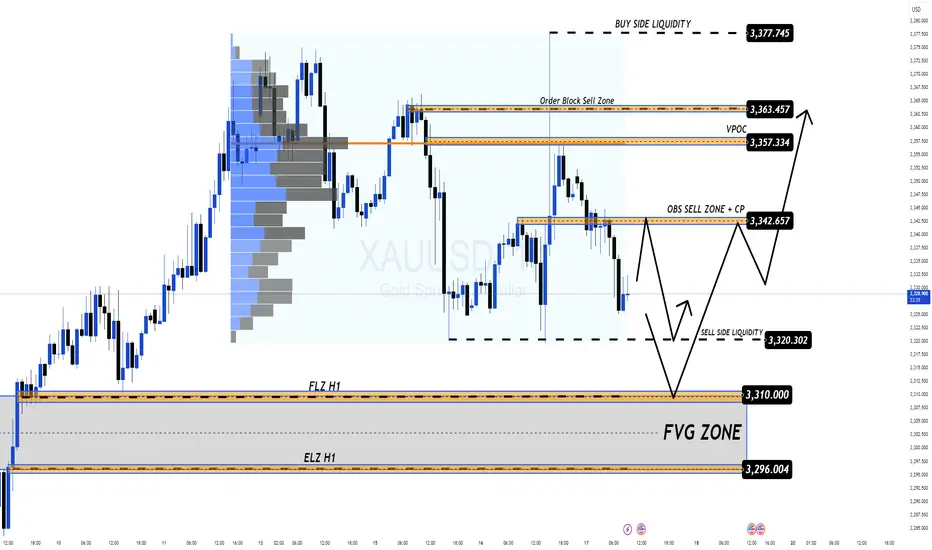
🔎 Technical Outlook – Key Patterns to Watch
The H1 chart reveals price action respecting a wide consolidation range with visible liquidity sweeps on both ends. The market is forming a clean structure of lower highs, hinting at bearish bias unless bulls reclaim upper resistance zones.
Sell-side liquidity has been swept around the 3,320 level.
Order Block Sell Zone remains active at 3,342 – 3,344, potentially leading to a short-term drop.
If price breaks above 3,357 – 3,363 (VPOC & OB zone), a new bullish leg may form.
🎯 Trade Plan for Today
🟩 Buy Opportunity Zone
Entry: 3,312 – 3,310
Stop Loss: 3,306
Take Profits:
→ 3,316 → 3,320 → 3,324 → 3,328 → 3,335 → 3,340 → 3,350
📌 This zone has shown strong demand historically. Look for bullish candle confirmation on the lower timeframe (M15–H1).
🟥 Sell Opportunity Zone
Entry: 3,362 – 3,364
Stop Loss: 3,368
Take Profits:
→ 3,358 → 3,354 → 3,350 → 3,345 → 3,340
📌 This area overlaps with a VPOC level and prior order block – watch for price rejection patterns (e.g., bearish engulfing, fake breakouts).
⚠️ Risk Note
With geopolitical and monetary policy headlines dominating sentiment, price may spike erratically. Avoid overleveraging and always respect your SL/TP.
💬 What’s Your Take?
Do you think gold will break below 3,300 and head toward deeper FVG zones?
Or will bulls regain control and aim for 3,377 liquidity?
👇 Drop your analysis and let’s build the best gold trading community together!
#XAUUSD: Two Zones To Buy From! Swing MoveRecent conflicts in the Middle East have disrupted the market, causing a significant increase in volatility. We are closely monitoring the situation and anticipate potential price reversals from either of our entry points.
When trading gold, it is crucial to prioritise risk management.
Best of luck and safe trading.
Team Setupsfx_

THE KOG REPORT - UpdateEnd of day update from us here at KOG:
That was a difficult move to capture! I would not blame anyone for getting frustrated and FOMO'ing. Thankfully, we stuck to our guns, price was manipulated but our targets are completed as is the move we highlighted on Sundays KOG Report. I even say here and thought what on earth are they doing, but, we gave a level of 3318 as the line in the sand, we bounced before that and BOOM, all Excalibur targets completed in one go.
Now, we have support below at the 3340-45 level which is where they may settle for the session, above 3340 we're still likely to see a retest of the level, however, we said there is a curveball this week, and look at what is happening. Can't remember the last time I saw price action this bad!
Price: 3337
RED BOXES:
Break above 3350 for 3355✅, 3362✅, 3370✅ and 3376✅ in extension of the move
Break below 3335 for 3330✅, 3322✅, 3320✅ and 3314 in extension of the move
As always, trade safe
KOG

Gold scalp buying opportunity before final dropGold has broken above the mini bull flag formation and is currently sustaining above the structure. The strategy is to patiently await a pullback into the highlighted buy-back zone, where a favorable entry opportunity may present itself. Focus remains on the projected flag targets, as the ongoing momentum suggests promising upside potential. Monitor price action closely.

U.S. NATURAL GAS - BEARISH DIVERGENCE DETECTED
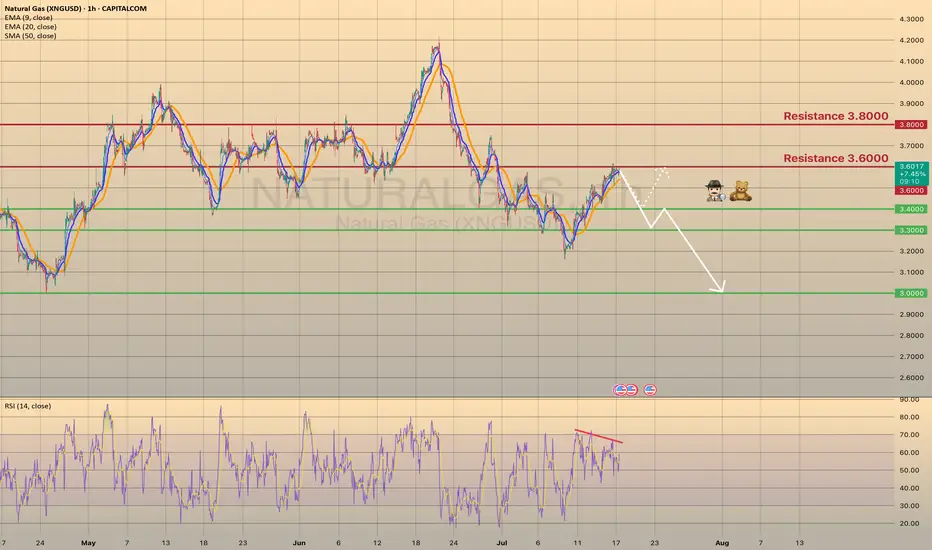
U.S. NATURAL GAS - BEARISH DIVERGENCE DETECTED🕵🏻♂️
The Natural gas has been trading bullish for 7 days in a row since last Wednesday, reaching the 3.6000 resistance level. Primarily this happened due to a warm weather in the U.S. states, that supports the demand on gas. Despite warmer-than-normal summer weather, analysts expect energy firms to inject more gas into storage than usual in coming weeks. Record-high output in June, likely to be surpassed in July, and reduced gas flows to LNG export plants since April's peak, support this trend.
Technically chart shows us a bearish divergence on 1-h timeframe. I suppose the price to slowly decline towards major support level of 3.0000 with minor rebounds. The 2nd option is the rebound from 3.4000 support level with a first target of 3.6000.
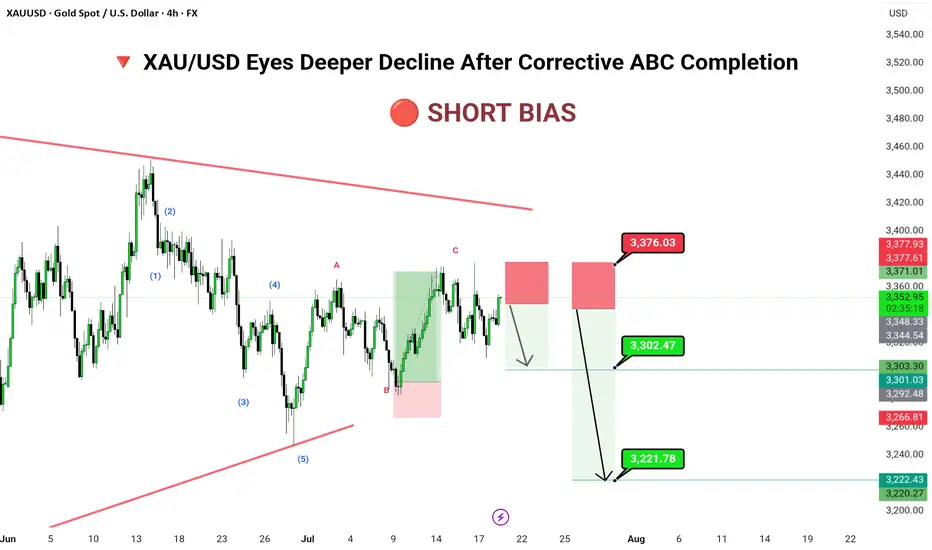
XAU/USD Eyes Deeper Decline After Corrective ABC Completion🔻 📊 Technical Structure (4H)
✅ 5-wave bearish impulse completed
✅ ABC correction likely completed
✅ Supply zone: 3,371–3,376
📌 Downside Targets
First: 3,302.47
Final: 3,221.78
🔻 Invalidation Zone
Above: 3,376.03 (Break above invalidates short scenario)
---
📈 Market Outlook
Macro Context: Gold faces pressure amid rising real yields and stronger dollar flows.
Technical Context: Price trapped within a long-term descending wedge; corrective rally meets resistance.
Risk Appetite: Risk-on tone limits safe-haven demand in short term.
---
⚠️ Risks to Watch
Breakout above 3,376 may trigger bullish breakout
Dovish Fed tone could reverse short-term USD strength
Geopolitical tension reviving gold demand
---
🧭 Summary: Bearish Structure in Play
XAU/USD has completed a textbook ABC retracement and now sits inside a key shorting zone. A rejection here opens space for significant downside toward 3,221. Traders should watch closely for bearish confirmation before committing to positions, with stops tightly placed above 3,376.
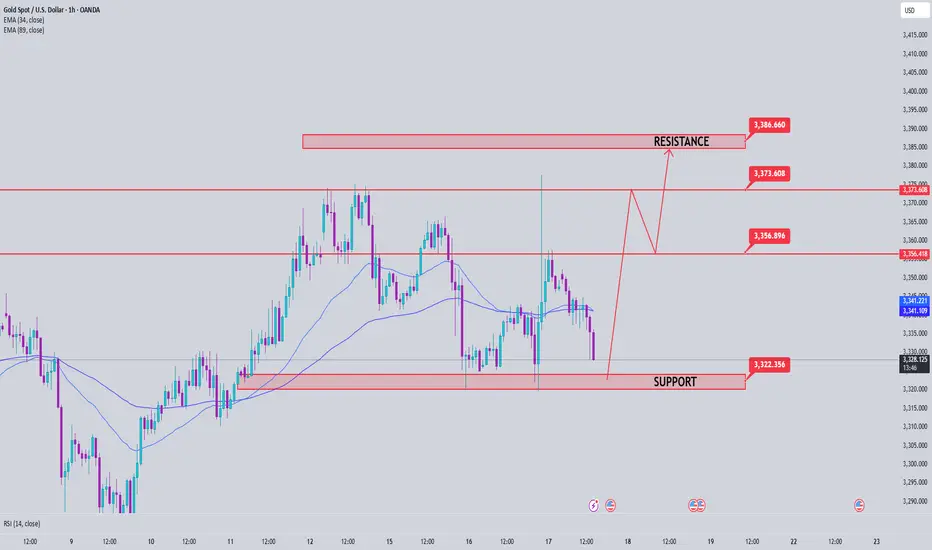
XUA/USD) Bearish Analysis Read The captionSMC trading point update
Technical analysis of XAU/USD (Gold vs USD) on the 1-hour timeframe. Here's a breakdown
Technical Analysis Summary
1. Descending Channel:
The price is moving within a clear descending channel, indicating a bearish market structure.
Recent price action rejected the upper boundary of the channel, strengthening the downtrend bias.
2. Resistance Rejection:
A key resistance level around 3,340–3,345 was retested (marked with a red arrow) and rejected.
Price has already shown early bearish candles post-rejection, suggesting weakness at that level.
3. 200 EMA (Exponential Moving Average):
Price is currently hovering around the 200 EMA, and a clean break below it could accelerate the bearish move.
4. RSI Indicator:
RSI is around 46, below neutral 50, showing bearish momentum is building but not yet oversold.
No divergence is present, supporting the idea of continuation.
---
Bearish Playbook
Entry Idea: After the rejection at the resistance zone and confirmation of lower highs.
Target: 3,313 – 3,310 zone (marked as the “key support level” and “target point”).
Risk Management: A stop loss above 3,345 (above the resistance zone) would be a prudent protection level.
---
Confluences Supporting the Short Setup:
Rejection at horizontal resistance.
Alignment with the descending trendline/channel.
Price trading near or below the 200 EMA.
RSI slightly bearish.
Caution:
Watch out for any macroeconomic news or high-impact events (highlighted with the economic event icons) that could inject volatility.
A strong break back above the resistance could invalidate this bearish setup.
Mr SMC Trading point
Conclusion:
This setup anticipates a bearish continuation targeting the 3,310 support zone. Ideal for short-term traders looking for downside opportunities, provided price respects the trend and fails to reclaim the resistance.
Please support boost 🚀 this analysis)

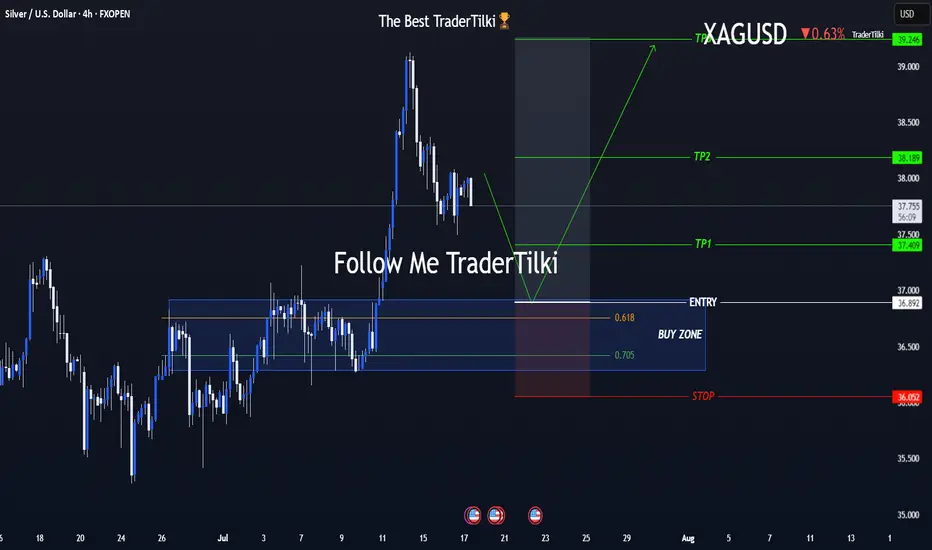
One Shot, Clear Strategy – Silver Buy Zone in SightHey everyone 👋
📌 BUY LIMIT ORDER / XAGUSD-SILVER Key Levels
🟢 Entry: 36,892
🎯 Target 1: 37,409
🎯 Target 2: 38,189
🎯 Target 3: 39,246
🔴 Stop: 36,052
📈 Risk/Reward Ratio: 2,79
I double-checked the levels and put together a clean, focused analysis just for you. Every single like seriously boosts my motivation to keep sharing 📈 Your support means the world to me! Huge thanks to everyone who likes and backs this work 💙 Our goals are crystal clear, our strategy is solid. Let’s keep moving forward with confidence and smart execution!

SellRejection Level
Daily Volume
Market Structure Shift
London Session
Trend Line Break
Untapped Order Point
Gold prices fall in the short term – What's next?Hello everyone, what’s your take on gold?
Today, gold continues to attract short-term selling pressure as USD buying momentum returns and expectations for Fed rate cuts diminish. On the other hand, an overall positive risk sentiment is also seen as another factor weighing on the precious metal.
At the time of writing, gold is trading around the EMA 34 and 89 near 3,336 USD. With no major updates expected, the market is likely to remain steady throughout the day.
From a technical perspective, the bearish trend persists, with prices capped below the trendline. A series of lower highs and lower lows could push XAUUSD to retest deeper levels, potentially reaching the 3,300 USD mark. However, lingering trade uncertainties may limit losses for this safe-haven asset.
This is just my view on the market, not financial advice.

XAUUSDDear traders,
In my previous analysis, I mentioned that gold could extend its short-term decline after being rejected from the range boundary. However, that bearish structure was quickly invalidated following a sharp upside move, signaling a potential trend reversal. If this momentum continues, I anticipate that price may soon reach the levels of 3,355 and 3,365.
Feel free to leave a comment if you have any thoughts to add. Good luck!

Gold Price Analysis July 17XAUUSD Analysis Today
The price has cleared the liquidity to the 3377 zone, then returned to trading within the triangle. The market is currently waiting for new momentum to determine the next trend.
✅ BUY Scenario
If the 3322-3323 zone continues to hold and there is a bearish rejection signal and confirmation of buying power, gold is expected to continue its uptrend towards the 3373 - 3400 zone.
❌ SELL Scenario
If the price breaks the 3321 support with clear selling pressure, it can extend the decline to 3285.
🔑 Key Level Today
Support: 3321 - 3323
Resistance: 3373 - 3400
💡 Strategy:
Watch the price reaction at the important support zone to decide the next action.
Gold Eyes 3365 – Breakout or Rejection?GOLD | Technical Outlook
Gold maintains bullish momentum as long as it trades above 3355, aiming to test the 3365 resistance level.
However, signs of rejection at 3365 may emerge, especially if the 4H candle closes below this level. In that case, expect a period of sideways consolidation between 3365 and 3342.
A confirmed 1H candle close above 3365 would signal bullish continuation toward 3373, with an extended target at 3395.
Key Levels:
• Pivot: 3355
• Resistance: 3365 / 3375 / 3395
• Support: 3342 / 3333
Outlook:
• Bullish above 3355
• Breakout above 3365 confirms further upside
• Rejection at 3365 may lead to short-term range-bound movement

DeGRAM | GOLD above the resistance level📊 Technical Analysis
● Bulls defended the channel base at 3 333, snapping the intraday falling wedge and reclaiming the broken trend-line; successive higher-lows since 17 Jul signal fresh upside momentum.
● A clean H1 close over the former pivot 3 355 flips the wedge crest into support and activates the measured-move target at the upper horizontal barrier 3 366, with the March swing cap 3 389 next.
💡 Fundamental Analysis
● Softer US jobless-claims trend and Fed speakers’ hints that “policy is restrictive enough” cooled two-year real yields, while PBoC’s June data showed net gold purchases for a fourth month—both underpinning spot demand.
✨ Summary
Long 3 345-3 355; hold above 3 355 targets 3 366 → 3 389. Bias void on an H1 close beneath 3 333.
-------------------
Share your opinion in the comments and support the idea with a like. Thanks for your support!

Gold Buying back every dip as expectedTechnical analysis: Interesting turn of events regarding the Short-term as Gold crossed the second Resistance (and is Trading #2 points above it currently) on the Hourly 4 chart and crossed aswell #6-session High’s, which may result as an traditional Buying back every dip (as I advice Traders to Buy every local Low’s recently / what I am doing personally), offering no Selling continuation patterns to Trade by. This is an additional Short-term Buying signal similar to cycle of February #2 - #5 #2020 parabolic rise, which ended as an correction. Hourly 4 chart is under much needed consolidation (current dip Buying) near #3,352.80 benchmark and is again leaning on Bullish side rather than Neutral, as Gold is still ignoring strong Overbought levels following mostly losses on DX (taking strong hits), turning as well Oversold in the process as global Geo-politics dust rises, and as long those guide the market sentiment, further uncertainty on Gold is inevitable and Buying underlying trend will persist.
My position: I repeat / keep in mind that Swing Trading is not possible currently on Gold as Scalp / in & out aggressive orders are key to make excellent Profits (I will advise when to continue with Swing orders). I have firstly Bought Gold on #3,324.80 throughout yesterday’s session and closed my set of Buying orders on #3,332.80 Resistance and since I knew news may push Gold down, had Buy limit on one of my possible reversal points of #3,307.80 / #3,310.80 / #3,313.80 which worked nicely. This was one of many brilliant weeks of Scalping the market. Keep in mind that #MA50 on Daily chart plays big role currently and whether Gold establishes it as an Support or Resistance, major trend will continue. I do believe it will be established as an Support and that’s why I maintain my #3,377.80 and #3,400.80 Medium-term Targets. Enjoy the Profits!

Palladium Fractal ReboundPalladium Quarterly Chart Analysis: Cycles, Technicals, and Outlook
Introduction
Palladium prices have undergone a dramatic collapse and partial recovery in recent years. From record highs in 2021–2022, the metal fell by over 60% (roughly a 63% drawdown at worst), echoing the severe crash witnessed during the 2008 global financial crisis. On a quarterly chart, this steep 63% drop closely mirrors the 66%–72% plunge palladium suffered in 2008.
The key question is whether a V-shaped rebound will follow, as it did post-2008, or if secular changes in the palladium market will alter the outcome. This report provides a deep analysis of the quarterly palladium chart, including fractal pattern comparisons, detailed technical analysis (support/resistance, Fibonacci levels, trendlines, candlestick behavior), an Elliott Wave interpretation, volume and volatility insights, fundamental drivers, and short-, medium-, and long-term outlooks with potential price targets. All analysis is grounded in historical data and current market context, highlighting the implications of the recent crash and prospects for recovery.
Fractal Analysis: Historical Cycles and Repeating Patterns
Figure 1: Quarterly chart of palladium (XPD/USD) highlighting two major crash-recovery cycles. The 2008–2011 cycle (left) saw a ~66% price collapse followed by a strong V-shaped rebound, while the 2021–2025 period (right) shows a similar ~63% plunge and nascent recovery. Both structures exhibit analogous steep declines and potential bottom formations, suggesting a possible repeating (fractal) pattern. In palladium’s history, sharp crashes have often been followed by equally sharp recoveries. The two most notable cycles – 2008–2011 and 2021–2025 – show striking similarities:
2008 Crash and Recovery: Palladium peaked around mid-2008 near $580/oz, then cratered to ~$164 by Q4 2008 (a drop of roughly 72%) amid the global financial crisis. This collapse was rapid (occurring within ~3 quarters) and marked by panic selling. However, it formed a V-bottom: by mid-2009, palladium had already rebounded ~157% off the lows to ~$420. The uptrend continued into 2010–2011, ultimately surpassing the pre-crash peak – palladium reached about $860/oz in early 2011, well above its 2008 high. In other words, the post-2008 rally not only filled the drop but overshot to new highs within ~3 years. This 2008–2011 cycle is a textbook V-shaped recovery after a crash.
2021–2025 Crash and Comparison: After a long bull run, palladium hit an all-time high in early 2022 (spot prices spiked to ~$3,440/oz in March 2022 amid the Russia-Ukraine war).
Prices then began an “implosive” downtrend. From the 2021/2022 peak to the 2023–2024 trough, palladium lost on the order of 60–70% of its value, comparable in magnitude to 2008’s collapse. For instance, palladium fell from ~$3,440 in March 2022 to around $1,348 by March 2023 (about –60%), and eventually traded below $1,000 in late 2023 (hitting ~$974 in Nov 2023, its lowest in 5+ years). On some measures the full peak-to-trough decline reached ~72–76% (similar to 2008’s 72% plunge). The chart above (Figure 1) highlights a ~63% drop, aligning with quarterly closing prices. Notably, this downturn was more protracted – unfolding over ~2 to 3 years (2022–2024) – whereas 2008’s crash was faster.
Despite differences in duration, the structural pattern is strikingly similar: a steep, almost relentless decline followed by signs of bottoming. In 2024–2025, palladium began stabilizing in the mid-$800s to low $1,000s – analogous to the $160–$200 base in 2009. By mid-2025, prices have bounced back above $1,300 roughly +50% from the ultimate lows, hinting at a potential V-shaped recovery in its early stages. This fractal resemblance to 2008–2011 suggests the possibility of history rhyming. If the pattern were to repeat, palladium could see a powerful multi-year rally ahead, potentially retracing a large portion of the drop and even challenging its prior highs. However, it is crucial to note differences as well. The 2008 crash was driven by a temporary collapse in demand (during the crisis) followed by resurgent industrial demand and constrained supply, which supported a sustained rebound. The 2021–2024 crash, in contrast, coincided with more structural shifts – including the rise of electric vehicles (EVs) and substitution by platinum – which may cap long-term upside. We examine these factors in depth later. Nonetheless, from a pure chart perspective, the recent 63% drop and initial rebound closely mirror the 2008 pattern, keeping alive the prospect that a similar recovery trajectory (albeit perhaps with lesser magnitude) could unfold. Table 1 below compares key metrics of the 2008–2011 and 2021–2025 palladium cycles:
Cycle (Crash → Recovery) Peak Price (Pre-Crash) Trough Price (Post-Crash) Decline (%) Time from Peak to Trough Recovery Outcome
2008–2011 (GFC Crash) ~$582/oz (Q2 2008)
~$164/oz (Q4 2008)
–72%
~3 quarters (2008) V-shaped rally; new high by 2011 (~$860/oz)
2021–2025 (Recent Crash) ~$3,440/oz (Q1 2022)
~$813/oz (Q3 2024)* –63% to –76% (various measures)
~8–10 quarters (2022–2024) In progress (2025 bounce ~+50% off lows so far; potential to retest highs if fractal holds)
*Note: ~$813 was an intraday low in 2024; quarterly closing lows were around $1,000. The fractal analysis underscores that palladium has recovered from massive crashes before – most dramatically after 2008 – and the current technical structure indeed rhymes with that historical template. Next, we delve into the technical indicators on the quarterly chart to assess whether this nascent recovery is technically supported, and to identify key levels and patterns for the road ahead.
Technical Analysis of the Quarterly Chart
Palladium’s quarterly chart provides a macro-level view of its technical landscape. The recent collapse and bounce can be analyzed through classic technical lenses: support and resistance zones, Fibonacci retracements, trendlines, and candlestick patterns. Below, we break down each aspect:
Support and Resistance Levels
Identifying major support and resistance levels on the long-term chart is crucial for understanding where palladium may find buying interest or encounter supply on rallies:
Multi-Year Support (~$800–$900): The $800–$900/oz zone emerged as a strong long-term support during the 2022–2024 decline. This area corresponds to the 2018 price floor (palladium last traded under $1,000 in 2018) and roughly the breakout point of the 2016–2019 rally. Indeed, palladium’s recent low of ~$974 in Nov 2023 (and briefly ~$813 in 2024) was the lowest price in over 5 years, indicating buyers stepped in aggressively at those multi-year lows. This zone also aligns with the upper $800s where palladium was trading in 2017–2018 before its exponential rise – suggesting a mean-reversion support. Going forward, as long as prices remain above the $800 area, the basing structure of a long-term bottom remains intact.
Intermediate Support (~$1,200): After the initial bounce in 2023–2024, the $1,200/oz level has acted as interim support turned resistance. It was around $1,269 in mid-2023 that palladium first found a floor (a four-year low at the time), and recent trading has oscillated around this level. Notably, in October 2024 palladium briefly spiked back to ~$1,200 on news of potential stricter Russian metal sanctions, underscoring $1,200 as a sentiment pivot – it is roughly where bearish momentum paused and short-covering rallies began. This level may continue to serve as a pivot in the near term.
Psychological $1,500: Around $1,450–$1,500 lies another key level. This was approximately the price palladium recovered to in mid-2023 after its first leg down. Technically, $1,500 is a round number and roughly coincides with minor highs during the 2022 downtrend (for example, a relief rally peaked near $1,470 in early 2023). It is also near the 2019 price high (~$1,600). We can expect this zone to act as resistance on initial attempts to rally (as it represents the top of the 2022–2023 consolidation range). A quarterly close above $1,500 would be an early sign that the recovery is gaining traction beyond just a short squeeze.
Major Resistance (~$1,800–$2,000): The band between $1,800 and $2,000 per ounce represents a significant resistance region. $1,800 is approximately the 38.2% Fibonacci retracement of the entire 2022 crash (see below) and also a level of prior congestion in 2020–2021. Meanwhile, $1,900–$2,000 was a support shelf during 2021 (when palladium pulled back from its first peak near $2,800, it found support around $1,950). In technical terms, broken support becomes resistance, so the $1,800–$2,000 zone will likely be a formidable barrier on the way up. A sustained move above $2,000 would signal that palladium is retracing a large portion of its decline and could open the door to higher Fibonacci targets.
Upper Resistance (~$2,400–$2,800): This wide zone encompasses palladium’s pre-crash peak levels. About $2,400 corresponds to the 61.8% retracement of the 2022–2024 drop (depending on the exact high/low reference) and was roughly the price before the Ukraine-invasion spike (palladium was trading in the mid-$2,000s in early 2022 before spiking). The $2,800 level was the 2021 all-time high (pre-war) and a major psychological milestone. If palladium’s recovery is strong enough to approach this range, $2,400–$2,800 will act as a critical resistance band where traders who endured the crash may look to take profits. It is also where substitution pressures intensify (as $2,500+ palladium makes platinum very attractive). Breaking decisively above $2,800 would imply a full round-trip to the old highs – an outcome dependent on extraordinary bullish drivers given current fundamentals.
All-Time High and Beyond ($3,000+): The record high of ~$3,440 in March 2022 (spot market) is the ultimate resistance. Any approach to $3k+ would likely encounter heavy resistance unless fundamentals dramatically shift (e.g. a sudden supply crisis). It’s worth noting that in 2008’s fractal, palladium not only reached its old high but exceeded it by ~50% in 2011. Should a similar overshoot happen, potential extension targets could lie in the mid-$4,000s (discussed under Fibonacci projections). For now, however, $3,000–$3,400 remains a distant long-term barrier.
In summary, palladium has support firmly established near ~$800–$900 and a series of rising resistance levels at ~$1,500, ~$1,800–$2,000, ~$2,400–$2,800, and the all-time high region. These levels provide a roadmap for the recovery: clearing each would mark significant progress in repairing the technical damage of the crash.
Fibonacci Retracements and Extension Targets
The massive swing from palladium’s peak to trough provides a useful framework for Fibonacci analysis. Key Fibonacci retracement levels of the 2022–2024 decline highlight probable resistance points for the rebound, while extension symmetry can suggest upside targets if the recovery mirrors the prior drop:
Fib Retracement Levels: Taking the war-induced high of ~$3,440 in March 2022 and the trough around ~$813 in 2024 as the range (Δ ≈ $2,600), we compute standard retracements:
38.2% retracement ≈ $1,800/oz. This is often the first major retracement in a recovery. Indeed, ~$1,800 aligns with prior technical levels as noted. Palladium’s bounce has not yet reached this, implying room for further upside if the rebound continues.
50% retracement ≈ $2,100/oz. A 50% mean-reversion of the drop would bring prices back to about $2,100. This level is near a tround number and where the downtrend accelerated in 2022. It could act as an interim target if $1,800 is cleared.
61.8% retracement ≈ $2,400–$2,500/oz. This is the classic golden ratio retracement. Hitting this would mean palladium regained almost two-thirds of its lost value. Notably, ~$2,400 corresponds to palladium’s price just before the Ukraine war spike, effectively erasing the crash and war premium. This could be a natural bull case target over the medium term if demand-supply surprises to the upside.
100% retracement = $3,440/oz (a full return to the peak). This scenario, while perhaps optimistic under current fundamentals, cannot be dismissed – especially considering palladium did something analogous after 2008 (returning to and exceeding its prior high in a few years). A full retracement would likely require a significant tightening of the market (or speculative surge).
Measured Moves & Symmetry: If we treat the 2022–2024 drop as one “leg” of a price swing, a symmetrical move upward of equal magnitude can be projected from the low. This concept, sometimes called an AB=CD measured move, would add the ~$2,600 drop to the $813 low, yielding a target around $3,400–$3,500 (essentially the prior high). In effect, achieving the measured move would mean a complete V-shaped recovery (a mirror image of the fall). In the 2008 fractal, palladium did more than an AB=CD – it exceeded the measured move. If palladium were to replicate that kind of overshoot, one could look at Fibonacci extensions beyond 100%. For instance:
1.272× extension of the drop would target around $4,200/oz.
1.618× extension (the classic “golden extension”) projects up near $5,000/oz.
These higher extensions represent a very bullish case – potentially achievable only if extraordinary catalysts (e.g. a major supply shock or booming demand) emerge. They are mentioned here for completeness, given the question of symmetry and the fact that the 2009–2011 rally did propel prices well past the old high. Realistically, a conservative recovery scenario might expect palladium to retrace on the order of 50–62% of its decline (roughly into the $2,000–$2,500 zone) if market conditions improve. In summary, Fibonacci analysis indicates that $1,800, $2,100, and $2,400 are the key fib-derived resistance zones ahead, with $3,400+ as the full retracement point. The notion of Fibonacci symmetry suggests that the current upswing could aim for an amplitude comparable to the prior drop (~$2,600), implying an ultimate target back near the highs – though this is an optimistic scenario. Traders will be monitoring these fib levels for signs of hesitation or acceleration as palladium’s recovery unfolds.
Trendlines and Chart Patterns
Trendlines on the quarterly chart shed light on the long-term trend shifts and potential breakout points:
Downtrend Line (2021–2023): Palladium’s peak in 2021–2022 was followed by a series of lower highs. If one draws a trendline connecting the major rally peak (Q1 2022) and subsequent lower highs (for example, interim highs in late 2022 around ~$2,300 and early 2023 near ~$1,700), we get a descending trendline defining the crash. This long-term downtrend line has been pressuring prices lower throughout 2022 and 2023. The recent rebound now approaches this trendline from below. A breakout above the downtrend line – likely requiring a quarterly close above roughly the $1,500-$1,600 area (depending on the exact points used) – would be a significant technical event, signaling that the bearish trend has been broken. It would suggest the momentum has shifted from down to up on a multi-year timeframe. Traders will watch for this trendline break as a confirmation of the V-shaped recovery hypothesis.
Long-Term Uptrend Lines: Palladium had a multi-year uptrend from 2009 through 2021. One uptrend line can be drawn from the 2008–2009 bottom, connecting troughs in 2016 and 2018. This line was very steep by 2021 and ultimately gave way when the crash began. It doesn’t provide support now (having been broken), but interestingly, extended trendlines from past cycles sometimes turn into resistance on the way back up. A less steep trendline can also be drawn from the 2016 low through the 2018 pullback low – that line was also broken during 2022’s collapse. These broken uptrend lines currently lie above the market; if palladium rallies significantly (into the $2,000s), these historical trend boundaries might coincide with the Fibonacci targets, potentially acting as technical convergence points where old support-turned-resistance appears.
Chart Patterns: On a quarterly candlestick chart, fine-grained patterns (like head-and-shoulders or small wedges) are less apparent due to the long timeframe. However, one pattern visible is a kind of “rounded top” in 2021–2022 followed by a vertical collapse, and now potentially a rounded bottoming in 2023–2024. The rounded nature of the recent low (multiple quarters spent basing in the $1,000 area) suggests a bottoming pattern rather than a mere spike low. This could be interpreted as a large-scale basing formation. If looking at a line chart of quarterly closes, palladium’s line might resemble a giant “U” shape or bowl forming at the bottom. This gradual turn often precedes a sustained uptrend if confirmed by higher highs ahead.
Potential “Measured Move” Pattern: If palladium’s Q2 2025 rally continues, we might identify an A-B-C upward pattern – essentially the inverse of the A-B-C downtrend it likely had from 2022–2024. For instance, a leg up from ~$813 to ~$1,350 (current), then a mild pullback (maybe back toward $1,100), followed by another rally leg of similar length as the first, could form a bullish measured-move pattern targeting the $1,800s. This is speculative, but worth monitoring as the recovery progresses.
In summary, trendline analysis suggests that palladium is on the cusp of negating its long-term downtrend, pending a breakout above resistance. The presence of a broad bottoming formation adds credence to the idea that the worst may be over. Breaking the primary downtrend line and forming higher highs/lows would confirm a new bullish phase. Until then, caution is warranted as the downtrend is technically intact, but increasingly weak.
Candlestick Behavior on the Quarterly Chart
Each candlestick on the quarterly chart represents a 3-month period, and their shapes can reveal shifts in market sentiment:
2008–2009 Reversal Candles: Looking back, the Q4 2008 candle was likely a long-tailed hammer – palladium plunged intra-quarter to $164 but then bounced, so by quarter-end the price had recovered well off the lows (the closing price was much higher than the low). This kind of long lower wick indicates capitulation and subsequent buying. The very next candle, Q1 2009, was a strong bullish candle (palladium rose that quarter), confirming the reversal. By Q2 and Q3 2009, consecutive green candles with expanding ranges showed accelerating upside momentum. This sequence (hammer -> large bull candle -> follow-through) was the signature of the V-bottom in that cycle.
2023–2024 Bottoming Candles: A similar candlestick pattern appears to be forming at the recent bottom. For instance, Q4 2022 and Q1 2023 were huge red (down) candles – reflecting the brunt of the collapse. But by Q2 and Q3 2023, the downward range narrowed and wicks became longer, suggesting diminishing selling pressure and attempts by buyers to defend prices. Q4 2023 likely produced a doji or small-bodied candle around the lows (indeed palladium “probed” below $1,000 in that quarter but did not continue free-falling). This stalling of the downtrend was a first clue of a base. Then Q1 2024 saw a modest gain (a small green candle), and Q2 2024 perhaps a retest of lows (possibly another doji). By Q3–Q4 2024 and Q1 2025, we start to see larger bullish candles forming as the price lifts off the base. For example, palladium saw a short-term spike to $1,200 in late 2024 and by mid-2025 is around $1,300 – these translate to green quarterly candles indicating a trend change.
Bullish Engulfing & Key Reversals: It’s worth checking if any quarter marked a bullish engulfing pattern – where a green candle’s body fully covers the previous red candle’s range. A candidate could be Q4 2024 or Q1 2025 engulfing the prior quarter, which would be a strong bullish signal on this timeframe. Even absent a textbook engulfing, the cluster of small candles at the bottom followed by a larger up candle is effectively a three-candle Morning Star formation (a reversal pattern) on quarterly scale.
Candlestick Size and Volatility: The quarterly candlesticks from 2020–2022 were enormous (due to wild price swings, especially the COVID crash and the 2022 spike). The fact that candles in 2023 became smaller reflects how palladium’s volatility compressed as it bottomed – a common sign of consolidation. Now in 2024–2025, ranges are expanding again to the upside, which reflects a return of volatility in favor of bulls (large range up bars). This transition from giant bearish candles, to indecisive small candles, to large bullish candles is exactly what one expects as a market turns from down to up.
In essence, the candlestick behavior on the quarterly chart corroborates a major trend reversal: first, selling exhausted (long lower wicks and small bodies at the lows), and now buying is asserting itself (larger solid green bodies). This aligns with the fractal observation and other technical evidence of a bottom.
Elliott Wave Interpretation
Given palladium’s long price history and recent fluctuations, we can attempt an Elliott Wave interpretation to contextualize the current cycle. Elliott Wave Theory posits that markets move in identifiable waves (impulses and corrections) on various degrees. While subjective, one plausible count for palladium’s secular trend since the 2000s is as follows:
Wave (I) – Palladium’s early 2000s mania could be labeled as a supercycle Wave I. Prices spiked to ~$1,100 in 2001 (a record at the time) amid a supply panic, then collapsed. However, that entire boom-bust (1990s–2003) might be considered a prior cycle. For the current long-term cycle, it’s more coherent to start Wave I from the 2008–2009 low. From the $160 area in 2008, palladium rose in five distinct waves up to 2011 (peaking ~$860). That rally can be seen as Cycle Wave I of the new bull market.
Wave (II) – The period from 2011 to 2016 represents a prolonged corrective Wave II. Palladium did not crash after 2011, but it ground lower in a complex correction: from $860 in 2011 down to ~$450 by early 2016. This ~5-year decline could be counted as an A-B-C zigzag or even a triangle (there were multiple oscillations in the $500–$800 range through 2012–2015). Regardless of the exact sub-count, the essence is that Wave II was a deep and drawn-out correction that digested the gains of Wave I. Notably, it retraced nearly 80% of Wave I (down to $450 from $860), reflecting alternation in depth versus what would follow.
Wave (III) – Starting in 2016, palladium embarked on a massive impulsive Wave III. This wave carried prices from the $450 low to the astonishing $3,380 high in March 2022. Within this Wave III, one can count smaller-degree waves: e.g.,
Minor 1: 2016 to early 2018 (palladium ~tripled to $1,100 by Jan 2018),
Minor 2: pullback in 2018 (~20% drop mid-2018),
Minor 3: 2018 to early 2020 (price ran to ~$2,800 by Feb 2020, a powerful extension),
Minor 4: the brief Covid crash in 2020 (down to ~$1,600),
Minor 5: 2020 to 2022 blow-off (from $1,600 trough to $3,380 peak, including the war spike). This extended fifth minor wave (if we count it as such) concluded the larger Wave III. The entire move from 2016 to 2022 had a clear impulsive character with only relatively shallow corrections until the very end.
Wave (IV) – The collapse from 2022 into 2023/2024 is characteristic of a Wave IV correction. Typically, Wave IV follows an extended Wave III, often retracing quite deeply but not breaching the territory of Wave I (which in this case ended at $860 in 2011). Indeed, palladium’s drop, though extreme, bottomed in the $800s – just above the top of Wave I (which was ~$860). This satisfies the Elliott guideline that wave 4 corrections usually do not overlap wave 1 highs in a proper impulse (for commodities, overlaps can happen but it’s a noteworthy observation). Moreover, there is a guideline of alternation: Wave II was long and grinding, so Wave IV might be sharp and brief – and it was relatively swift and vertical (2–3 years vs. 5 years for Wave II). Wave IV appears to have taken a zigzag (A–B–C) form: A from $3,380 to ~$1,800 by mid-2022, B as a bear-market rally to ~$2,300 (late 2022), and C as the final capitulation to ~$813 in 2024. The C-wave was extended and panic-driven (typical of C in commodities). If this count is correct, Wave IV completed with the 2024 low.
Wave (V) – Palladium may now be at the onset of Wave V, the final impulse of this long-term cycle. Wave V would, in theory, aim to carry prices above the Wave III high ($3,380) or at least form a significant multi-year rally. However, Wave V in commodities is sometimes weaker or shorter than Wave III, especially if fundamental narrative has shifted. It could also form a truncated fifth (failing to exceed the prior peak) if the secular bull is running out of steam due to EV substitution, etc. At minimum, Wave V should carry palladium in a motive fashion upward for several quarters or years. If we were to speculate: a potential Wave V could take palladium back toward $2,500–$3,000 (the lower end of prior highs) under a modest scenario, or beyond $3,400 to new highs under a bullish scenario. The Elliott pattern would be invalidated if palladium were to break below the 2024 lows (as that would imply Wave IV continues or a different structure). As of now, the development of a clear five-wave advance on a smaller scale (e.g., a smaller degree i-ii-iii-iv-v forming off the $813 low) would confirm a Wave V is in progress.
In summary, an Elliott Wave reading suggests that palladium’s 2022–2024 crash was a major corrective wave in a long-term bull market. If that correction (Wave IV) is complete, a final upward Wave V may now be unfolding. This aligns with the fractal notion of a strong rebound, but Elliott theory also injects a note of caution: Wave V might underperform Wave III given fundamental headwinds, and once Wave V completes, a much larger bearish phase could ensue. For now, the focus is on how high this prospective Wave V can travel. Key confirmation would come from palladium generating a smaller five-wave rise and taking out intermediate highs (such as $1,500 and $2,000). That would bolster confidence in the Elliott outlook for a continued rally.
Volume and Volatility Insights
Palladium is known for high volatility and periodic liquidity-driven spikes, and the recent cycle has been no exception. Analyzing volume and volatility trends provides insight into market dynamics and the character of the recent move:
Volatility Regime: Palladium’s price volatility spiked to extraordinary levels in 2020–2022. The 20-year historical chart shows that the move to $3,380 in March 2022 was “explosive”– an indication of extreme volatility as the market reacted to war-driven supply fears. Implied volatility (not explicitly given here, but evidenced by the rapid price swings) likely hit record highs during that period. The subsequent implosion (drop to sub-$1,000) likewise saw huge quarterly price ranges (e.g., prices halved in a matter of months). However, as the price neared a bottom in 2023, volatility measures began to subside – the trading range compressed (as noted in candlesticks discussion) and the pace of decline slowed. This often signifies a volatility trough associated with capitulation and the exhaustion of one side of the market (sellers, in this case). Now, in 2024–2025, volatility is picking up again, but with an upward bias – a classic hallmark of a trend change. We see multi-month swings of +20-30% off the lows, indicating that palladium can still make large moves in short spans. Investors should be prepared for a bumpy ride: even within a recovery, palladium’s volatility (historically higher than gold or platinum) means swings will be substantial.
Trading Volume and Open Interest: While we don’t have direct volume figures in this text, there are clues from positioning data. Speculative positioning on NYMEX palladium turned net bearish as prices fell. By early 2023, many speculators were holding short positions, expecting further declines. This buildup of shorts can actually be viewed as pent-up buying power if a reversal triggers short-covering. Indeed, the CME/WPIC report noted that as palladium’s fall was widely anticipated (due to surplus forecasts), investors amassed net short positions, “leaving it vulnerable to short-covering rallies”. This suggests that volume spikes on up-moves could be fueled by shorts buying to cover. In late 2023 and early 2024, there have already been at least two short-squeeze events where palladium saw sharp jumps as shorts were forced out. These likely correspond to the quick rally to $1,200 in Oct 2024 and possibly another surge in early 2025. Each short squeeze is accompanied by heavy trading volume and increased futures open interest temporarily. Such action often marks the start of a trend change as market participation shifts from sellers to aggressive buyers.
Capitulation Volume: Looking back at the bottom, anecdotal evidence suggests that in mid-2023 when palladium first plunged under $1,300 (down 60% from the high), there may have been a capitulatory flush – large volume selling by funds or producers. The fact that price accelerated into the $1,000 region implies stop-loss and forced selling volume hit the market. Typically, major bottoms see peak volume as the last holders panic out. While not directly cited, it's reasonable to infer that volumes on palladium exchanges were elevated during the sell-off into late 2022 and again in Q1 2023 (as indicated by Reuters describing the drop and bearish sentiment). After that, volumes likely thinned at the actual bottom (late 2023), as conviction was low and many had exited – another reason volatility dropped at the lows.
Volume on Recovery: As the price is rebounding in 2024–2025, one would want to see rising volume on up quarters as confirmation of genuine demand. The presence of short squeezes suggests some of this volume is short-covering rather than fresh longs. However, open interest data shows managed money still largely short palladium, which paradoxically means the rally could have further fuel if those shorts capitulate. In contrast, platinum’s positions have been more balanced. The skew in palladium positioning reflects how bearish consensus became (due to EVs, etc.), which sets the stage for contrarian moves when reality is not as bearish as expected.
Market Liquidity: Palladium is a smaller market (annual mine supply ~6-7 million ounces) and can be prone to liquidity issues. In 2020, we saw liquidity dry up (wide spreads) during the COVID crash, and in 2022 some dealers briefly suspended quoting due to extreme conditions. Such liquidity crunches amplify volatility. Going forward, if palladium rallies, liquidity could again become an issue if producers are hesitant to forward sell or if financial players rush in (either chasing momentum or covering shorts). That can cause outsized price moves in short timeframes (both up and down).
In summary, volume and volatility patterns align with a market that has flushed out bullish speculation (during the crash) and is now in the process of flushing out the shorts. The environment is volatile: two-way swings will be large, but volatility is now working in favor of an upside trend. Traders should expect continued high volatility – as the saying goes for palladium, it “tends to move far more violently than other precious metals”. Proper risk management is crucial, but so is recognizing that big volatility can mean big opportunity, especially when a market transitions from deeply oversold conditions.
Fundamental Context and Drivers
While technicals tell us what price is doing, fundamentals help explain why. Palladium’s market is influenced by a unique set of supply-demand factors, geopolitical elements, mining dynamics, and macroeconomic trends. Understanding these provides context for the recent crash and the prospects of a recovery. Below we discuss the key fundamental themes:
Supply and Demand Dynamics
Demand Side (Auto Industry Dominance): Palladium’s demand is overwhelmingly tied to the automotive sector. Around 80–90% of palladium demand comes from catalytic converters in gasoline vehicles. Stricter emission standards in the 2010s meant carmakers had to load more palladium into each catalyst, fueling a surge in demand and contributing to the 2016–2020 price rally. However, palladium’s very success sowed seeds of its decline: its price rocketed so high (nearly 5x from 2016 to 2022) that automakers began actively substituting platinum in place of palladium for some applications. Starting around 2019, this thrifting and substitution trend took off, with hundreds of thousands of ounces of palladium demand being replaced by platinum each year. Even as palladium prices have now fallen near parity with platinum, substitution is expected to continue (and even persist until 2026) due to multi-year design cycles in the auto industry. In addition, the rise of electric vehicles (EVs) is a structural demand headwind. EVs do not use palladium at all (no exhaust to treat). EV market share, while still modest, is climbing each year. In 2023 EVs were ~7% of light vehicle sales, expected to reach ~13% in 2024 and ~16.7% in 2025. Every percentage point gained by EVs is a percentage point lost for internal combustion engine (ICE) vehicles – which translates to lower palladium demand. Hybrid vehicles still use palladium (and even more per car in some cases), so the transition is gradual; however, the long-term trajectory is clear. Analysts estimate auto palladium demand will fall by ~400,000 oz between 2022 and 2027 as a result of EV adoption and substitution. This is significant in a ~10–11 million oz/year total demand market. That said, in the short term (2023–2024), auto production was actually recovering from the pandemic and chip shortage slump. Global light vehicle production jumped ~10% in 2023 as supply-chain issues eased. This has helped palladium demand somewhat in the immediate term (more cars made = more catalytic converters). Indeed, RBC in early 2023 noted that “rising vehicle production should limit any sell-off” and expected palladium demand to pick up as auto manufacturing activity recovered. The Reuters poll then projected small market deficits in 2023 and 2024 (588k oz in 2023, 183k in 2024) even with EVs, due to that production uptick. However, beyond 2024, the consensus is that palladium demand will stagnate or decline gradually, given the structural trends. For example, tighter emission standards (Euro 7) that would have increased PGM loadings have been delayed to 2031, removing a near-term demand boost. In summary, palladium’s demand enjoyed a golden era (tightening emissions and lack of alternatives), but is now facing a gradual erosion from EVs and substitution. Short-term rebounds in auto output can create temporary demand boosts, but the medium- to long-term outlook is for weaker demand growth or outright declines in automotive palladium use. Supply Side (Mine and Recycling): On the supply front, palladium comes primarily as a byproduct of platinum and nickel mining, with Russia and South Africa dominating global output. In 2022, Russia produced ~88 tonnes (~2.8 million oz, ~42% of world supply) and South Africa ~80 tonnes (~38%). Thus, between them ~80% of palladium mine supply is concentrated in two regions. This concentration made palladium highly vulnerable to geopolitical or operational disruptions – a fact that contributed to the huge rally when Russia invaded Ukraine (fear of losing Russian supply). However, despite the war, Russian palladium continued to flow, and no Western sanctions have directly targeted palladium exports as of 2023/24 (although the US considered stricter precious metals sanctions at times). In early 2023, Russia’s Norilsk Nickel did warn of an 8–14% drop in its palladium output for the year (due to maintenance delays and sanctions affecting operations). This kind of supply hiccup can tighten the market temporarily, as noted by analysts
. Meanwhile, South African supply has its own issues: power outages (load-shedding) have hampered mining, and labor strikes (like the major 5-month strike in 2014) can remove a big chunk of supply. In 2014, for instance, a prolonged strike cut South Africa’s palladium output by 60%, causing a price spike. Beyond mines, recycling is a growing source of palladium. As more old cars are scrapped, their catalytic converters are recycled for PGMs. Recycling now contributes roughly ~30% of total palladium supply. It is expected to increase substantially: Morgan Stanley projected **recycled supply will increase by 1.2 Moz from 2022 to 2027, and WPIC forecasts ~+1 Moz per year coming from recycling in the near term. By 2025, recycling plus steady mine output is likely to push the palladium market into surplus. Indeed, multiple sources predict a surplus starting mid-decade: the Investing News Network notes an oversupply of ~897,000 oz by 2025, and Reuters’ polling found consensus that by 2025 palladium flips from deficit to surplus. This anticipated surge in supply (via recycling and normalizing mines) is a core reason behind the bearish outlook that drove prices down. Importantly, these are forecasts – any number of things could alter the supply picture. For example, the WPIC commentary cautioned that if recycling under-delivers (due to logistical or technological challenges), the expected surplus might not materialize and the market could stay balanced or in deficit a bit longer. Also, any new geopolitical flare-up (e.g., sanctions on Russian palladium or internal issues in Russia) could suddenly remove a chunk of supply and swing the market back to deficit, at least briefly. Thus, while the base case is rising supply, there remain upside supply risks that could surprise the market. In summary, palladium supply is transitioning from a period of chronic deficit (pre-2022) to one of potential surplus (post-2024). High prices in the last decade incentivized more recycling and also drew down secretive stockpiles (Russia had state reserves that it sold into the market in the 2010s – those sales have dwindled, meaning less hidden supply now). So the supply picture is one of near-term tightness possibly giving way to long-term abundance. Balancing it out: The interplay of demand and supply indicates that through 2024, the market has been roughly balanced or in slight deficit, which prevented an even worse price collapse (indeed RBC noted current supplies were inadequate to meet demand, supporting a price bounce off the lows). But from 2025 onward, a sizable surplus is expected if EV and substitution trends continue and recycling ramps up. This fundamental shift is largely why many analysts see palladium in a secular downtrend despite any short-term technical rallies. For instance, Macquarie Group projected palladium prices would “come down gradually every year” as the one-trick demand pony loses steam, and predicted an average price of just ~$1,150 by 2027. The recent price collapse of ~60-70% has already priced in a lot of this shift, but further erosion is possible if surplus grows.
Geopolitical and Industry Factors
Palladium’s fortunes are tightly linked to geopolitical developments and industry-specific factors:
Russian Supply & Sanctions: As noted, Russia is the top palladium producer (~40% of mine supply). Historically, Russia’s influence has been huge – in the late 1990s, rumors of Russia halting palladium exports caused prices to spike (the early 2000s bubble). In 2022, the invasion of Ukraine initially sent palladium to record highs above $3,000, on fears that sanctions or the conflict would cut off Russian metal. Those fears eased when Russian exports continued, but uncertainty remains as long as the war continues. Were Western governments to ban Russian PGM imports (a step not yet taken, partly to avoid harming auto industries), palladium could see another price spike due to sudden supply crunch. Conversely, any resolution of the war or easing of tensions might remove the risk premium entirely. So far, the market seems to be assuming Russia will keep selling palladium (often via Switzerland or China routes) – hence the price has fallen. But this is a wild card: geopolitical risk premium can return abruptly if the situation changes.
South African Reliability: South Africa’s PGM industry faces chronic issues: power supply (Eskom’s rolling blackouts) and labor unrest. In early 2023 and 2024, severe electricity shortages limited mine output, which could tighten PGM supply (especially platinum, but palladium as well). Mines have had to invest in self-generation or cut production. Additionally, any major strikes similar to 2014 would remove supply and support prices. The catch is, in a surplus environment, small disruptions may not swing the market as much. But if multiple disruptions coincide (e.g., Norilsk issues plus SA issues), the supply picture could tighten unexpectedly, aiding a price recovery.
Industry Stockpiles and Inventories: One often overlooked factor is inventory. During the deficit years, end-users and investors built some stockpiles of palladium. For instance, when palladium soared, some automakers shifted to holding extra inventory of platinum instead (anticipating substitution), and some investors/speculators held palladium in ETFs (though many liquidated during the fall). The WPIC noted that despite nominal deficits in 2023–24, “above-ground stocks” were likely sufficient to balance the market at current prices, meaning there is a buffer of material that can be drawn down. This has probably muted price volatility on the upside – the presence of inventories acted as a cushion. If the market does tighten, the question is how quickly those stockpiles deplete. Conversely, if demand keeps falling, those inventories might remain ample. This dynamic influences how fast any rebound can go – a sudden supply shock might first be met by inventory releases (softening the blow) unless the shock is very large.
Mining Industry Dynamics: Since palladium is often a byproduct, primary palladium mines are few (the notable being Norilsk’s operations in Russia and Sibanye-Stillwater’s mines in Montana). Investment in new palladium capacity is limited; however, high palladium prices earlier did encourage expansions in related metals (platinum mines can tweak output towards more palladium if economics favor it). Now with prices down, miners might scale back marginal production, which ironically could prevent oversupply from growing too fast. For example, some North American palladium projects or recycling operations could become less profitable at <$1,500 prices, potentially throttling their output. Additionally, any environmental or regulatory changes in Russia or SA could impact mining. For now, the mining industry expects steady output – Norilsk’s maintenance aside – with no big new mines on the immediate horizon (meaning no sudden flood of new primary supply, just incremental changes).
Recycling Industry: The recycling side is also an industry factor – the ability to collect and process spent autocatalysts efficiently. The growth of recycling is forecasted but not guaranteed; it depends on scrappage rates and technological capacity. If palladium prices remain relatively low, it could slightly disincentivize recycling efforts (less profit per converter), although environmental regulation will keep recycling going. The WPIC flagged challenges in the recycling industry that could slow the supply increase. If recycling falls short, the expected surplus might be smaller, which would be a bullish factor relative to current expectations.
In essence, geopolitics and industry factors add uncertainty to the otherwise bearish fundamental outlook. They create scenarios where palladium could defy the oversupply narrative: e.g., a sanction-induced supply shock, a strike in SA, or slower-than-expected recycling. These are hard to predict, but they form the fundamental upside risks that could catalyze the kind of V-shaped move technicals are hinting at.
Macroeconomic Factors
Wider macroeconomic conditions also influence palladium, albeit indirectly since it’s chiefly an industrial metal:
Global Economic Growth: Palladium demand is tied to car production, which in turn is linked to global economic health. A strong economy generally means higher auto sales (especially in emerging markets where emissions standards are rising), boosting palladium use. Conversely, recessions lead to auto sales slumps – e.g., 2008–2009 saw auto demand crash, which killed palladium demand temporarily. The 2020 COVID recession similarly hammered auto production (though supply-chain issues were the bigger factor). As of 2023–2024, central banks have been raising interest rates to combat inflation, which could slow economic growth and car sales. Indeed, analysts expect a deceleration in car sales growth in late 2024 and 2025 due to higher interest rates and waning post-Covid pent-up demand. High interest rates make car loans costlier and can dampen vehicle demand, which would weigh on palladium. If a global recession were to occur in 2024–2025, palladium’s recovery could stall due to slack auto sales. On the other hand, if the economy proves resilient or if China’s car demand surprises to the upside, that could support palladium consumption.
Inflation and Monetary Policy: Palladium, unlike gold, is not typically a monetary inflation hedge (its investment demand is small). In fact, high inflation prompted aggressive Fed rate hikes in 2022–23, which strengthened the US dollar and raised borrowing costs. This had a twofold effect: it hurt commodities broadly (as dollar strength often pressures commodity prices) and it specifically hurt non-yielding assets like precious metals by increasing the opportunity cost of holding them. Platinum and palladium, despite being industrial, still have a precious metal aspect and saw reduced investment flows as rates rose. Now, if inflation comes down and rate hikes pause, that headwind might lessen. However, palladium’s price is more sensitive to industrial drivers than to investor sentiment (unlike gold). So macro policy matters mainly in how it affects industrial activity and auto financing.
Exchange Rates: A strong U.S. dollar in 2022 made commodities priced in dollars more expensive for other currency users, potentially curbing some demand. If the dollar weakens (for example, if U.S. rates peak and other economies catch up), it could provide a modest boost to commodity prices including palladium. Many palladium end-users are in Europe, China, and other countries – a weaker dollar could ease costs for them and support demand.
Commodity Cycles: Palladium also can be influenced by the broad commodity cycle. From 2016 to 2020 there was a broad upswing in many commodities (oil, base metals, etc.), which coincided with palladium’s bull run. In late 2021–2022, as the Fed tightened, many commodities entered bear markets. If commodities as a whole enter another bull phase (often driven by global liquidity or growth cycles), palladium could ride that tide to some extent. For instance, any large stimulus in China targeting auto or infrastructure could indirectly help. That said, palladium’s specific fundamentals often override general trends (it can diverge from gold/platinum at times due to its unique supply issues).
Interest in Green Technologies: Palladium is not a major player in the green energy transition beyond catalytic converters (which are more about pollution control). Platinum is more central to hydrogen fuel cells. However, any policies affecting combustion engines (e.g., faster EV adoption mandates or conversely incentives to keep ICE clean) will impact palladium. The EU’s delay of Euro 7 standards (to 2031) we mentioned is one such macro-policy factor that effectively reduces near-term palladium demand by not forcing extra catalyst loading. On the flip side, if governments slow the EV rollout (say by removing subsidies, as the prospective US administration changes in 2025 might consider), that could prolong palladium’s relevance. For instance, a proposed elimination of EV subsidies in the US could keep more gasoline vehicles in the mix, indirectly supporting palladium demand. Such policy changes are macro-level uncertainties that can swing the outlook.
In summary, macroeconomic factors add another layer: Right now they present more headwinds (higher rates, potential slowdown) than tailwinds, which aligns with palladium’s price weakness. A key macro question is whether the global economy will experience a downturn that curbs industrial commodities further, or a soft landing that allows demand to stabilize. Palladium’s technical V-shape recovery would be bolstered by an economic soft landing (or re-acceleration) that keeps car sales growing modestly. A recession, however, could interrupt the recovery with another demand dip. Overall, fundamental context explains the 63% price drop as a rational correction to a changing supply-demand paradigm: after years of deficits and ever-higher demand, palladium is moving into a surplus era with weakening demand. This drove the bearish sentiment and the collapse in price from 2021–2023. Yet, fundamentals also highlight that the transition is gradual, not overnight – there are interim deficits, supply risks, and legacy ICE demand that can still surprise. Thus, while the long-run fundamentals are bearish relative to the peak, the current price may have overshot to the downside, setting the stage for a recovery rally (as technicals suggest), even if that rally eventually runs into the reality of EVs. Next, we incorporate these insights into concrete outlooks for the short, medium, and long term.
Outlook and Price Projections
Bringing together the technical analysis, historical cycle comparisons, and fundamental drivers, we now outline the short-term, medium-term, and long-term outlooks for palladium, including potential price targets under various scenarios. We will also address specifically whether the current structure is likely to fully mirror the 2008–2011 cycle (V-shaped rebound to new highs) or diverge.
Short-Term Outlook (Next 6–12 Months)
In the short term, the bias for palladium appears mildly bullish as it comes off deeply oversold levels. The recent price action – up roughly 30–50% from the lows – suggests positive momentum that could carry forward a bit longer:
Technical Momentum: Palladium has started forming higher highs and higher lows on lower-timeframe charts, and if it breaks the aforementioned downtrend line (likely in the $1,500–$1,600 area), a swift move to initial fib targets around $1,800 could occur. Short-term, this $1,700–$1,800 level is a reasonable target for the next 1–2 quarters, as it represents the first significant Fibonacci retracement (38.2%) and a prior congestion zone. Traders who bought near the lows may look to take profit there, so it could cap the rally in the immediate term. But if momentum is strong, palladium could even test the $2,000 mark within a year – particularly if a catalyst emerges (e.g., a supply disruption or surprisingly robust auto demand).
Catalysts in Play: One potential short-term catalyst is short-covering. As discussed, speculators are net short palladium. Any continued price strength might force more shorts to cover, adding fuel to the rally. Two short squeezes since Dec 2023 have already jolted prices higher; further squeezes are possible if the price breaks key levels. Additionally, seasonal patterns: Typically, auto manufacturers ramp up production in spring and summer, which could marginally increase catalyst demand in those periods, lending support to prices in Q2–Q3 of a year.
Fundamental Guardrails: Fundamentals in the short term are not outright bearish – 2024 is expected to still be near balanced supply/demand (small deficit or surplus). Investment bank forecasts for 2024 average around the current price (e.g., Fitch forecast $1,050 for 2024, and an LBMA analyst survey ranged broadly from $724 to $1,250). This suggests the market consensus is for range-bound trade in 2024, perhaps between ~$900 on the low end and ~$1,200–$1,300 on the high end. However, the recent breakout above $1,200 indicates the high end of that range is being tested. Short-term, as long as palladium stays above the $1,000–$1,100 support, sentiment will remain improved.
Risks: A notable short-term risk is a global economic slowdown. If recession hits major economies in 2024, auto sales could dip, pulling palladium down again. Also, if the current rally is purely driven by technicals and short-covering without fundamental follow-through, it could fizzle out around the resistance zones and lead to a retest of the base. From a trading perspective, one might expect volatility between roughly $1,000 and $1,800 over the next few quarters, with an upward skew provided the recovery thesis holds.
Short-Term Verdict: Palladium is likely to grind higher or consolidate with an upward bias in the next 6–12 months. A reasonable forecast is palladium trading in the low-to-mid $1,000s with potential spikes towards $1,800 if bullish momentum persists. The structure does resemble early 2009 (the initial bounce phase), so further gains are plausible. However, a dramatic surge straight to $3,000 in the next year seems unlikely without a clear fundamental trigger. Thus, for 2024, a base-case target range might be $1,500–$1,800 on the upside, with downside limited to ~$900–$1,000 by strong support (barring unforeseen shocks).
Medium-Term Outlook (2–3 years)
Over the medium term (to 2026–2027), the critical question is whether palladium’s recovery will continue to follow the 2008–2011 analog – which would mean a strong push toward previous highs – or whether it will stall out due to the evolving fundamentals. This period likely holds the answer to “mirror or diverge” from the earlier cycle:
Bullish Scenario (Fractal Repeat): In a bullish case, palladium could indeed mirror 2009–2011 with a powerful Wave V rally (as per Elliott Wave) that takes it back toward its all-time highs. This would require some help from fundamentals or speculative narratives. Possible enablers include:
Persistent or Resurgent Deficits: If EV adoption hits roadblocks (e.g., slower expansion due to infrastructure or policy changes) and if substitution for platinum plateaus, palladium demand might not fall as much as expected. Meanwhile, if supply growth disappoints (recycling or mining issues), the market could remain tight. Under such conditions, the perceived surplus might not materialize, and a renewed deficit could emerge even as the market expected surplus – a setup for price strength. For instance, if by 2025 the palladium market is roughly balanced instead of surplus (due to some supply hiccups), investor sentiment could swing bullish again, targeting higher prices.
Geopolitical Shock: A sudden event like a sanction on Russian palladium or a major mine outage could spark a panic about supply, just as in early 2022. If that coincided with already low inventories, prices could skyrocket again. While one cannot plan on a war or strike, these possibilities lurk. If something akin to the 2022 shock happened in, say, 2025, palladium could quickly retest $2,800–$3,000 or higher, regardless of EV trends in the very near term.
Speculative Cycle: Commodities often overshoot fundamentally justified levels in both directions. Palladium’s crash was an overshoot on the downside as the market turned excessively bearish. It’s conceivable that a few years down the road, the narrative might flip (for example, if platinum also becomes expensive or if there’s a realization that ICE vehicles will linger longer in developing markets). A speculative fervor could build, driving palladium to, say, Fibonacci extension targets – perhaps $4,000+ – even if only briefly. Remember that in 2010–2011, palladium’s rally overshot what many thought possible, partly due to speculative and investment flows (ETFs were loading up, etc.). A similar dynamic could occur if momentum builds.
In this bullish medium-term scenario, price targets would include the full 100% retracement (~$3,400) and possibly new highs. A measured move beyond the highs could see $4,000–$4,500 per ounce (some analysts might aim for ~$5,000 as an extreme 1.618x extension). However, this outcome likely requires a “perfect storm” of factors leaning bullish, which is not the base case given what we know now.
Base Case / Moderation: A more likely medium-term path, considering current knowledge, is a moderation of the recovery once initial upside targets are met. By 2025–2026, the reality of surplus palladium is expected to set in. The Investing News 2025 outlook suggests palladium will be rangebound with a downward bias, perhaps $900–$1,000 average in 2025, reflecting the oversupply. Similarly, Morgan Stanley and Macquarie project prices eroding toward $1,100 by mid-decade. Under this base case, palladium might peak in late 2024 or 2025 during the initial rebound (maybe around the $1,800–$2,400 zone as discussed) and then start to slip back as the surplus builds. It could form a broad trading range instead of a one-way rally – say oscillating between $1,000 and $2,000 over the next 2–3 years, without making new highs. In such a scenario, the 2008–2011 fractal would partially mirror – we’d get the initial V-up (like 2009–2010) but perhaps not the blow-off to substantially higher highs. Instead, palladium could stabilize at a moderate level relative to its peak. For example, it might settle in a mid-ground, e.g., $1,500 in 2025, $1,300 in 2026 – reflecting gradual decline as surplus grows. This would be akin to palladium’s behavior after the early 2000s spike: it crashed and partially recovered by mid-2000s but never revisited the 2001 high until many years later.
Bearish Scenario: On the flip side, if EV adoption accelerates faster than expected or if some economic slump significantly dents autocatalyst demand, palladium’s medium-term outlook could turn more bearish. In that case, the current rebound might top out quickly (maybe it already did near $1,300–$1,500), and prices could grind back down under $1,000 and continue a secular downtrend. Some forecasts even envision palladium in the mid triple-digits by late decade (e.g., one long-range projection saw ~$600 by 2028). In a bearish medium-term scenario, palladium would fail to mirror 2008’s big comeback; instead it would resemble something like platinum after 2008 (platinum spiked in 2008 then collapsed and never came close to that high again, staying in a lower range). For palladium, that might mean it never exceeds ~$1,800 again and instead slowly decays to lower levels as usage wanes.
Given all factors, the medium-term outlook is cautiously optimistic but with diminishing returns. A plausible projection is that palladium peaks somewhere between $2,000 and $2,800 in the next 2–3 years, falling short of the $3,440 high unless an extraordinary catalyst intervenes. After that peak, increased supply and substitution likely cap the market, and prices could start a multi-year plateau or descent. This would make the current cycle a partial mirror of 2008–2011: a strong rebound but perhaps not a launch into sustained new highs. Monitoring points for the medium term will be:
Does palladium break above $2,500 (signaling a full-blown bullish revival) or does it stall before that?
Are there clear signs of surplus in inventories by 2025 (which would pressure prices)?
How fast is the EV encroachment by, say, 2026? (If EV market share leaps into 20%+ globally faster than thought, that’s bearish.)
Long-Term Outlook (Beyond 2027–2030)
Looking further out, the long-term outlook (late 2020s and beyond) for palladium grows increasingly challenging, primarily due to the secular shift in automotive technology:
EV Revolution and Palladium Demand: By 2030, electric vehicles and hybrid technology will likely have a much larger share of the vehicle market, significantly reducing palladium’s main source of demand. Many developed countries have targets to phase out ICE car sales in the 2030s. Even without full phase-out, if EVs are, say, 30-50% of new car sales by 2030 globally, that’s a huge dent in palladium demand (which is ~90% auto). Additionally, fuel cell vehicles (which use platinum, not palladium) could start emerging. Therefore, long-term demand for palladium is expected to decline materially. The question is the slope of that decline – gradual or steep. Current projections foresee palladium demand peaking or plateauing by mid-2020s and then falling toward 2030. For instance, one forecast cited earlier expects an actual surplus of nearly 1 Moz by 2027 and continuing thereafter. By 2030, if nothing changes, palladium might be in chronic oversupply as recycling plus diminishing new usage outstrips demand.
Price Trajectory: If the above holds, the long-term price trajectory for palladium is bearish or at best flat. Absent a new significant demand source for palladium, the metal could follow the path of some past industrial commodities that saw structural decline (perhaps analogous to how silver’s photographic demand dropped after digital cameras, etc.). Some analysts, as noted, foresee palladium drifting down to mid-triple digits over the long haul – essentially back to pre-2010 price levels, when palladium was more of a niche precious metal. We might see palladium eventually trading in the low hundreds of dollars if the market is well oversupplied. However, it’s rarely a straight line down; there could be volatility and spikes along the way (for example, even in a declining market, a war or mine flood in 2028 could cause a temporary price jump). But the secular trend would likely be one of decline or stagnation.
Potential Offsetting Factors: Could anything rescue palladium in the long run? A few possibilities:
New applications: If palladium finds new industrial uses (e.g., in electronics, hydrogen economy, chemical catalysis beyond current uses) that significantly increase demand, it could mitigate the loss from autos. For instance, palladium is used in some multi-layer ceramic capacitors (in electronics) and in some hydrogen storage research (absorbing hydrogen). If any such use became mass-market (like palladium in fuel cell catalysts, though platinum is favored there), it might create a new pillar of demand. Currently, nothing of that scale is on the horizon.
Slower EV transition: The EV shift is largely policy-driven. If for some reason the world backpedals on EV adoption (perhaps due to infrastructure limits, consumer pushback, or policy changes such as removing subsidies or favoring synthetic fuels for ICE), then ICE vehicles might remain predominant longer. This scenario would extend palladium’s demand tail. Some hints: the delay of Euro 7 emissions standards to 2031 implies regulators are giving more breathing room to ICE development, and certain politicians advocating for less aggressive EV policies could slow the trend. Even so, technological momentum for EVs seems strong, so any slowdown likely only buys a few extra years of demand, not a permanent reversal.
Permanent supply issues: It’s also possible that by 2030, geopolitical fragmentation (say Russian supply permanently off Western markets) or depletion at older mines reduces effective supply. If palladium supply shrinks faster than demand, it could support prices. For example, South African mines might pivot more to platinum if palladium is cheap, inadvertently limiting palladium output. Or environmental pressures might restrict new mining. Such supply constraints could keep palladium from collapsing in price even as demand ebbs, leading to a new equilibrium at, say, $800–$1200 long-term instead of sub-$500.
Long-Term Price Range: Considering all, a reasonable guess for long-term prices might be that palladium gradually trends down to the $500–$1000 range by the early 2030s. It might oscillate within that band as the market finds a new balance. That implies that the “glory days” of consistently $2000+ palladium could be behind us once we exit this transitional rebound phase. The market effectively has to price in being less scarce in the future.
In investment terms, palladium’s long-term outlook is why many analysts have rotated to prefer platinum (with its hydrogen and diverse demand) over palladium. Indeed, platinum regained parity and then premium over palladium for the first time since 2017–2018, and this trend may persist with palladium eventually trading at a discount to platinum as was historically normal (platinum was long more expensive until 2017). Long-Term Verdict: Unless unforeseen developments occur, palladium by 2030 is likely to be at lower price levels than today, possibly significantly so. The current structure probably will not fully mirror 2008–2011 in the long run – that cycle saw new highs and continued strength through 2014. In the current cycle, even if we get a strong rebound by 2025, the late 2020s could usher in a secular decline. Thus, any price spikes in the medium term might be opportunities for producers or holders to hedge or sell forward, banking on still-high prices before the long-term fundamentals exert full force.
Conclusion
Palladium’s quarterly chart tells a story of a spectacular rise, a spectacular fall, and a hopeful rebound. The recent 63% plunge from all-time highs was among the worst in the metal’s history, wiping out several years of gains. However, the market has begun to stabilize and rebound, drawing clear parallels to the 2008–2011 cycle when palladium last experienced a crash of similar magnitude. Fractal analysis reveals that the structure of the decline and nascent recovery indeed mirrors the past pattern, suggesting potential for a V-shaped revival. Technical analysis further supports this: a solid base has formed around long-term support, bullish momentum is building, and key levels up to ~$2,000 are coming into view. The emergence of higher quarterly lows, bullish candlestick formations, and the prospect of an Elliott Wave “Wave V” advance all point to a market that may have bottomed. That said, history does not repeat exactly. Our in-depth fundamental review highlights critical differences in the backdrop. In 2008–2011, palladium’s demand quickly resurged amid economic recovery and there was no imminent threat to its primary use. Today, palladium faces a world moving gradually away from combustion engines, substitution by a cheaper sibling (platinum), and a supply picture shifting from deficit to surplus. These forces impose a ceiling on long-term prospects even as they don’t preclude a strong intermediate rally. Bottom line: In the short to medium term, palladium is poised to continue its recovery. A reasonable expectation is for prices to challenge higher retracement levels (e.g. $1,800, then potentially $2,100–$2,400 if momentum and short-covering persist). With some luck and bullish catalysts, an overshoot toward previous highs (near $3,000 or slightly beyond) is not off the table, especially given palladium’s volatile nature and history of price spikes. The current structure does share DNA with the 2008–2011 V-bounce, meaning a rapid climb from the ashes is feasible. Measured moves and Fibonacci symmetry point to ambitious targets like $3,400 (100% retracement) or even $5,000 (1.618 extension) in a roaring bull case, though those would likely require a confluence of positive surprises. However, as the timeline extends, headwinds strengthen. By the late 2020s, increasing EV adoption and ample recycling supply are projected to weigh heavily on palladium, potentially driving it back into a secular downtrend. Investors and analysts widely foresee palladium underperforming its PGM peers in the long run, with average prices potentially settling much lower than recent years.
Sources:
Stillwater Mining Company via The Mining Record (June 2025) – Data on 2008–2009 palladium crash and recovery
Reuters (Peter Hobson, Jan 2023) – Discussion on palladium’s rally peak and EV/substitution impact
Reuters (Deep Vakil & Peter Hobson, May 2023) – 60% price fall, auto demand outlook, analyst forecasts
Nasdaq/Barchart (Andrew Hecht, Nov 2023) – Palladium plunge below $1000, supply concentration, substitution effect
Investing News (Dean Belder, Jan 2025) – Palladium 2024 performance, 2025 outlook, EV market share, oversupply forecast
CME Group / WPIC (Feb 2024) – Palladium vs platinum, short positions and short squeeze events, surplus forecast
APMEX Knowledge Center – Historical drivers: Russian stockpiles, South African strikes, 2022 invasion impact

GOLD SELL M15 Gold (XAU/USD) 15-Min Chart Analysis – July 18, 2025
Overview:
This chart shows a bearish outlook on gold with a potential short-selling opportunity. The price has recently reacted to a supply zone and is expected to move lower.
---
Key Levels:
Entry Zone (Supply Area): Around $3,350–$3,352
Stop Loss (SL): Above the supply zone at $3,360
Target (TP): $3,338 (primary target)
---
Market Structure:
CHoCH (Change of Character) and BOS (Break of Structure) suggest a bearish reversal from the previous bullish move.
EQH (Equal Highs) acted as liquidity grab before price dropped.
Price has tapped into a supply zone and shown signs of rejection.
---
Trade Idea:
Expecting price to form a lower high and then continue the downward trend.
The projected move is a series of lower highs and lower lows toward the $3,338 target level.
This area is also supported by a previous demand zone and may act as a strong take-profit region.
---
Summary:
A short position is favored from the $3,350 area, with a stop loss at $3,360 and a target of $3,338. The bearish bias is based on multiple CHoCH and BOS confirmations, indicating potential downside momentum.