Gold fluctuates and moves lower! Gold price falls!Market news:
In the early Asian session on Wednesday (July 16), spot gold fluctuated slightly higher and is currently trading around $3,330/ounce. After the release of US inflation data, the market's focus shifted from macro data and interest rate prospects to policy risks again. The US dollar index strengthened by 0.6%, which also exacerbated the short-term pressure on London gold prices!
Although gold prices have shown a downward trend in the short term, market sentiment has not completely turned to pessimism. The uncertainty of tariff policies may provide support for gold prices. We are still optimistic about the long-term trend of gold, and the market's attention to tariffs will drive international gold prices to rebound in the future.
Next, investors will focus on the US Producer Price Index (PPI) to be released on Wednesday, as well as speeches by Fed officials to assess policy trends. Many institutions believe that in the context of intensified global policy games and increased volatility of the US dollar, the importance of international gold as a safe-haven and anti-inflation asset is still increasing.
Technical review:
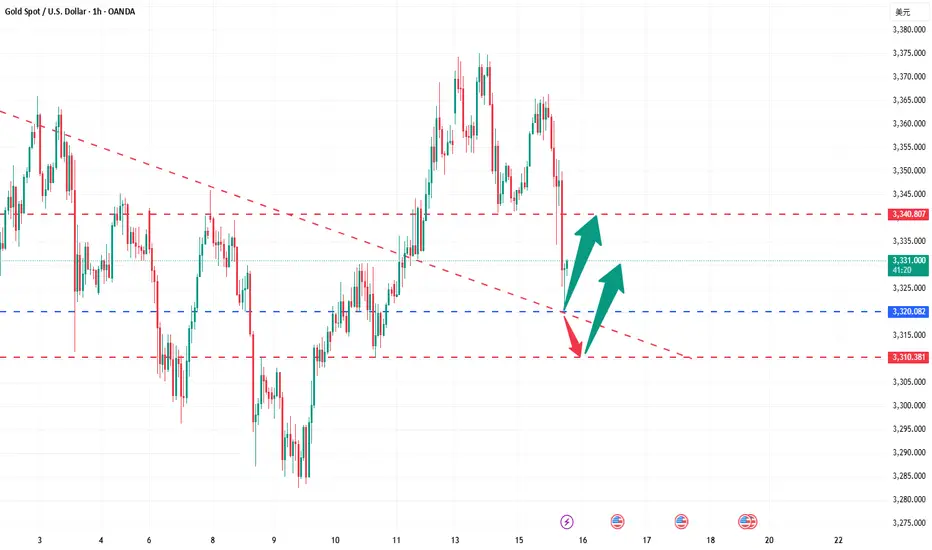
Gold hit a high of 3,366 yesterday and was blocked and fell back. It broke down to 3,320 during the US trading session and closed with a long shadow on the daily line. Today, the trend is to continue to fluctuate, and there should not be much room below. The current support level is near the daily MA5 and the middle track. The next step is still the focus. If you want to rise, you can't go down here. If you go down, you will continue to sweep back to 3320 and 3300!
The daily line maintains a continuous negative structure. The further strengthening of the US index puts gold and silver under downward pressure. The gold price on the daily chart returns to below the MA10 daily moving average, the New York closing plus the 5/7-day moving average, the RSI indicator middle axis is flat, and the price is running in the middle and lower track of the Bollinger band. The four-hour chart and the hourly chart moving average cross open downward, the RSI indicator runs below the middle axis, and the Bollinger band hourly chart opens downward and runs in the middle and lower track of the price. The gold trading idea remains unchanged with the high-price selling layout as the main layout, and the low-price buying is auxiliary.
Today's analysis:
Gold has been very weak in the past two days, and it has been going up and down. Gold finally fell as expected yesterday. Gold won three consecutive victories yesterday. Gold bought at a high level and failed. Gold will be sold again next. Gold rebounded in the Asian session and continued to sell.
Gold's 1-hour moving average has also begun to turn downward from a high position. If the gold's 1-hour moving average forms a dead cross downward, the downward momentum of gold will increase, and gold still has room to fall. Gold fell below the previous double bottom support of 3346 in the US market yesterday. Now gold's 3346 short-term has begun to turn into resistance. Gold is under pressure at 3346 in the Asian market and continues to sell at high prices.
Operation ideas:
Short-term gold 3310-3313 buy, stop loss 3302, target 3340-3360;
Short-term gold 3346-3349 sell, stop loss 3358, target 3320-3300;
Key points:
First support level: 3320, second support level: 3308, third support level: 3292
First resistance level: 3346, second resistance level: 3360, third resistance level: 3376
Futures market

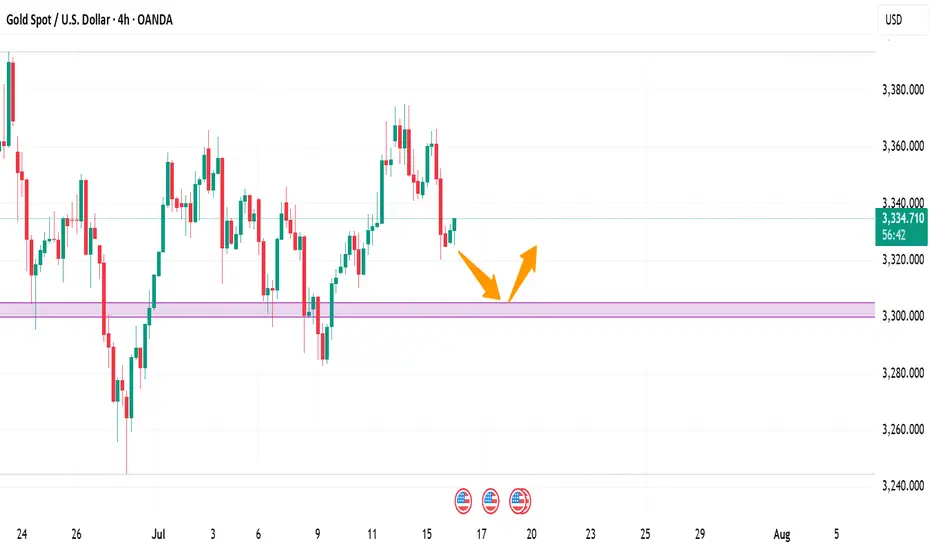
XAUUSD Structural Analysis & Confluence - 16 July 2025 4-Hour Bias & Structural Context
Gold has recently broken above a key structure level at $3,320, confirming a bullish market environment on the 4‑hour timeframe. This follows a Change of Character (CHOCH) around $3,300, signifying a shift from consolidation to an upward trend. The swing from the late-June low ($3,244) to mid-July’s high ($3,374) sets our Fibonacci context:
38.2% retrace ≈ $3,318
50% retrace ≈ $3,309
61.8% retrace ≈ $3,300
These fib levels also align with prior structure and key ICT/SMC zones, signaling strong areas of interest.
🧭 Key 4-Hour Confluence Zones
Demand / Order Block → $3,300 – 3,305
Multi-method support: BOS, CHOCH, 50–61.8% fib convergence.
Fair Value Gap (FVG) → $3,320 – 3,325
Volume deficient zone post-BOS, primed for a retest.
Supply / Resistance Area → $3,360 – 3,370
High-timeframe supply, likely to cap further upside.
🧠 Smart Money Concepts
BOS above $3,320 confirms bullish structure.
CHOCH at ~$3,300 marks structure flip.
Liquidity grab zones found between $3,335–3,340, validating the presence of institutional activity.
Order Block at $3,300–3,305 supports buy-side interest.
📊 1-Hour Intraday Trade Setups
🔸 Setup #1 – FVG Re-Test
Entry: At ~$3,325 on pullback into $3,320–3,325 zone
SL: Below $3,320
TP1: $3,345, TP2: $3,360
🔸 Setup #2 – Demand OB Bounce (“Golden Setup”)
Entry: In the $3,300–3,305 range
SL: Below $3,298
TP1: $3,325, TP2: $3,345, TP3: $3,360
Edge: Tight risk, high confluence (SMC + fib + structure)
🌟 The Golden Setup
Zone to Watch: $3,300–3,305
Why It Rates Highest:
BOS, CHOCH, fib, and OB all align
Offers tight stop placement and strong upside
Risk-to-reward ~1:3
📌 Daily Watchlist Summary
Directional Bias: Bullish (BOS above $3,320 intact)
Primary Entry Zones:
$3,300–3,305 (Demand OB + structure)
$3,320–3,325 (FVG retest for continuation)
Key Target Zones:
$3,345–3,350 – realistic intraday exit
$3,360–3,370 – major supply cap
Invalidation Level: 4‑hour candle close below $3,298 negates bullish outlook
Final Commentary
Stay disciplined—only trade reactive signals at these levels: clean bounces, pinbars, or bullish engulfing patterns. The $3,300–3,305 zone stands out as the prime ‘Golden Setup’ entry.
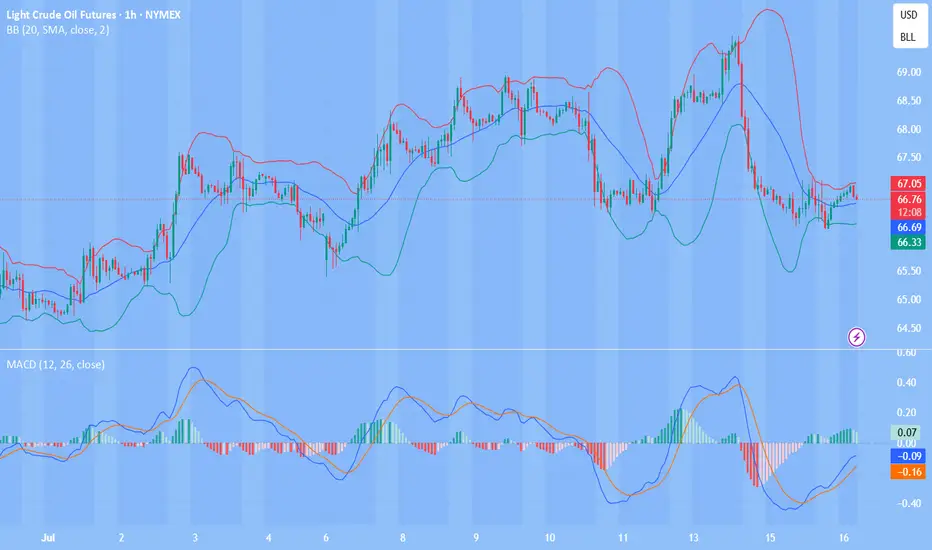
WTI(20250716)Today's AnalysisMarket news:
① The annual rate of the overall CPI in the United States in June rose to 2.7%, the highest since February, in line with market expectations, and the monthly rate was 0.3%, the highest since January, in line with market expectations; the annual rate of the core CPI rose to 2.9%, the highest since February, lower than the expected 3%, but slightly higher than 2.8% last month, and the monthly rate was 0.2%, lower than the market expectation of 0.3%.
② Interest rate futures still show that the Fed is unlikely to cut interest rates this month, but there is a high possibility of a 25 basis point cut in September.
③ Fed mouthpiece: The CPI report will not change the Fed's policy direction.
④ Trump: Consumer prices are low and the federal funds rate should be lowered immediately. The Fed should cut interest rates by 3 percentage points.
⑤ Fed Collins: The core inflation rate is expected to remain at about 3% by the end of the year, and the Fed should maintain active patience.
Technical analysis:
Today's buying and selling boundaries:
65.66
Support and resistance levels:
66.49
66.18
65.98
65.34
65.14
64.83
Trading strategy:
If the price breaks through 65.66, consider buying, the first target price is 65.98
If the price breaks through 65.34, consider selling, the first target price is 65.14
XAU/USD(20250716) Today's AnalysisMarket news:
Sources said that after Trump's latest trade tax threat, the European Central Bank will discuss a more negative scenario next week than expected in June. The ECB is still expected to keep interest rates unchanged at its meeting on July 24. Discussions on rate cuts are still postponed to September.
Technical analysis:
Today's buying and selling boundaries:
3353.05
Support and resistance levels:
3386.70
3374.12
3365.96
3340.13
3331.97
3319.40
Trading strategy:
If it breaks through 3353.05, consider buying in, the first target price is 3365.96
If it breaks through 3340.13, consider selling in, the first target price is 3331.97

XAU intra?
Hi
Risk @ 3343 (approx 10$)
If I'm taking this.
Marking 3290 and 3315 as targets
Have to be careful with this volatility.
Trade calmly, choose high percentage & familiar pattern/setup ok
All the best
Not a guru

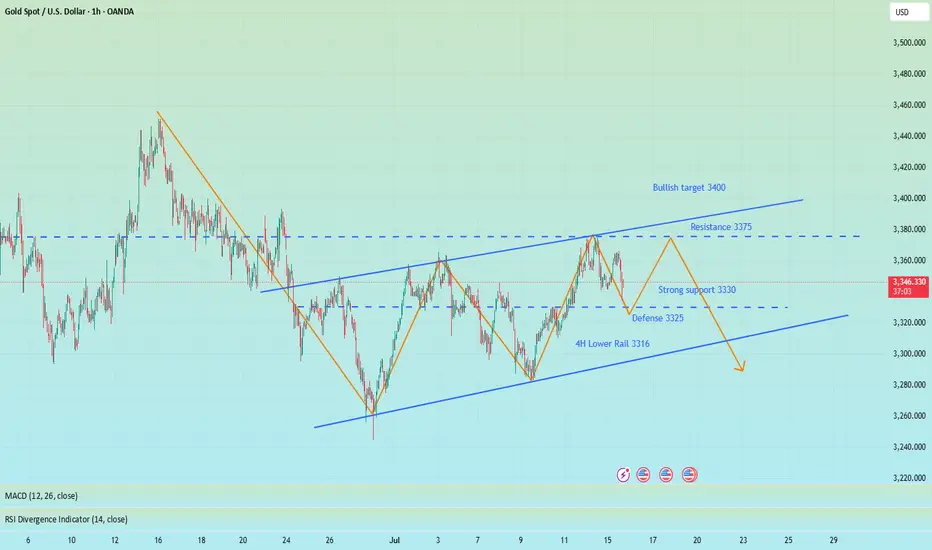
XAUUSD is currently trading at 3358, entering a potential buy zoXAUUSD is currently trading at 3358, entering a potential buy zone for short-term upside continuation.
This level is attractive for buyers, positioned just above the key support at 3339.00, offering a favorable risk-reward setup.
The immediate resistance is located at 3370, which will serve as the first test of bullish strength.
A breakout above 3370 opens the door for a move toward the second resistance at 3375.
Sustained bullish momentum and a clear close above 3375 would build confidence toward the confirmation target at 3400Stop-loss should be strictly placed below 3339.00 to manage downside risk and protect capital.
The optimal buy zone lies between 3356–3359, providing a tight entry range above support with upward potential.
Momentum indicators and volume spikes near 3370–3375 should be monitored to confirm breakout validity.
If price holds above 3350 with strength, it signals buyer dominance and increases the probability of hitting 3400.
Overall, this is a high-probability buy setup above 3358, targeting 3370, 3375, and 3400, with 3339 as the critical invalidation point.

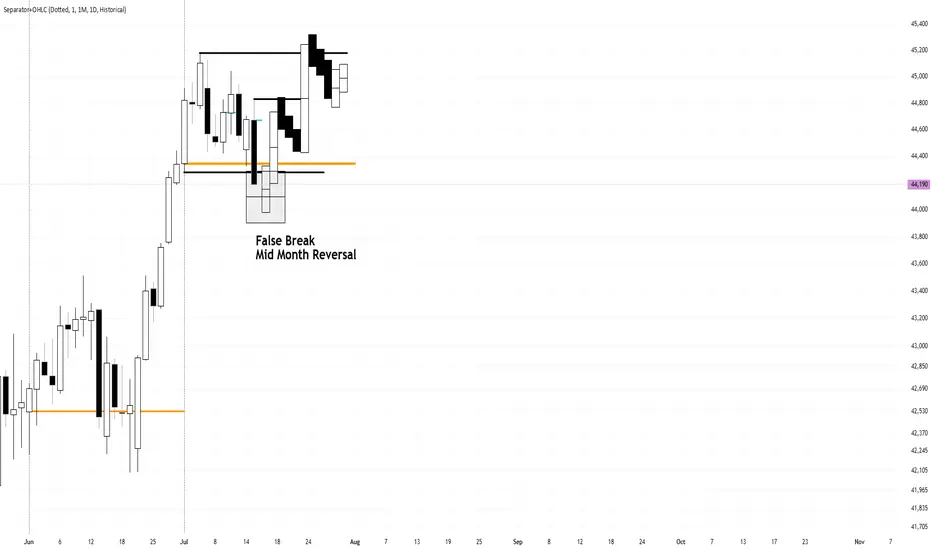
Range Bound July Fade The BreakoutNow that CPI has traded and closed below the monthly open, I am eager to see Wednesday's price action. I believe this is the Low of Month/Mid Month Reversal to trap shorts selling down low. Since the trend is bullish, I want to see buyers step in and pivot away from that low. Trap and shift.
I don't know how far it will go out of balance before/if snapping back inside for the trap and shift.
Tuesday's Daily candle is a signal day as a down day in a range bullish trend. It will either have more follow through or get bought back up.
I will be looking for a buy low opportunity Wednesday.
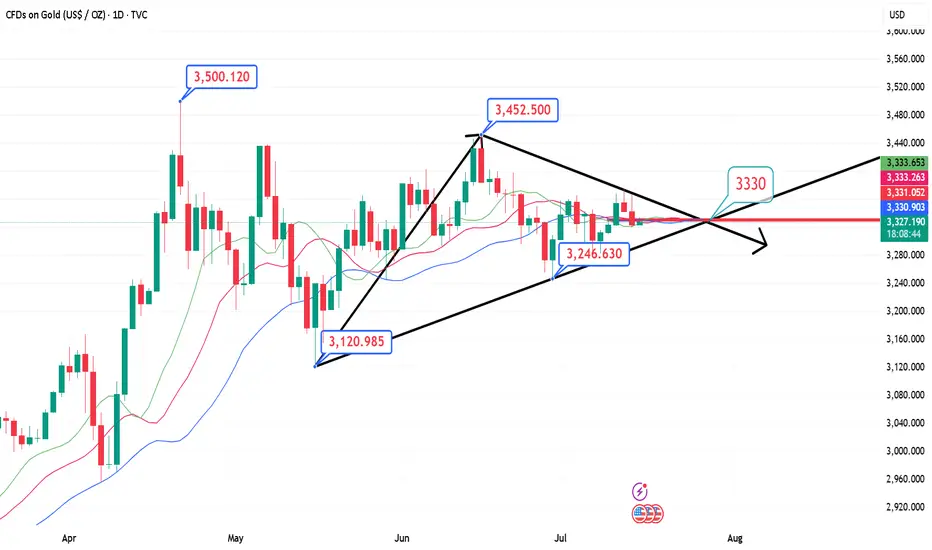
CPI triggers sell-off, 3330 can be short-term long📰 News information:
1. Focus on tomorrow's CPI data
2. Bowman's speech at the Federal Reserve
3. Tariff information outflows and countries' responses to tariff issues
📈 Technical Analysis:
The short-term trend flag pattern has been formed, and our short-selling strategy perfectly hits the TP. According to current news, Trump has once again urged the Federal Reserve to cut interest rates. While there is almost no possibility of a rate cut this month, there is a high probability that a 25 basis point rate cut will be completed in September, which is also in line with our previous prediction of market trends.
The big negative line in 4H pierced the middle Bollinger band. Although the CPI data is bullish, it has little impact based on the announced value. Market expectations have been digested in advance, so there is no room for a big drop. The upper points still focus on the short-term resistance of 3355-3365. If it rebounds to this area first in the short term, you can consider shorting again. Focus on the strong support of 3330 below. As long as the retracement entity does not fall below 3330, gold will rise again and touch the resistance line of 3375-3385.
🎯 Trading Points:
BUY 3335-3325
TP 3355-3365
In addition to investment, life also includes poetry, distant places, and Allen. Facing the market is actually facing yourself, correcting your shortcomings, facing your mistakes, and exercising strict self-discipline. I share free trading strategies and analysis ideas every day for reference by brothers. I hope my analysis can help you.
OANDA:XAUUSD PEPPERSTONE:XAUUSD FOREXCOM:XAUUSD FX:XAUUSD TVC:GOLD FXOPEN:XAUUSD
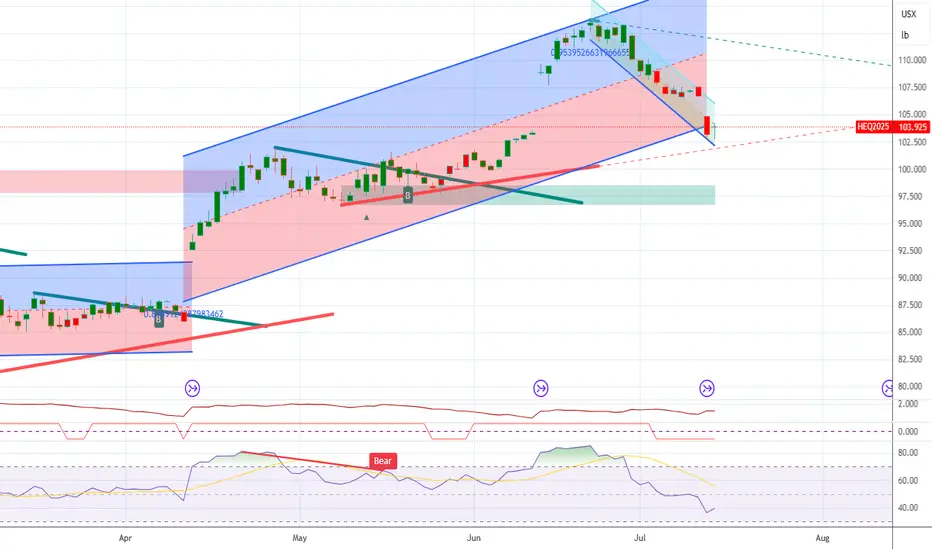
HE1! ShortHE1! is now net short on the regression break.
The roll on this commodity short is (-3.2%) for the front month.
I am not taking this trade.
Gold is accelerating downward, pay attention to important supporThe U.S. inflation data for June was released overnight. The actual data showed that U.S. inflation rebounded slightly in June, but it did not exceed expectations. After the data was released, Trump made a speech at Truth A post on Social said that given the low consumer prices, the Fed should lower interest rates. He has been calling for a rate cut for some time, so the market still has some uncertainty about the timing of the Fed's subsequent rate cuts, but the probability is in September. The probability of keeping interest rates unchanged this month is high. The US dollar index is also supported and continues to rebound. Gold fluctuated higher from around 3344 in the morning of the previous trading day. During the European session, it refreshed the intraday high and touched the 3366 line under pressure and maintained repeated narrow consolidation. After the data was released, it first rebounded quickly to the 3360 line and then quickly fell back. After two repetitions, it finally moved downward. In the evening, it fell below the intraday low and once touched around 3320 and then stabilized and rebounded. The daily line closed with a middle shadow. Technically, the continuation of the previous convergence triangle after the break is currently returning to the downward channel again.
Pay attention to the pressure of 3342/44 during the day, and pay attention to the support near 3308 below. If it falls below 3308 again, it will return to the downward channel.
YM_US30-WEEKLY SELLYM traded down today (7/15/2025), as expected. Still expect more selling after a quick move to the upside (44,477) level. Sunday's open created a void, expecting it to be traded back into intraday.

Gold Pullback in Play – Still Aiming for 3450 📌 In yesterday’s analysis, I argued that bulls likely won the battle and that a new leg up toward 3450 could be next from a swing trade perspective. I also mentioned that buying dips remains the preferred strategy.
And indeed – we got that dip.
📉 Price pulled back to 3340 and bounced,
but it hasn’t yet touched my key area of interest: 3330–3335.
What now?
My view stays the same –I still expect a move toward the 3450 zone,but I also believe a deeper dip toward support is still on the table – likely a liquidity grab before the next leg up.
Trading Plan:
✅ Buying dips remains the core strategy
🚫 Invalidation only comes on a break below 3305–3310
🎯 Upside target remains well above 3400, aiming for 1000+ pips
Let’s stay focused and let price come to us.
🚀
Disclosure: I am part of TradeNation's Influencer program and receive a monthly fee for using their TradingView charts in my analyses and educational articles.
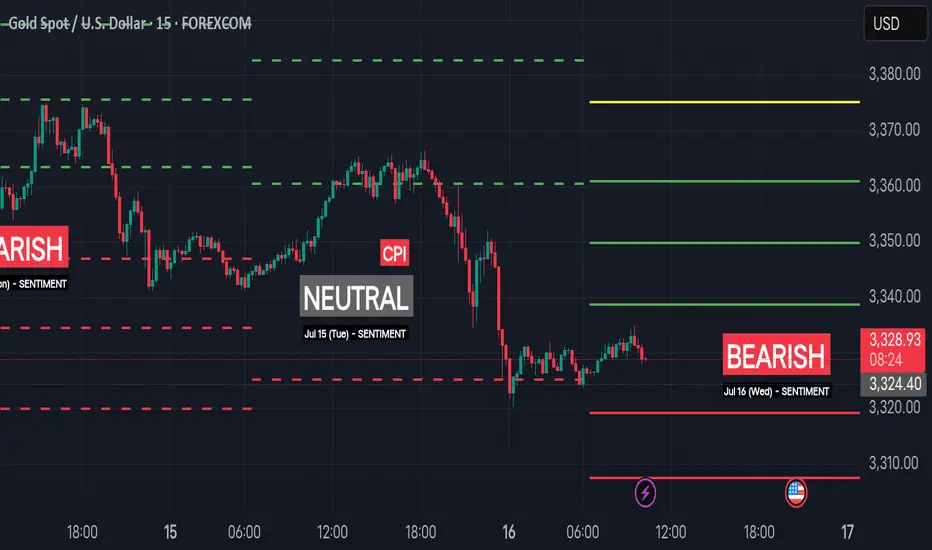
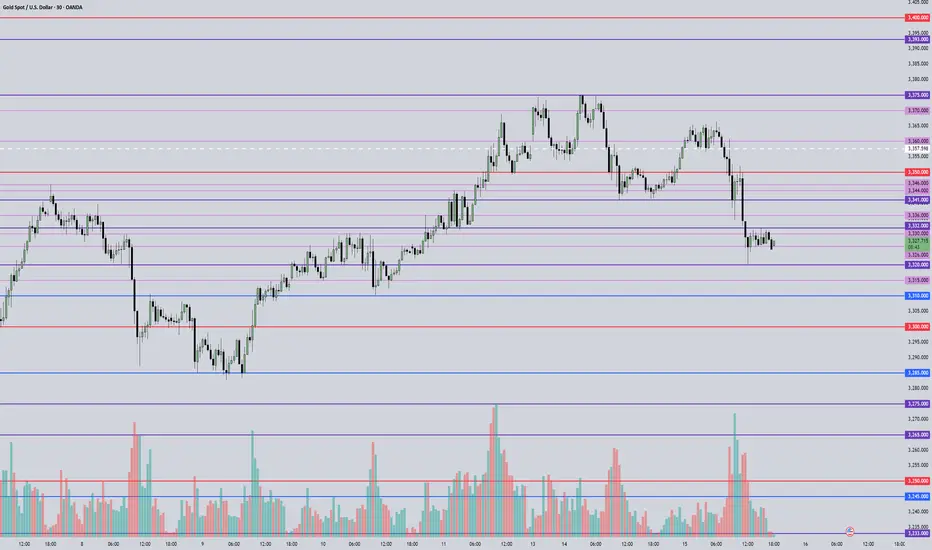
Bearish Sentiment (Jul 16 Wed) | Intraday S/R for Swing TradingSentiment: Bearish
🟢 Support Levels
1. 3319.20 – Minor support near Friday’s bounce zone
2. 3307.60 – Key support from early U.S. session rejection zone
3. 3296.10 – Institutional support / demand buildup
4. Extreme Support: 3283.40 – Break below this opens extended sell-off zone
🔴 Resistance Levels
1. 3338.70 – Minor resistance from overnight price action
2. 3349.80 – Key resistance aligned with previous close and seller defense
3. 3361.00 – Strong intraday ceiling, potential short trigger
4. Extreme Resistance: 3375.20 – Break above this signals risk-on bullish momentum
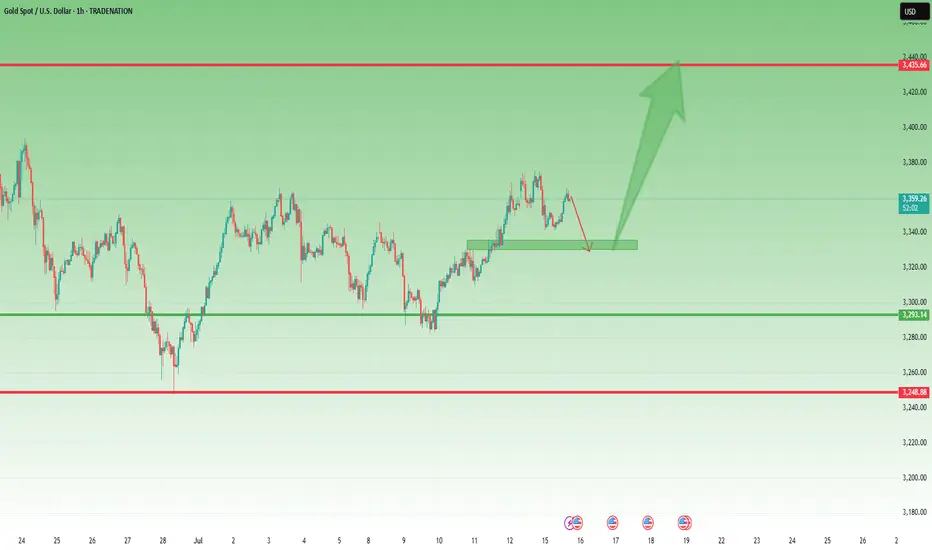
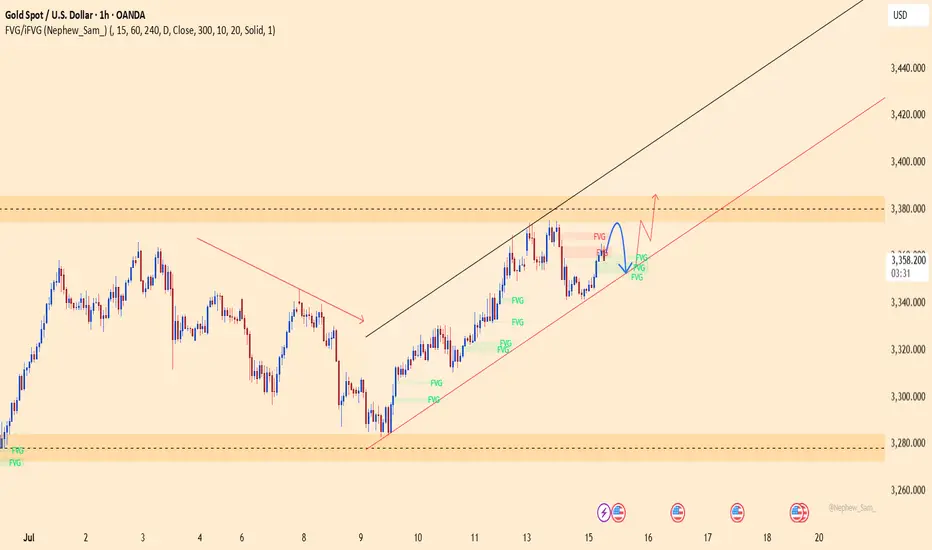
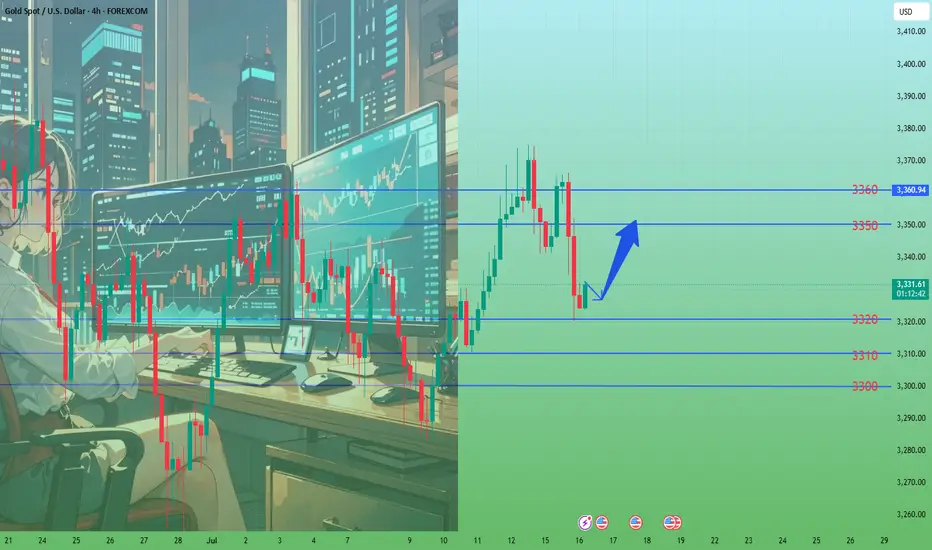
Gold set to surge? XAUUSD is holding firmly within a clear ascending channel on the H1 chart. After a strong rally, price is showing signs of a minor pullback toward the trendline support – potentially the last chance for buyers before gold accelerates toward the upper resistance zone.
On the news front, lower-than-expected U.S. producer inflation data has weakened the dollar, increasing gold’s appeal as a safe haven. In the coming days, key economic events like retail sales and comments from the Fed could serve as catalysts for the next bullish leg.
Beware of false decline and real rise of gold
💡Message Strategy
On Tuesday, the dollar index continued to rise, eventually closing at a high of 98.68, after a mild inflation report sparked speculation that the Federal Reserve might keep interest rates unchanged for the time being.
Spot gold gave up its intraday gains after the release of CPI data, once touching the $3,320 mark, falling for the second consecutive trading day.
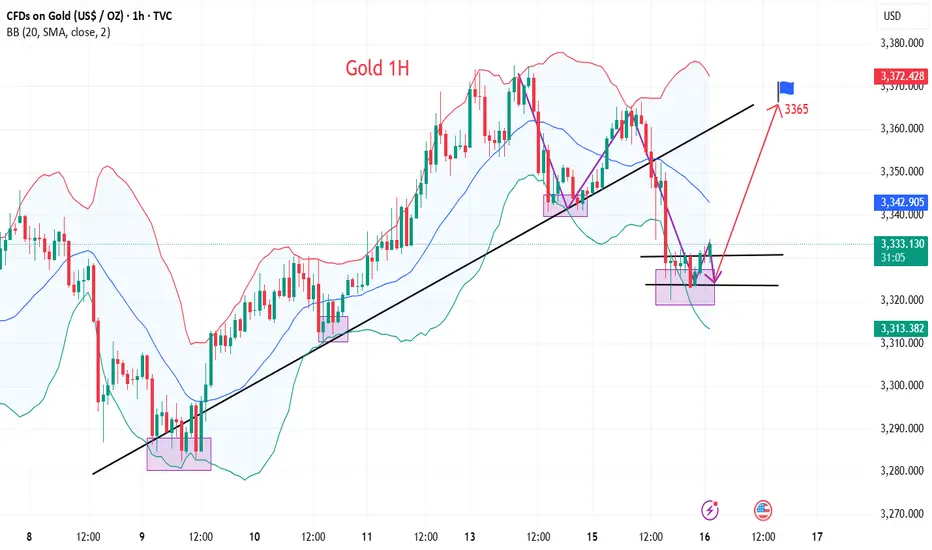
📊Technical aspects
In the hourly chart, gold has already touched the support trend line overnight.
Therefore, at present, it may be inclined to rebound, and gold still maintains an upward trend as a whole.
However, the upper 3340-45 is a short-term suppression position. If it cannot stand firm and break through 3340-45 today, it is not ruled out that it will continue to maintain 3320-40 for consolidation.
On the contrary, as long as it can stand firm above 3345 today, then gold will really rise in the future.
It is very likely that the high point of 3375 at the beginning of this week may be refreshed.
Therefore, in terms of operation, I suggest paying more attention to 3320-30. After all, 3320 is the overnight low. As long as it is not broken again, the probability of gold rising is very high.
However, if it falls below 3320 again today, it is not ruled out that it will continue to refresh the low.
💰Strategy Package
Long Position:3320-3330,SL:3305,Target: 3365
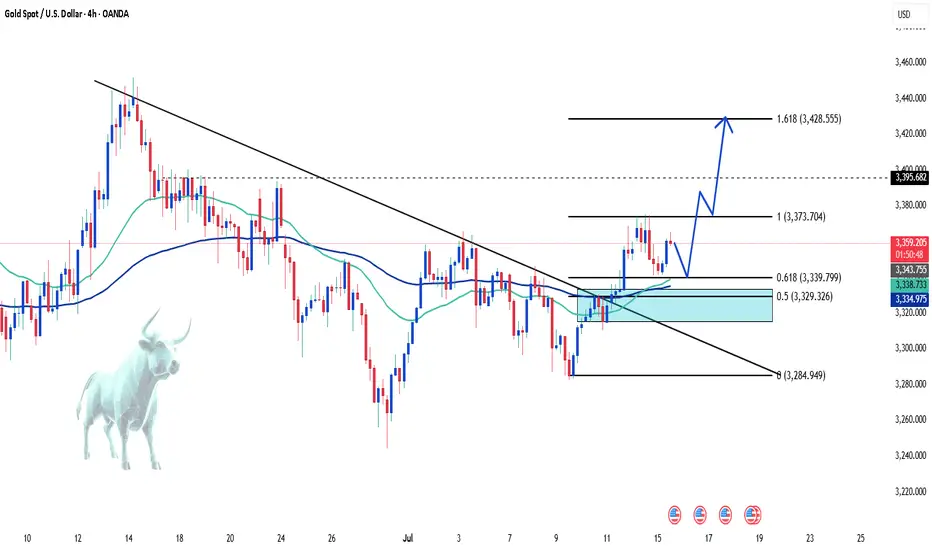
XAU/USD: Technical and News Signals Align for a Bullish Move💬 "When technicals and news align, traders can't ignore it."
Gold (XAU/USD) is at a critical juncture where both technical analysis and macroeconomic news are showing clear bullish signals. If you're waiting for a breakout, this might be the moment!
📊 Key Technical Analysis:
Gold bounced from a strong support zone at 3,339 – 3,329 (Fibo 0.618 & 0.5), confirming buying pressure.
EMA 34 crosses above EMA 89, signaling a potential trend reversal.
Breakout from the downtrend line opens up a target of 3,428 (Fibo extension 1.618).
Nearest resistance: 3,395 – if broken, a strong rally is likely.
🌐 Macroeconomic News Supporting the Bullish Trend:
The Fed may cut rates earlier than expected – USD weakens, benefiting gold.
Geopolitical tensions and financial instability in Europe increase demand for safe-haven assets.
US inflation cooling – market anticipates looser monetary policy.
Personal View:
If price breaks 3,395 with strong volume → long position, targeting 3,4xx.
Be cautious around resistance zones – short-term profit-taking could occur.
What do you think?
👉 Leave a comment, share your perspective or strategy – let’s ride the market wave together!
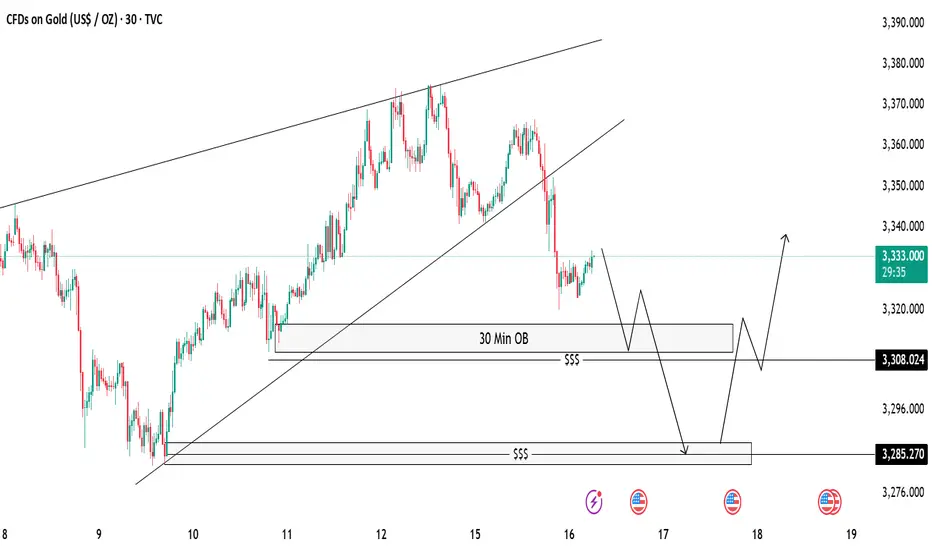
Gold 30-Min OB Analysis – Bounce or Drop..?Gold is showing a break of structure after a big sell-off 🔻. We have marked a 30-Minute Order Block (OB) 📍 which can act as a possible reaction zone.
📌 Two Scenarios We Are Watching:
✅ Scenario 1 (Bullish):
If price taps into the 30M OB and shows bullish rejection 🟢, we can look for buy opportunities, targeting the previous highs near 3335-3340 🎯.
❌ Scenario 2 (Bearish):
If price fails to hold the OB, we will watch for a liquidity sweep (marked with $$$) and expect price to move lower towards the next demand zone near 3285 📉.
⚠️ Key Notes:
Always wait for confirmation before entry.
Patience is the key 🧘♂️ — let the market come to us.
Daily Analysis- XAUUSD (Wednesday, 16th July 2024)Bias: No Bias
USD News(Red Folder):
-CPI m/m
-PPI m/m
Notes:
- No bottom yet on daily
- Looking for price to tap 0.5 fib or 0.236 fib
- Potential BUYSELL if there's
confirmation on lower timeframe
- Pivot point: 3380, 3300
Disclaimer:
This analysis is from a personal point of view, always conduct on your own research before making any trading decisions as the analysis do not guarantee complete accuracy.

Gold market trend analysis and exclusive analysis.Analysis of the latest gold market trends:
Analysis of gold news: The U.S. Department of Labor released the much-anticipated June Consumer Price Index (CPI) data at 20:30 Beijing time. After the CPI data was released, the financial market responded quickly, showing investors' recalibration of inflation data and monetary policy expectations. The U.S. dollar index (DXY) fell 16 points in the short term after the data was released, reflecting the market's interpretation of the core CPI being slightly lower than expected, which was dovish. The gold market reacted particularly sensitively. The core CPI was lower than expected, pushing spot gold up by $6 in the short term, indicating a brief rebound in safe-haven demand. In the short term, the probability of the Federal Reserve keeping interest rates unchanged in July is close to 100%, but the mild performance of the core CPI reserves the possibility of a rate cut in September or earlier. The market needs to pay close attention to subsequent data, especially the July CPI and PCE price index, to determine whether inflation will continue to rise.
Gold technical analysis: This week's upward breakthrough of 3375 further bullish on the 3400 mark; the daily average line diverges upward to support bulls, and bullish on bullish gains. However, if you want to rise, you must exert your strength today, otherwise the bulls may end at any time! The current support level is near the daily MA5 and the middle track. The next step is still the focus. If you want to rise, you can't go down here. Going down means continuing to sweep back to 3320 and 3300. Today's European session also broke high without continuation, and the US session formed a retracement to test the MA5 support level. As long as the middle track is not lost, the short-term will continue to touch the high, so the operation is very clear. In the short term, the short-term will rely on the support of the middle track to see a rebound, and the upper resistance is 3665-3375. The daily Bollinger Bands continue to close. If the upper 3375 is not broken, do not chase the high position, and beware of high-level selling. On the whole, today's short-term operation of gold recommends that the callback is mainly long, and the rebound is supplemented. The upper short-term focus is on the 3350-3360 line resistance, and the lower short-term focus is on the 3320-3310 line support.
Gold is Setting up for another moveLooking for price to make some impulsive moves before we get active. Looking like they are trying to establish a low for the week before they go full on bullish. waiting for them to find that bottom.

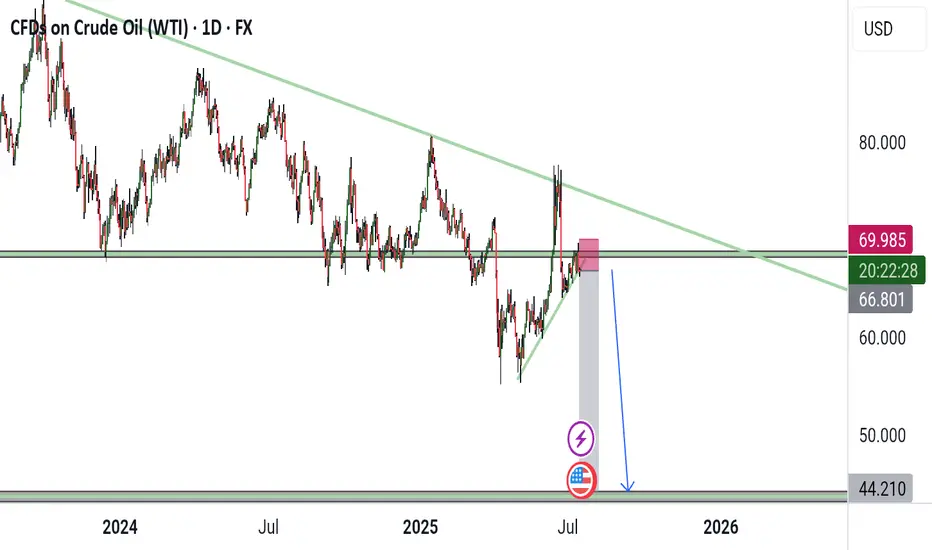
US oil for short Price is bearish on the monthly TF, price touched the trend line and formed bearish candlestick pattern on the weekly timeframe, price retested a resistance zone and broke the counter trend line.
July 16, 2025 - XAUUSD GOLD Analysis and Potential OpportunitySummary:
As long as 3332 holds as resistance, the early session plan is to sell on pullbacks into resistance.
An update will follow before the Asian session opens to confirm or adjust the plan.
Stay flexible and watch price behavior at key levels — follow the trend and manage risk carefully.
🔍 Key Levels to Watch:
• 3366 – Previous high resistance
• 3357 – Resistance
• 3350 – Midpoint resistance
• 3341 – Resistance
• 3332 – Key resistance
• 3320 – Intraday key support
• 3310 – Support
• 3300 – Psychological support
• 3285 – Critical support
• 3275 – Support
📈 Intraday Strategy
• SELL if price breaks below 3320 → target 3315, then 3310, 3300, 3285
• BUY if price holds above 3332 → target 3335, then 3341, 3346, 3350
👉 If you’d like to learn how I time my entries and place stop-losses, give this post a like — if enough people are interested, I’ll update this post to include more details soon!
Disclaimer: This is my personal opinion, not financial advice. Always trade with proper risk management.
How to find stable trading opportunities in gold fluctuations?Today, the rhythm of gold going short first and then long is perfectly grasped. Congratulations to those who followed the trading plan for reaping good returns. We are still holding long orders at present, and the overall position is arranged around the idea of stepping back to low and long. From the current market structure, the 3325-3320 area below is an important dividing line for the bulls to be strong, and it is also a key support level that determines the subsequent direction. If this area stabilizes, the short-term structure will still be bullish and unchanged, and the rhythm of stepping back to low and long is expected to continue. It is expected that gold will rebound to 3340-3350 and the upper target again. If 3320 is lost, it is recommended to stop loss as soon as possible, and the defense position is recommended to be set below 3315 to prevent the short-term structure from turning short and bringing further callback risks. The core of this round of trend is that only by holding the support can we be qualified to talk about rebound; if the support is lost, we need to turn decisively to prevent being passive. The current market volatility has intensified, but the direction has not yet completely broken. The focus of operation is still on entering the market around key points, switching positions between long and short positions to find the rhythm, blindly chasing orders and emotional operations will be taboos in the current market. Opportunities are not absent, but they belong to those who are always ready. The structure is not broken and the low and long will not change.