XAU USD SHORT Gold price was under the major Bearish trend and without a second confirmation I entered the short hoping it will reach the support I highlighted before pumping, I was in a rush and didn't realize price had reached and reversed for bulls to take over.
Futures market

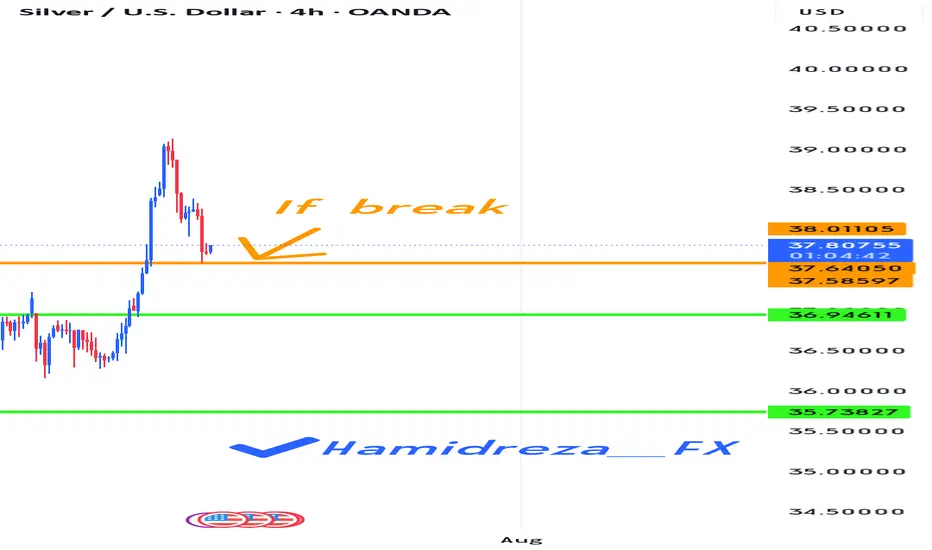
Is it time for a correction for silver?
Hi my dears
It seems that silver, like gold, should spend a few months in a resting phase. Of course, this is a guess. There is a condition on the chart that, if it happens, we should probably see the conditions shown on the chart happen.
I would be happy to hear your opinion.
Gold.. in the fog of global chaosNotes:
Markets for metals are at a ATH.
Global events are evolving rapidly.
Most of the time, war=raging gold prices
Markets are ripe to retrace and or maybe reverse at all. Taking setups on gold with a grain of salt.
Gold is an event driven market. I expect for now a consolidation until bearish signals show.
Lack of commitmentThere was a lack of commitment from buyers on the daily chart in the S&P 500. Although the session started out with buyers moving the market to new highs, it failed to maintain that upward momentum. This volatility could continue on Wednesday with the release of PPI.

XAUUSD ANALYSISOn gold currently we're analyzing 2H time frame. As we know that current trend was bullish. At this stage, I'm anticipating a retracement towards my Point of Interest (POI), where I’ll be looking for a clear bullish confirmation, ideally through candlestick structure or solid price action. Only upon receiving that confirmation will I consider entering a buy position.
This outlook is based on the higher time frame structure. For now, I'm observing patiently to see how price unfolds. Until the market sweeps the SSL liquidity, I will remain on the sidelines no entries until that key liquidity level has been taken. Confirmation is key.
Always use stoploss for your trade.
Always use proper money management and proper risk to reward ratio.
#XAUUSD 2H Technical Analysis Expected Move.

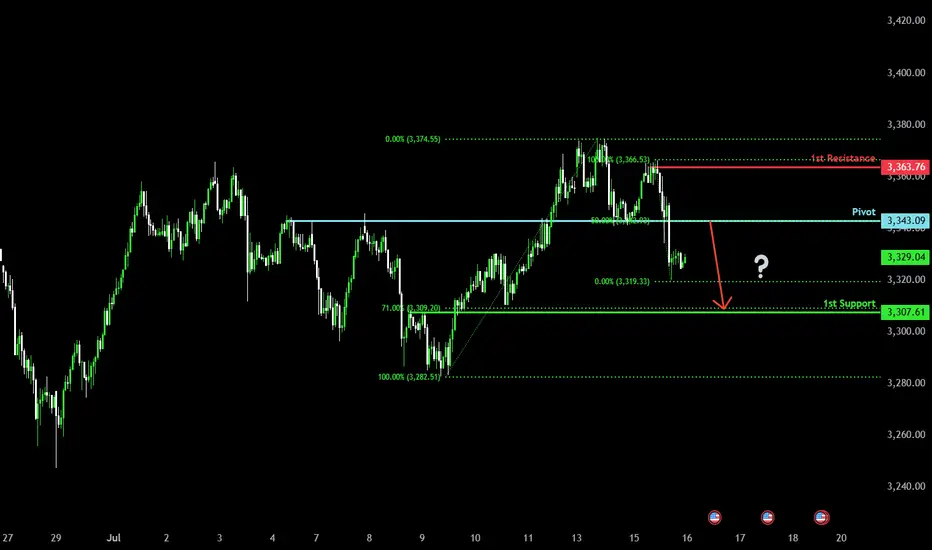
Major resistance ahead?The Gold (XAU/USD) is rising towards the pivot and could reverse to the overlap support.
Pivot: 3,343.09
1st Support: 3,307.61
1st Resistance: 3,363.76
Risk Warning:
Trading Forex and CFDs carries a high level of risk to your capital and you should only trade with money you can afford to lose. Trading Forex and CFDs may not be suitable for all investors, so please ensure that you fully understand the risks involved and seek independent advice if necessary.
Disclaimer:
The above opinions given constitute general market commentary, and do not constitute the opinion or advice of IC Markets or any form of personal or investment advice.
Any opinions, news, research, analyses, prices, other information, or links to third-party sites contained on this website are provided on an "as-is" basis, are intended only to be informative, is not an advice nor a recommendation, nor research, or a record of our trading prices, or an offer of, or solicitation for a transaction in any financial instrument and thus should not be treated as such. The information provided does not involve any specific investment objectives, financial situation and needs of any specific person who may receive it. Please be aware, that past performance is not a reliable indicator of future performance and/or results. Past Performance or Forward-looking scenarios based upon the reasonable beliefs of the third-party provider are not a guarantee of future performance. Actual results may differ materially from those anticipated in forward-looking or past performance statements. IC Markets makes no representation or warranty and assumes no liability as to the accuracy or completeness of the information provided, nor any loss arising from any investment based on a recommendation, forecast or any information supplied by any third-party.
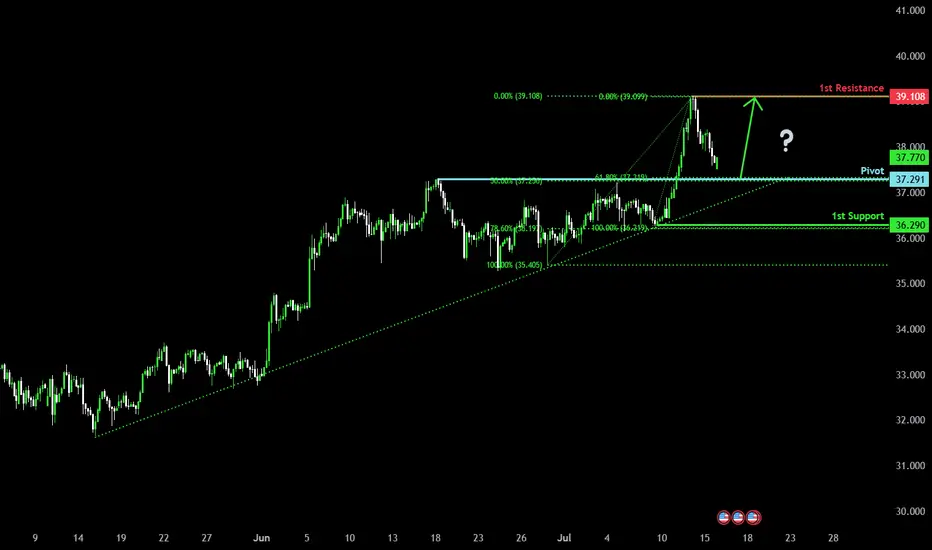
Falling towards the pullback support?The Silver (XAG/USD) is falling towards the pivot which acts as a pullback support and could bounce to the 1st resistance which is a pullback resistance.
Pivot: 37.29
1st Support: 36.29
1st Resistance: 39.10
Risk Warning:
Trading Forex and CFDs carries a high level of risk to your capital and you should only trade with money you can afford to lose. Trading Forex and CFDs may not be suitable for all investors, so please ensure that you fully understand the risks involved and seek independent advice if necessary.
Disclaimer:
The above opinions given constitute general market commentary, and do not constitute the opinion or advice of IC Markets or any form of personal or investment advice.
Any opinions, news, research, analyses, prices, other information, or links to third-party sites contained on this website are provided on an "as-is" basis, are intended only to be informative, is not an advice nor a recommendation, nor research, or a record of our trading prices, or an offer of, or solicitation for a transaction in any financial instrument and thus should not be treated as such. The information provided does not involve any specific investment objectives, financial situation and needs of any specific person who may receive it. Please be aware, that past performance is not a reliable indicator of future performance and/or results. Past Performance or Forward-looking scenarios based upon the reasonable beliefs of the third-party provider are not a guarantee of future performance. Actual results may differ materially from those anticipated in forward-looking or past performance statements. IC Markets makes no representation or warranty and assumes no liability as to the accuracy or completeness of the information provided, nor any loss arising from any investment based on a recommendation, forecast or any information supplied by any third-party.
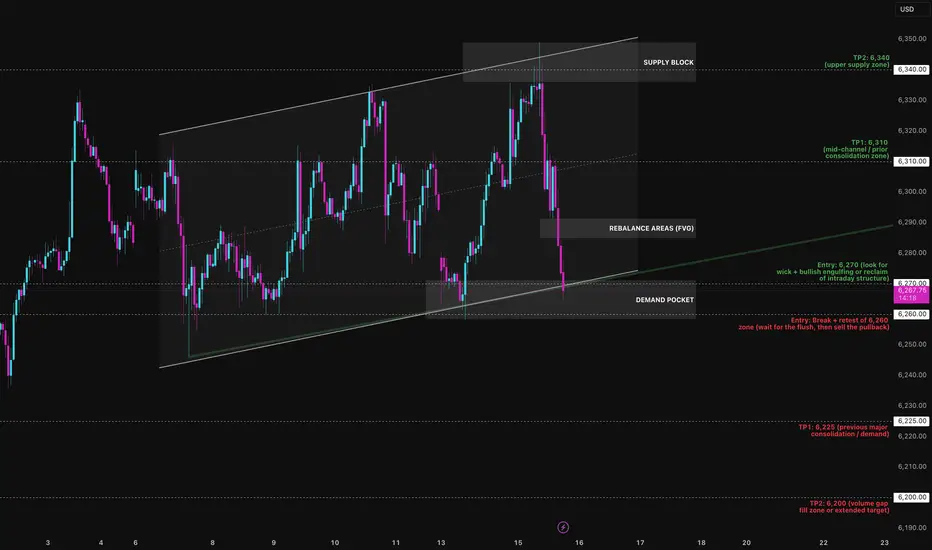
Bounce or Burial? The MES Funeral is Loading…The Micro E-mini S&P is walking a tightrope. After weeks of controlled movement within a rising parallel channel, price has now slammed into the lower boundary and the next move will define the week's direction.
I've mapped the channel from the July 2 low, with multiple precise touches on both upper and lower boundaries. Currently, MES is printing a heavy rejection from the 6360 supply zone, falling nearly 90 points back to the channel’s base near 6270.
Preferred Bias: Short-term Bearish Until Reclaimed
While the macro structure is still technically bullish (channel intact), momentum, supply pressure, and volume structure suggest sellers are gaining the upper hand:
- Mid-channel equilibrium (EQ) at 6310 was sliced without bounce
- No absorption yet at 6270 demand box
- Previous rally legs show decreasing impulsiveness — weakening buyers
Unless bulls aggressively defend 6270 with a reclaim candle or V-shape wick, this looks like a liquidity tap + structural breakdown loading up.
Bearish Play: “Channel Collapse Incoming”
Entry: Break + retest of 6,255–6,260 zone
SL: 6,275 (above retest structure)
TP1: 6,225
TP2: 6,180
Confluences:
- Channel break
- No support bounce at EQ
- Supply rejection at 6360
- Volume void below 6250
Bullish Play (Countertrend Fade): “Defend the Line”
Entry: Bounce off 6,270 with bullish engulfing or reclaim
SL: 6,255 (invalidate structure)
TP1: 6,310 (mid-channel)
TP2: 6,340–6,360 (supply reload zone)
Only valid if buyers show up with real intent don’t pre-empt.
This is a textbook inflection zone. If the lower trend line breaks and retests from below, momentum favours the bears. If bulls trap and reverse this drop at 6270, we could see a fast grind back to 6360 but as of now, all signs lean toward breakdown over bounce.
Last resort buy’s concept ?Trade Journal Entry – XAUUSD (Gold Spot)
Date: July 15, 2025
Platform: TradingView (Demo Account)
Timeframe: 4H
Direction: Long
Status: Active trade under review / possible re-entry
Key Levels
- Sell-side liquidity tapped: ~3,340–3,345
- Support zone (mitigation block): ~3,316–3,310
- Last resort buy area: ~3,283
Market Context
Clear Break of Market Structure (BMS) confirming bullish bias.
Price swept recent sell-side liquidity above 3,360, failed to hold, and sharply pulled back.
Price is now entering a mitigation zone, sitting above the major buy-side liquidity zone and last resort demand.
Multiple liquidity layers marked below current price — good confluence for a reaction if structure holds.
Trade Rationale
Scenario A: If price respects ~3,316–3,310 zone and forms bullish engulfing/reversal, consider re-entry.
Scenario B: If price breaks deeper into 3,283 zone with SFP (swing failure pattern) or V-reversal, it's a last-chance long from premium demand.
Trade Plan
Watch for bullish reversal candle or lower timeframe BOS (M15) inside 3,316–3,310 zone.
If entered, SL below 3,283. TP remains at prior high ~3,492.
Manage risk carefully — only one more key demand zone below.
Emotional Reflection
Felt confident on initial entry, but market invalidated short-term structure. Now reassessing calmly — waiting for re-entry confirmation without chasing.
Reflection Questions
- Did I exit early enough once price showed failure to hold above 3,360?
- Will I maintain composure and wait for structure confirmation in the new zone?
- Is my risk sized properly for this secondary attempt?

XAUUSD PRICE ACTION ANALYSIS 📉 XAUUSD – Gold Price Action Outlook
🕒 Timeframe: 30-Minute Chart
📅 Date: July 15, 2025
---
🔍 Market Structure Analysis:
Gold has shown a clear shift in market structure — forming Lower Highs (LH) and Lower Lows (LL) after a Break of Market Structure (BMS) and Change of Character (CHoCH). This signals a transition from bullish to bearish momentum.
---
📈 Technical Insights:
Price was strongly rejected from a key resistance zone (around 3,375–3,380).
Multiple confirmations of bearish pressure, including structure breaks and EMAs turning down.
A retest of broken support is likely before continuing downward.
Targeting the demand zone near 3,282 as the next level of interest.
---
🎯 Bearish Target Zone: 3,282
A high-probability setup is forming. Price is expected to retrace slightly before pushing lower toward the marked target zone.

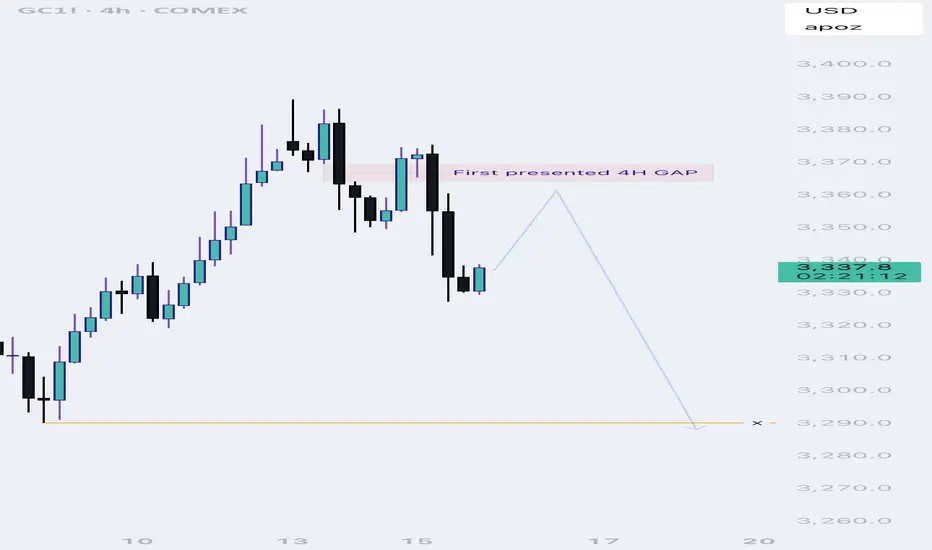
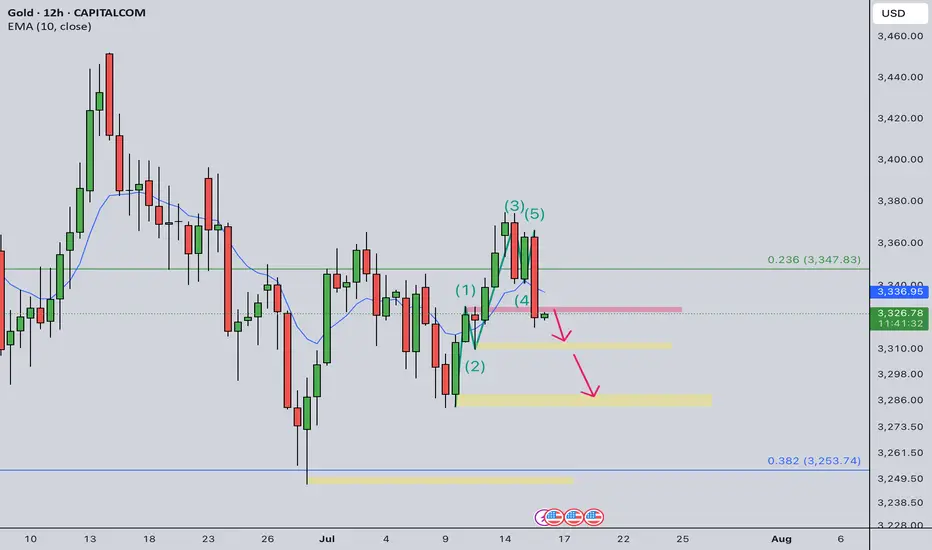
Gold Intraday Trading Plan 7/16/2025As expected yesterday, gold did dropped heavily although not from 3355 but 3365. It broke 3340 support and 3325 support. In 12hrly TF, its wave has just completed and started a new one.
I will sell from 3330 today and initial target is 3310, final target is 3380.
Beneath the Shelf Lies OblivionThis setup on MGC is a textbook example of what happens when structure, compression, and liquidity converge at a critical price shelf.
We’re currently sitting on top of a demand break zone near 3330, right at the intersection of a long-term ascending trend line and a descending supply-side compression line. This convergence zone is what I’m calling the Decision Point and the reaction from here will likely dictate the next directional leg.
Bearish Scenario – Breakdown Play
If price breaks and closes below 3330, I’m looking for a clean short setup triggered by:
- Loss of structure at the imbalance shelf
- No reaction from buyers at the previously defended zone
- Bearish pressure from HTF supply overhead (3385 zone)
- Momentum break from recent liquidity sweep at 3360
Trigger Entry: Below 3327 (post-break retest)
Stop: Above 3338 (invalidates reclaim)
TP1: 3305 (minor demand pocket)
TP2: 3285 (full move into HTF demand)
TP3 (optional): 3275 (tail end of imbalance)
Price would be transitioning from demand acceptance to supply dominance. The HTF supply above has been respected, and sellers remain in control if 3330 gives out.
Bullish Scenario – Reclaim Play
If price holds the 3330 demand shelf and reclaims structure with strength, I’m interested in a long position toward resting liquidity above.
Trigger Entry: Above 3342 (engulfing + reclaim of broken structure)
Stop: Below 3325 (demand failure = no-go)
TP1: 3360 (liquidity sweep)
TP2: 3385 (HTF supply retest)
If buyers defend this compression shelf, this could become a failed breakdown setup which often results in sharp squeezes. There’s also layered liquidity above 3360 from late sellers that could get raided quickly.
Let me put it in context:
HTF Zones Labeled: These areas are not just visual, they’ve driven major moves previously. I'm using them to anchor bias.
Compression Point: This is where your edge lies. Price is coiled between trendlines and major levels meaning the breakout will be decisive.
Volume Ignition Expected: Whether long or short triggers, expect strong follow-through due to the nature of the buildup.
No bias here just structure, zones, and execution plans. I’ll trade whichever side triggers first with confirmation, not prediction. This is the type of setup where patience pays more than opinion. Would love to hear how others are seeing this are you leaning with the shelf or looking to fade the break?

Trading Day SummaryTrading Day Summary
Today wasn’t a winning day on the books, but it was a major win in discipline.
I hit my daily loss limit before 10 AM, stopped live trading, and switched over to paper trades to protect my capital.
The setups I took—especially in Gold and Euro—lacked full confirmation, and one overnight trade didn’t align with my plan.
I experienced around $200 in slippage, which added to the loss.
The bright side? I stayed in control. No revenge trades. No emotional spirals.
My paper trade afterward was textbook—5R+ potential. That tells me the strategy is sound. Execution and timing just need to be sharper.
Bottom line: this is a marathon, not a sprint. I’m proud of the discipline and the mindset. Tomorrow, we reset and refocus.

XAUUSD – M15 Buy Setup⚡️XAUUSD – M15 Buy Setup
We’re back to business at a key decision point! Here’s what makes this a compelling opportunity:
📍Buy Setup on M15:
1️⃣ Price tapped into a strong support zone around 3333 – a level with proven reaction history
2️⃣ Third touch of the descending channel – possible breakout setup / bullish flag on HTF
3️⃣ A strong bullish engulfing candle closed above the previous daily close, showing buyer strength
4️⃣ Supported by the H4 MA zone acting as dynamic demand
🔥 Everything aligns technically for a high-probability bounce – but remember:
Strong setup ≠ guaranteed outcome.
We trade probabilities, not certainties.
🚀 Go for it guys... but manage your risk like a pro!
#XAUUSD #Gold #BuySetup #PriceAction #ChannelBreakout #SmartMoney #ChartDesigner #MJTrading #Forex #TradeIdea


Gold 30Min Engaged ( 3355 Bearish Entry Detected )Time Frame: 30-Minute Warfare
Entry Protocol: Only after volume-verified breakout
🩸Bearish Reversal 3355 Zone
➗ Hanzo Protocol: Volume-Tiered Entry Authority
➕ Zone Activated: Dynamic market pressure detected.
The level isn’t just price — it’s a memory of where they moved size.
Volume is rising beneath the surface — not noise, but preparation.
🔥 Tactical Note:
We wait for the energy signature — when volume betrays intention.
The trap gets set. The weak follow. We execute.

Gold Took the Bait Then Got Body BaggedThis afternoon I stepped outside my usual mechanical system and ran a classic: the Opening Range Breakout (ORB) on MGC just to see if gold still respects the old-school plays.
Marked the range of the first 15-minute candle, waited for the break and confirmation close, then entered on the short side.
Asset: Micro Gold Futures (MGC1!)
Timeframe: 15-Minute
Strategy: Opening Range Breakout
Session: NY
Bias: Short
Trigger: Bearish 15-min close below the ORB low
Notes
ATR Expansion: Signalled volatility coming off the open (range >20 ticks)
Liquidity Trap: Gold swept ORB highs before dumping a classic trap-and-flush
Volume Confirmation: Delta turned aggressively negative at the break
Risk-Reward: Tight stop above range, clean 1:3 move into session lows
ORB: Dumb-Simple, Still Deadly
ORB is one of the simplest tools in a trader's playbook and that’s what makes it dangerous (in both directions). When it works, it works. You define the opening range, wait for price to break out and confirm, and ride the move.
But here’s the nuance:
Gold LOVES to fake one side before exploding the other. It’ll sweep liquidity, bait breakout traders, then detonate in the opposite direction. Today was a textbook clean sweep of ORB highs, then a brutal reversal and breakdown.
I usually lean on mechanical, model-based strategies, structured entries, rule-based exits, logic-driven setups. But I’m not blind to price. Having a few flexible strategies like ORB in the toolkit gives you options on days where market intent is obvious. So… does ORB actually work? Here's what the research says:
- Al Brooks (Price Action Trading)
ORB-type plays win 55–60% of the time when confirmed with price action and managed properly.
- Linda Raschke (Street Smarts)
ORB entries rated highly during volatility expansions especially in futures.
- Quantified Strategies (S&P 500 ORB backtest)/b]
57% win rate with basic 1:1 R:R and no filters.
Internal Bookmap/Tradovate tracking on MGC .
Fake outs occur in 30–40% of ORB plays, especially during thin liquidity or low-news days. But let’s be real that 55–60% win rate is open to interpretation. It depends on the confluences. Are you using delta confirmation?
Are you filtering by session or volatility? Are you waiting for a close outside the range or just guessing? ORB works if you work it. The strategy isn’t magic. The execution is.
The twist with today wasn't a "trend continuation" move. It was a rejection. Gold baited breakout longs, then pulled the rug. This is where mechanical structure meets tape intuition.
Retail chased. Price snapped. Quant stayed calm and shorted the flush.
What Do You Think?
Do you still trust ORB? Or is it a trap most days? Do your stats back it up or have you evolved beyond it? Let’s open it up. Drop your ORB rules, tweaks, or horror stories below. I’ll reply to every serious one.

#xauusd #elliottwave short sell setup wave 4 16Jul24This count is based on my assumptions so anything can happen not a trading or financial advice just for educational purposes only kindly do your own ta thanks trade with care good luck.
Gold Tokyo Trap Setup: Liquidity Reversal vs. Month-Long Threat 📈 Technical Summary:
The market has been compressing between a major supply and demand matrix, with today’s setup showing:
🔹 Zones:
• Zone of Interest: 3390.55
• Rejection Zone: 3374.24–3343.78
• Minor Demand (Retail Support): 3291.41
• High Demand Zone (Strong Reaction Base): 3251.95–3240.73
• Major Support: 3212.91
• ⚠️ Threat Zone: 3169.61 – Month-Long Resting Liquidity
🧠 Setup Logic:
• Liquidity sweep likely in Tokyo session
• Expecting trap-based reversal from either 3291 or 3251
• Short-term long biased setup unless 3169 breaks, which opens macro bearish flow
⸻
📰 News & Macro Confirmation (July 16, 2025):
📌 Source: Kitco News – July 16, 2025
✅ Bullish Short-Term Bias:
• Fed Pause confirmed: No rate hike, which weakens the USD and favors gold
• China’s economic slowdown — driving safe-haven flows into gold
• Gold remains firm above 3320 USD despite global pressure, signaling underlying demand
• Investors positioning for a potential stimulus in China — bullish for commodities
⸻
🎯 Forecast Summary:
“Gold may tap into retail support zones (3291 → 3251) to attract longs before NY session upside. Macro data supports bullish bias short-term. But watch 3169 — below that, gold opens the gate to structural flush.”
⸻

best location for buy mid term goldthis my analysis combine price action SMC and Astrologi Financial...i see good moment for buy gold.

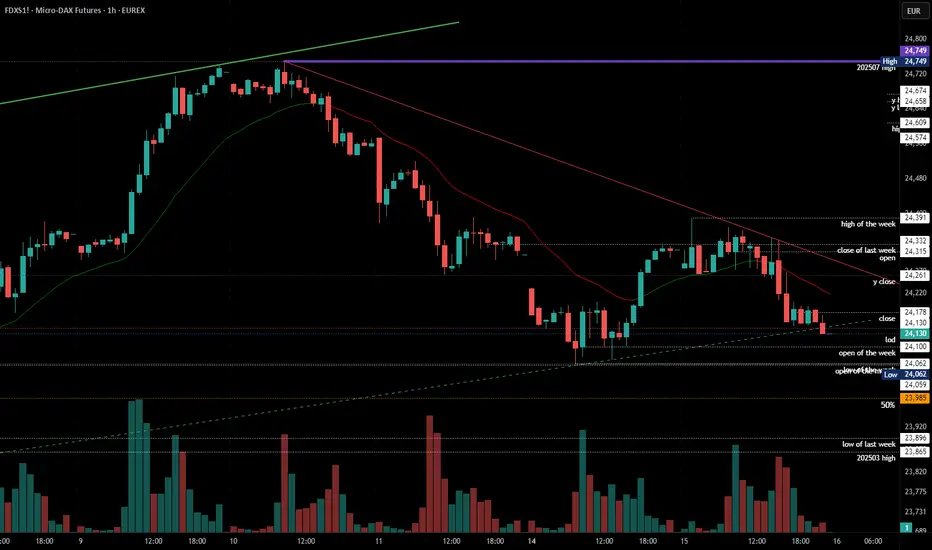
2025-07-15 - priceactiontds - daily update - daxGood Evening and I hope you are well.
comment: Very important day tomorrow. If we trade below 24000, this means we saw leg 1 from 24749 down to 24100 and leg 2 could lead us to 23500 or lower. Until we have clearly broken below 24000, I remain neutral but hopeful we can finally go lower again.
current market cycle: trading range
key levels: 23000 - 24750
bull case: Bulls need to stay above 24000 or risk a sell-off down to 23700ish. No matter how you try to draw the bull trend lines, they are all broken now but bears need lower lows below 23690 to confirm it. Daily ema is around 24100 and it has been support for 3 weeks and that is the reason I remain neutral for now.
Invalidation is below 24270.
bear case: Bears need to break below the daily ema and close below. Only then can we go lower. It’s good for the bears that they printed a lower high below 24400 but we are still too high for bulls to give up on BTFD.
Invalidation is above 24400.
short term: Neutral. If we stay below 24400, we have a shot at breaking down but 24000ish is support until proven otherwise. The selling today was not strong and the chart is rather neutral. Bears have only set up a potential structure which could break down but you have to wait for confirmation before betting on it.
medium-long term from 2025-06-29: Bull surprise last week but my targets for the second half of 2025 remain the same. I still expect at least 21000 to get hit again this year. As of now, bulls are favored until we drop below 23000
trade of the day: Scalping between 24250 - 24300 which was clear support & resistance for 4h after EU open. The bear breakdown was a surprise and not obvious to trade.
DIYWallSt Trade Journal: Perfect Morning Signals & Rate Cut bets07/15/25 Trade Journal, and ES_F Stock Market analysis
EOD accountability report: +404.50
Sleep: 7 hours
Overall health: Good
VX Algo System Signals from (9:30am to 2pm)
— 8:41 AM Market Structure flipped bullish on VX Algo X3!
— 9:33 AM VXAlgo ES X1 Sell Signal (triple sell)
— 9:40 AM Market Structure flipped bearish on VX Algo X3!
— 1:20 PM VXAlgo ES X1 Buy signal (triple buy)
What’s are some news or takeaway from today? and What major news or event impacted the market today?
We got great signals at the start of the day and that really helped with today's trading. I had some meetings today and stufff to take care of so i decided to lock out the funded account around noon and called a day.
News
— 9:54 AM
*TRADERS STICK TO BETS ON SEPTEMBER FED RATE CUT AFTER INFLATION REPORT
What are the critical support levels to watch?
--> Above 6295= Bullish, Under 6285= Bearish
Video Recaps -->https://www.tradingview.com/u/WallSt007/#published-charts

CRUDE OIL Bearish Flag Breakout 📉CRUDE OIL Bearish Flag Breakout!
⭕Sell!
__
#USOIL is trading in a local
Downtrend and formed a bearish
Flag pattern and now we are
Seeing a bearish breakout
So we are bearish biased
And we will be expecting
A further bearish move down
Sell!🔽
—
