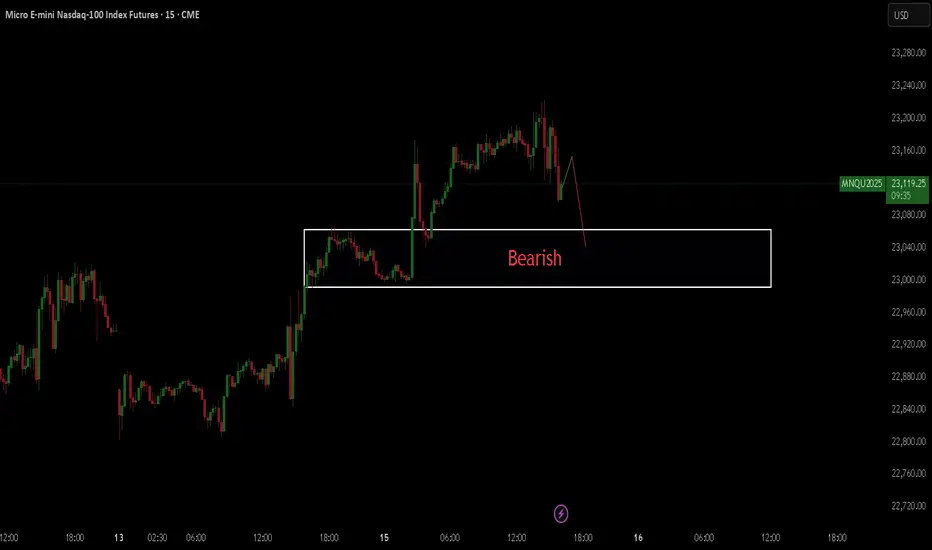
NASDAQ BEARISHHello, with my skills and my analysis I see that the Nasdaq market has a good chance of falling.
Futures market

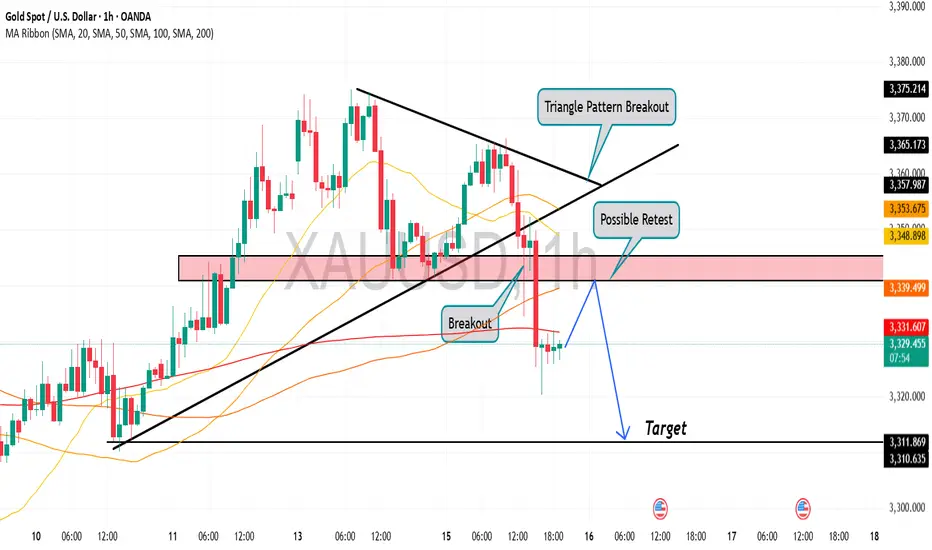
Gold is in the Bearish Direction after Breaking Triangle PatternHello Traders
In This Chart GOLD HOURLY Forex Forecast By FOREX PLANET
today Gold analysis 👆
🟢This Chart includes_ (GOLD market update)
🟢What is The Next Opportunity on GOLD Market
🟢how to Enter to the Valid Entry With Assurance Profit
This CHART is For Trader's that Want to Improve Their Technical Analysis Skills and Their Trading By Understanding How To Analyze The Market Using Multiple Timeframes and Understanding The Bigger Picture on the Charts
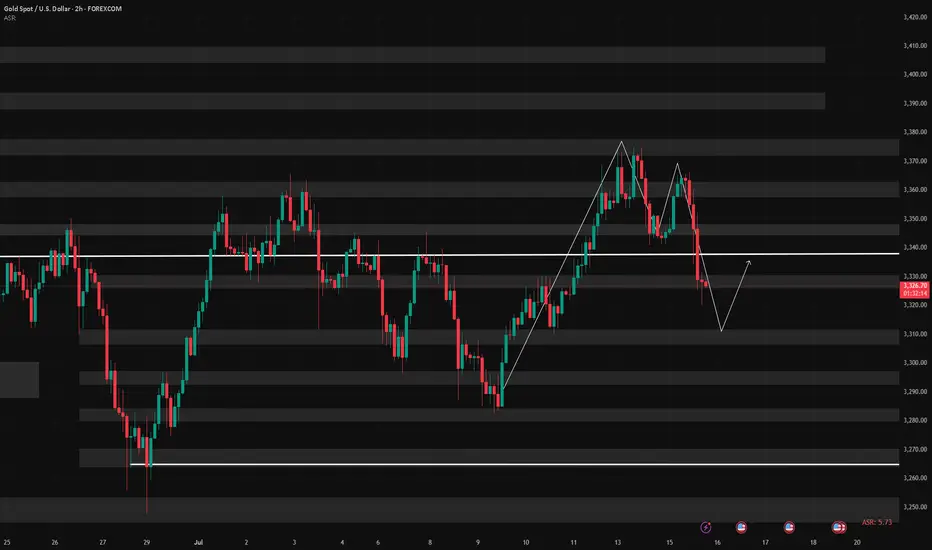
FX: XAUUSD set for a bullish legIn XAUUSD, I’m seeing a promising bullish setup that could offer a strong opportunity for upside continuation. The chart shows a breakout from a descending triangle pattern, followed by a clean retest of the breakout zone. What really catches my attention is the confluence of support, where the price is currently reacting to both the former descending trendline and a longer-term ascending trendline. This area, around the 3,320–3,330 level, is now acting as a critical decision point.
I believe this retest could serve as a launchpad for a bullish continuation toward the next key resistance at 3,450. That level has acted as a strong ceiling in the past, and it’s a logical target if the market maintains upward momentum. The higher lows forming since May suggest growing buying pressure, reinforcing the bullish bias.
Of course, this setup isn’t without risk. If price breaks below this confluence zone, we may see a return to the previous range or a deeper correction. But for now, I’m leaning bullish, especially if we get a strong bullish candle or increased volume confirming the bounce.
I’ll be watching closely and updating if conditions shift, but for now, XAUUSD looks poised for another leg up.


GOLD - CUT n REVERSE area, what's next??#GOLD ... perfect move as per our video analysis and now market just reached at his today most expensive area, that is 3340-41
Keep close that area and only holding of that area can lead us towards further bounce otherwise not.
So keep in mind we should didn't holda our longs below 3340-41
And obviously we will go for cut n reverse below 3340-41 in confirmation.
Good luck
Trade wisely
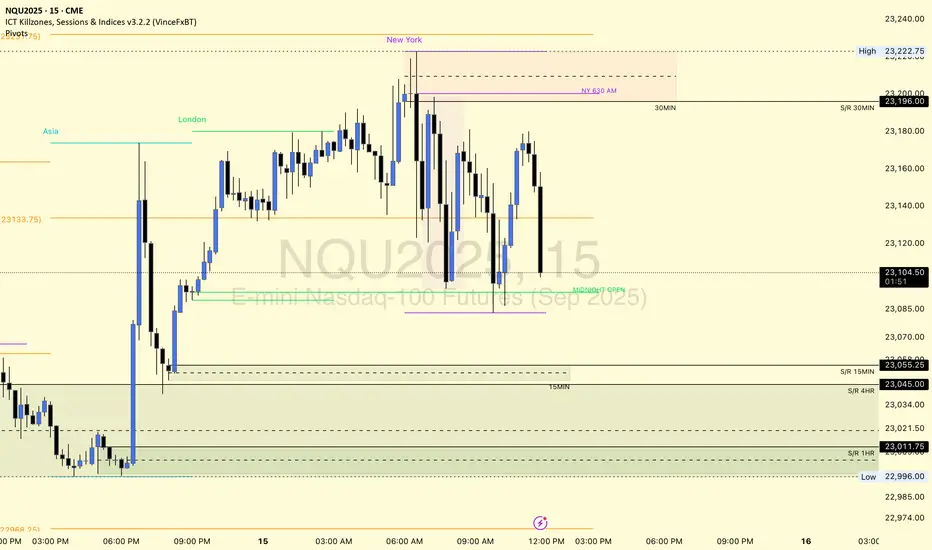
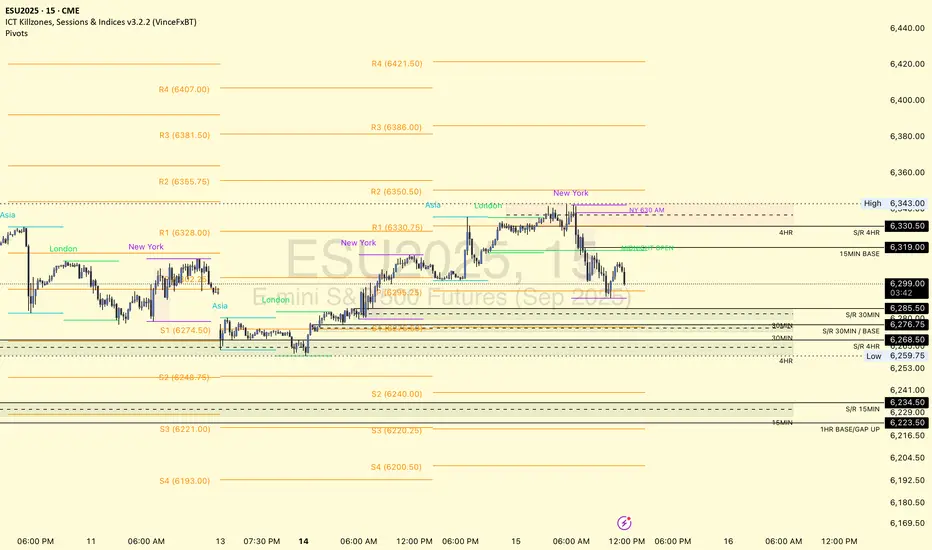
$NQ Supply and Demand Zones 7/15/25This for sharing my S/D zones for SEED_ALEXDRAYM_SHORTINTEREST2:NQ specifically.
Daily Market Outlook. 16.07.2025, CPI dayGold Short and NQ order flow explained. Along with the Dollar Index

XAUUSD Expecting bullish Movement Gold is showing potential for a bullish reversal from the key support zone between 3390 to 3395. Price has formed a base in this range, and if it holds, we may see an upside breakout above the descending trendline
Buy Zone: 3390 – 3395
First Target: 3355.50
Second Target: 3380.50
A successful breakout and hold above the trendline resistance could trigger a move toward our short-term targets. Watch for bullish confirmation before entering. Manage risk accordingly

AGAIN REVERSAL BEARISH SHORT PATTERN IN GOLD CHART📉 XAUUSD (Gold) Short Setup – Bearish Reversal
Timeframe: 4H
Pair: XAU/USD
Type: Bearish Reversal Pattern
Date: July 15, 2025
---
🔽 Sell Entry Details:
Entry Point: 3,326 - 3,330
Stop Loss (DB Point): 3,362 – 3,389 (Drawdown/Invalidation Zone)
Take Profit 1: 3,290
Take Profit 2: 3,260
Take Profit 3 (Extended): 3,247
---
📌 Key Zones:
Resistance Zone (Supply): 3,362 – 3,389
Support Zone (Demand): 3,247 – 3,260
Bearish Pattern Type: Rising Wedge + Double Top Confirmation
---
📊 Technical Analysis Explanation:
This chart shows a bearish reversal pattern forming on the 4H timeframe in XAUUSD. A rising wedge has broken to the downside after a double top rejection from the resistance zone near 3,362 – 3,389.
The price is now making lower highs and has broken structure support, suggesting a continuation of the downtrend.
🧠 Reasons for Short Setup:
Double Top Formation near Key Resistance
Rising Wedge Breakdown Confirmed
Bearish Momentum from Resistance
RSI Divergence on 4H
Volume Drop on Last Push Up
---
🎯 Trade Plan Summary:
Parameter Level
Sell Entry 3,326 - 3,330
SL Zone 3,362 – 3,389
TP1 3,290
TP2 3,260
TP3 3,247
---
⚠️ Risk Management Note:
Only risk 1-2% per trade. Wait for bearish candle confirmation on 4H timeframe before entering. This is a technical setup, not financial advice.
---
🔁 Update Plan:
I will update this idea if price breaks above 3,389 or shows reversal near 3,247.

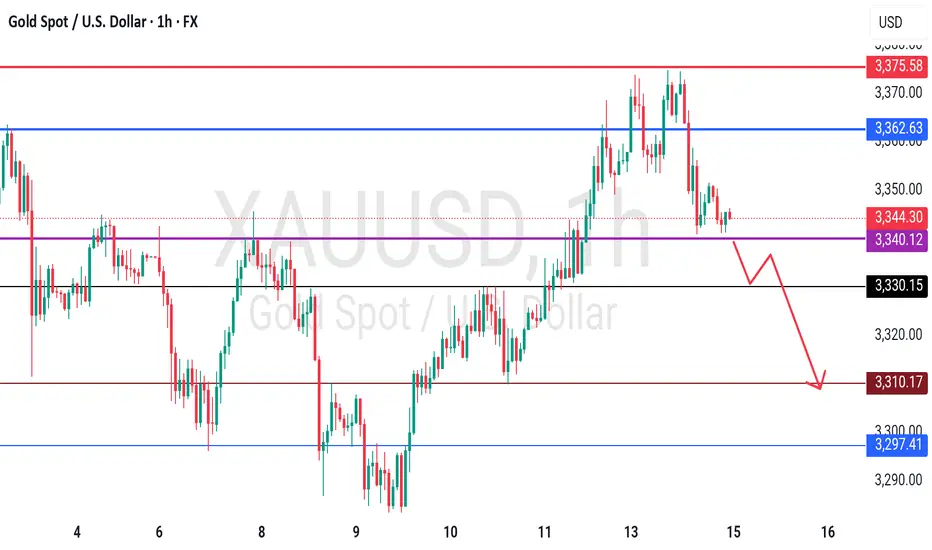
XAUUSD Looking to test the LowsHi there,
XAUUSD H1 looks bearish below a diagonal resistance and needs to break the yellow line for a bearish continuation toward 3304.61 for a bias of 3273.41.
It is possible for the price to spike up to the 3334.77 or 3360 inflection points.
Nonetheless, the daily momentum indicates that it will sustain the present momentum.
Happy Trading,
K.

XAUUSD: Navigating Gold's 4H Chart
Established Upward Trend Channel : The price action has largely respected an ascending trend channel (indicated by the thick green parallel lines) since late June, signifying a prevailing bullish bias. The price has bounced off the lower boundary of this channel multiple times.
Immediate Resistance at Swing and Strong Levels : Gold is currently encountering resistance around the 3,360.76 "Swing Resistance" level, and immediately above that, a "Current Strong Resistance" zone (highlighted in dark red) extending up to approximately 3,390. These levels represent critical hurdles for further upward movement.
Potential "Liquidity Grab" Below Trendline : An "S" symbol with a downward arrow below the current price and the ascending trendline suggests a potential "liquidity grab" or a temporary dip below the trendline to trigger stop-losses before a possible rebound. This indicates an expectation of short-term volatility.
Key Support Zone Below : A significant support zone (highlighted in green) is identified between approximately 3,100 and 3,150. This zone previously acted as strong support in mid-May and could be a key area for buyers to step in if the price experiences a deeper retracement.
All-Time High and Next Resistance Levels : The chart clearly marks an "All time high" at 3,500.10. Below this, a "Next Resistance" level is identified at 3,451.31. These represent the ultimate upside targets in a continued bullish scenario, with the latter being the more immediate target after breaking current resistance.
Disclaimer:
The information provided in this chart is for educational and informational purposes only and should not be considered as investment advice. Trading and investing involve substantial risk and are not suitable for every investor. You should carefully consider your financial situation and consult with a financial advisor before making any investment decisions. The creator of this chart does not guarantee any specific outcome or profit and is not responsible for any losses incurred as a result of using this information. Past performance is not indicative of future results. Use this information at your own risk. This chart has been created for my own improvement in Trading and Investment Analysis. Please do your own analysis before any investments.

7/16: Will Gold Reclaim 3350 or Fall to 3250?During today’s session, gold briefly broke through the 3352–3358 resistance zone, but due to news-driven pressure during the pullback, bullish momentum weakened, and the price retreated to the MA60 support level on the daily chart.
Given the significant retracement, there is a possibility that a short-term bottom may form during the upcoming Asian session, potentially leading to a retest of the 3337-3343/3352-3358 resistance area:
If the price breaks above this zone and holds above it after a pullback, the bullish trend could resume;
However, if it fails to break through or is rejected again, caution is warranted, as this could signal a larger-scale downtrend on the weekly chart, possibly targeting the 3250 area.
XAUUSD HEAD AND SHOULDER CHAAT PATTERN BEARISH ⏱ 4H Timeframe | Bearish Bias | Precision Setup
💡 Pattern Formed: Head & Shoulders
🔻 Market rejecting at right shoulder zone with bearish confirmation
---
🔽 Entry Level (Sell):
🟤 3,360 – 3,365 (Right shoulder rejection zone / supply area)
🛑 Stop-Loss (SL):
🔴 3,390 (Above the right shoulder + structure invalidation)
🎯 Take-Profit (TP):
🟢 3,210 – 3,200 (Measured move target + POI support zone)
📊 Risk:Reward Ratio:
✅ Approx. 1:4 — High probability setup

XAUUSDXAU/USD is the market symbol used to represent the value of one troy ounce of gold in U.S. dollars, making it a key indicator in both commodity and forex trading. Traders and investors closely monitor this pair as gold is often seen as a safe haven asset during times of economic or geopolitical uncertainty, with its price movements reflecting broader market sentiment regarding inflation, currency strength, and global economic health.

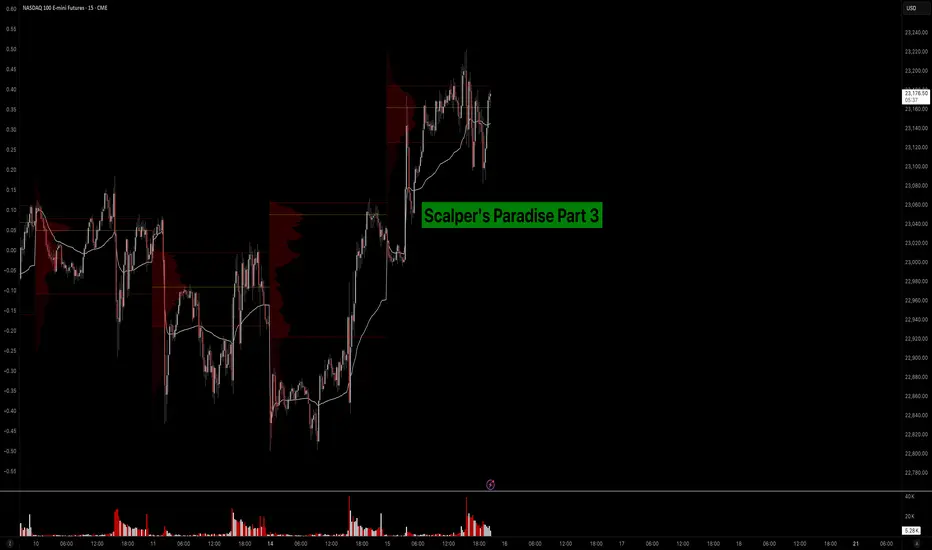
Scalper’s Paradise Part 3 – The Power of Order Flow and DOMWelcome back to Scalper’s Paradise! In this third part of the series, I want to take you into one of the most powerful tools in professional trading: Order Flow and the Depth of Market (DOM).
I chose this topic because during my time as an institutional trader, this was our entire world. We didn’t use indicators. We didn’t guess. We traded exclusively based on what we could see happening live in the DOM and Time & Sales. Every decision was made tick by tick, based on real market activity.
That experience shaped the way I view markets forever—and today, I want to share that perspective with you.
What Is Order Flow, Really?
To me, Order Flow is the most honest information the market can give you. It doesn’t predict, it reveals. It shows who is actually making moves right now. When I was sitting at my institutional desk, I didn’t look at moving averages or oscillators. I looked at who was being aggressive: were market buyers lifting offers, or were sellers smashing the bid?
Watching the tape (Time & Sales) and the footprint chart was like watching a fight unfold in real time. No filters, no guesses. Just raw interaction between buyers and sellers. That’s where real decisions are made.
The DOM: My Daily Reality as a Trader
The DOM (Depth of Market) was the first thing I looked at every morning, and the last thing I closed at night. It shows all visible limit orders resting at each price level. But there’s a catch: not everything you see is real.
In the institution, we were trained to spot real interest versus manipulation. Stacked bids might look strong, but if they disappear the moment price drops tells you that there was never a true intent. Iceberg orders were more interesting, when price gets hit again and again and doesn’t move, that usually meant someone was absorbing quietly.
Reading the DOM is like reading an X-ray of the market’s intentions. And yes, there’s a lot of noise, a lot of deception. But once you learn to read through it, it’s the most powerful tool you’ll ever have.
How We Used Order Flow on the Institutional Side
At the institution, we never chased price. That was rule number one. We let the market come to us (meaning: we used Limit Orders as often as possible) and we used Order Flow to guide every decision.
One of the most important concepts was absorption . If we needed to build a large long position, we didn’t just slam the ask. We would let sellers come in and hit our bids again and again and again. If price didn’t break lower, that told us we were in control.
On the flip side, when we needed to move the market , we switched gears. We used market orders aggressively to push through key levels, forcing reactions, triggering stops, and creating follow-through.
And yes, there were times when we intentionally created traps . We’d push price into obvious zones, make it look like a breakout, then fade it, because we knew how the market reacts afterwards. Order Flow was the only way to read those games in real time.
How You Can Use This as a Retail Trader
I know what you might be thinking: “I’m just a retail trader, how can I possibly use tools like Order Flow or DOM the way institutions do?”
The good news is: you don’t have to compete with institutions, you just need to read their intentions.
Here’s how I would approach it today:
1) Open a footprint chart and look for imbalances, areas where one side is clearly more aggressive. Watch for absorption or sudden volume spikes.
2) Watch the Time & Sales feed. Is there a flurry of trades hitting the ask, but price isn’t moving? That’s someone selling into strength.
3) Use the DOM around key areas like VWAP, previous day high/low, or liquidity clusters. Are orders getting pulled? Is size appearing suddenly? These are all signals.
You don’t need to be early. Let the big player act first, then confirm what you’re seeing across Order Flow and DOM. When everything aligns, that’s your edge.
Bringing It All Together
In Part 1, I shared how we used VWAP and Volume Profile as benchmarks to evaluate execution quality. In Part 2, I showed you how I identify institutional activity using raw volume and 10-second charts. And now, in Part 3, you’ve seen the real-time decision-making tools: Order Flow and DOM.
These aren’t indicators. They’re not theories. They’re the actual battlefield where institutions operate and where I learned to trade.
My goal with this series has always been simple: to give you access to the same mindset I used at the institutional level, but through a lens that makes sense for your reality as a retail trader.
Don’t try to outsmart the market. Observe it. Align with the big players. Let their behavior guide your decisions.
That’s how I learned to trade professionally—and it’s exactly how you can start thinking and acting like a pro, even without the size.
Part 1:
Part 2:
7/15: Watch for Long Opportunities Around 3343 / 3332–3326Good morning, everyone!
Yesterday, gold rose into the resistance zone before pulling back, testing support around 3343. After today’s open, the price continues to consolidate near this support level.
On the 30-minute chart, there is a visible need for a technical rebound, while the 2-hour chart suggests that the broader downward movement may not be fully completed. The MA60 support area remains a key level to watch.
If support holds firm, the price may form a double bottom or a multi-bottom structure, potentially leading to a stronger rebound.
As such, the primary trading strategy for today is to look for long opportunities on pullbacks, with key levels as follows:
🔽 Support: 3343, and 3332–3326 zone
🔼 Resistance: 3352–3358, followed by the 3372–3378 upper resistance band

XAUUSD Expecting bullish Movement Price has now entered a strong demand zone between 3310 to 3305, as highlighted on the chart. This area has previously acted as a key support, and current price action indicates potential for a bullish reversal.
Structure Breakdown
Wave A Strong bearish leg
Wave B Minor consolidation
Wave C Final push into demand zone (3310–3305)
Buy Entry Zone: 3310–3305
First Target: 3365
Second Target: 3380
Risk Management is essential. Always use stop loss based on your strategy

XAUUSD Technical And Fundamental AnalysisGold prices rise in early trade as fears of a global economic slowdown due to widening trade tensions reinforce the precious metal's role as a defensive hedge and safe-haven asset. Futures are up 0.5% to $3,382.70 a troy ounce, their highest level in three weeks, after President Trump said he will charge a 30% tariff on goods from the EU and Mexico--two of the U.S.'s largest trading partners. Meanwhile, investors await key U.S. economic data later this week, including CPI inflation figures. "Should the June data report higher-than-expected inflation, this could prompt a selloff in U.S. Treasuries and increase demand for the U.S. dollar this week," says Aaron Hill, chief analyst at FP Market.

XAUUSD WAS GOES TO DOWN TREND "I follow structure, not emotions.
The trend is bearish — I sell strength, not weakness.
My entry is smart, at a lower high or CHoCH retest.
My SL is tight — just above the invalidation point.
My TP is clear — near the next demand or previous low.
I don’t hope. I manage risk and trust my edge."
---
📉 Suggested Setup Based on This Chart:
(Use this only as example — always confirm with your own strategy.)
Entry: Near the most recent CHoCH retest or rejection wick at LH (around 3,360–3,365 zone)
Stop-Loss (SL): Just above the previous LH or supply zone (around 3,375)
Take-Profit (TP): Near next support / previous LL zone (around 3,305 or even 3,248)
Risk-Reward (RR): Target at least 2:5

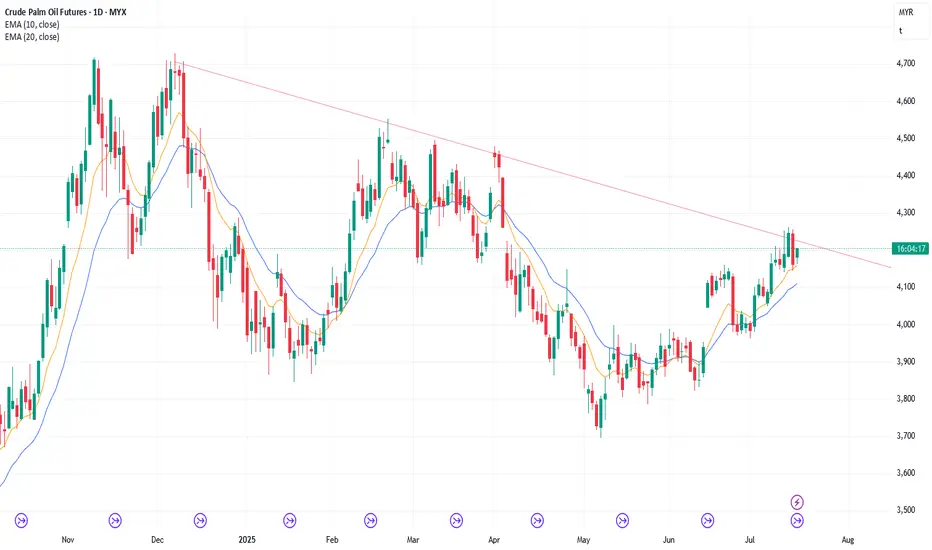
16/7/25 Can Bears Create A Follow-through Bear Bar?
Tuesday’s candlestick (Jul 15) was a big bear bar closing in its lower half with a prominent tail below.
In our last report, we said traders would see if the bulls could create a strong breakout above the bear trend line, or if the market would trade sideways and stall around the bear trend line area (4250-70) in the next few days instead.
The market stalled at the bear trend line and reversed lower, closing below Monday's low.
The bulls got another leg up to form the wedge pattern (Jul 3, Jul 9, and Jul 14).
They want a measured move based on the first leg up (July 1 to July 3), which will take the market to around the 4260 area.
So far, the market is forming a pullback following the wedge pattern at the measured move area.
They see Tuesday as a pullback and want it to have weak follow-through selling. They want a retest of the July 14 high.
The bulls need to create a strong breakout above the bear trend line with follow-through buying to increase the odds of a sustained move.
The bears want a higher high major trend reversal and a large wedge pattern (May 15, Jun 20, and Jul 14). They want a major lower high vs the April high.
They hope the bear trend line will act as resistance. So far, this is the case.
The next target for the bears is the 20-day EMA.
They must create follow-through selling to show they are back in control.
Production for July is expected to be around the same level as June or slightly higher.
Refineries' appetite to buy so far looks decent recently. A bit quiet on Tuesday.
Export: Down 6% in the first 15 days.
So far, the market could be forming a pullback following the wedge pattern.
For now, traders will see if the bears can create follow-through selling. Or will they fail to do so again, as they did on July 7 or July 11?
For tomorrow (Wednesday, Jul 16), traders will see if the bears can create a follow-through bear bar, even if it is just a bear doji.
Or will the market trade higher to retest the July 14 high instead? If this is the case, it will indicate the bears are not yet strong.
Andrew
CRUDE OIL Bearish Flag Breakout! Sell!
Hello,Traders!
CRUDE OIL is trading in a local
Downtrend and formed a bearish
Flag pattern and now we are
Seeing a bearish breakout
So we are bearish biased
And we will be expecting
A further bearish move down
Sell!
Comment and subscribe to help us grow!
Check out other forecasts below too!
Disclosure: I am part of Trade Nation's Influencer program and receive a monthly fee for using their TradingView charts in my analysis.
