SILVER Support Ahead! Buy!
Hello,Traders!
SILVER is going down now
But the price is trading in a
Long-term uptrend so we are
Bullish biased and after the
Price retests of the horizontal
Support support below
Around 37.20$ we will be
Expecting a bullish rebound
Buy!
Comment and subscribe to help us grow!
Check out other forecasts below too!
Disclosure: I am part of Trade Nation's Influencer program and receive a monthly fee for using their TradingView charts in my analysis.
Futures market

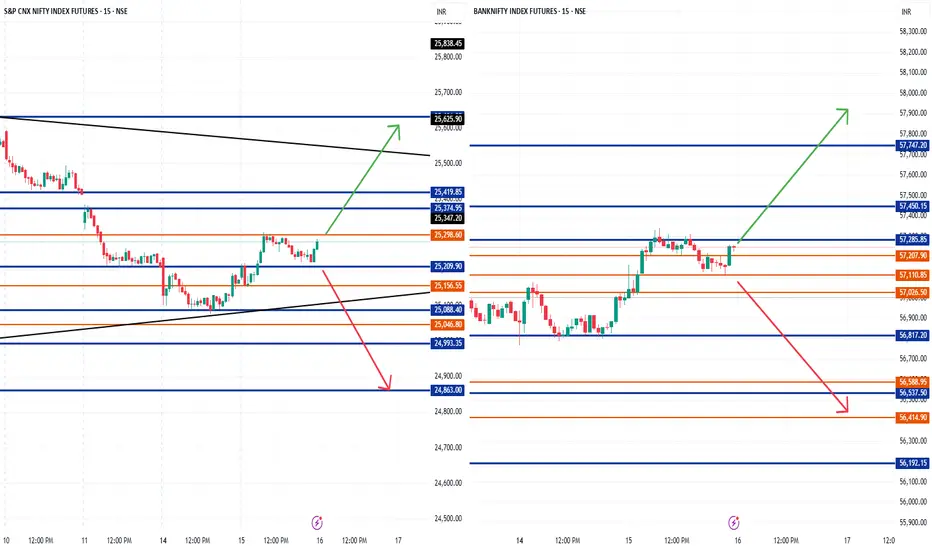
Nifty And Bank Nifty Key LevelsNifty And Bank Nifty Key Levels, Only Intraday Traders Use Only.. Use all these levels as a one.. Don't trade with stoploss and follow risk management.. Educational purpose only
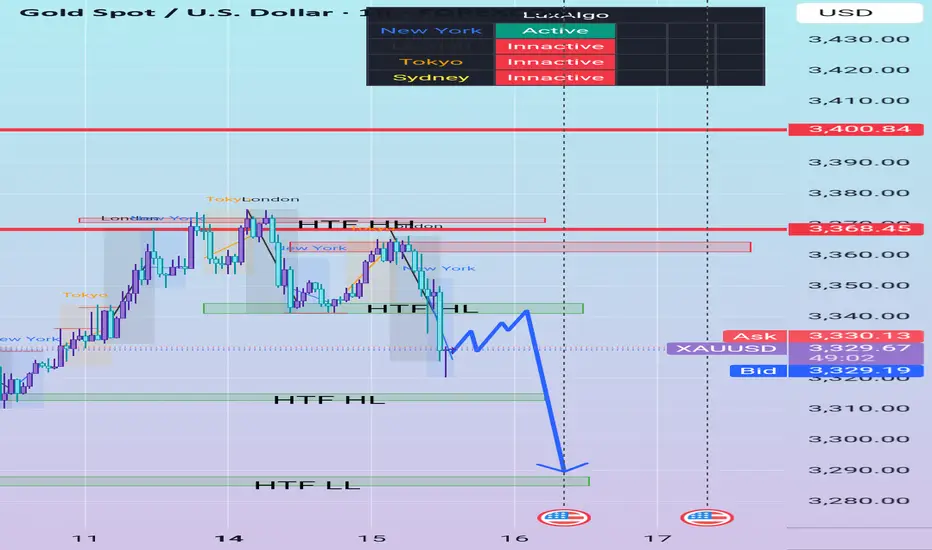
Bearish Continuation Idea on XAU/USDTimeframe: 1H
Session Context: Currently in New York, with London having just closed. Liquidity sweeps from London/NY overlapping zone are in play.
Step 1: Indication
HTF structure broke bullish to bearish with a clear break below a HTF Higher Low (HL) around 3,343–3,345.
This confirms Indication of bearish intent as market structure shifted from bullish → bearish.
The recent Swing High (3,368) was followed by strong selling momentum, showing institutional interest near previous liquidity pools.
Step 2: Correction
Price has retraced to test minor demand around the previous HL zone (green box).
Expecting liquidity collection above this area to trap late buyers and induce sellers.
The market is currently in Correction—a necessary pause after the break in structure to rebalance orders before continuation.
Step 3: Continuation Projection
If price respects the 3,343–3,345 correction zone and fails to reclaim the HTF HL:
Expect a lower high to form.
Entry would be ideal on a 5M–15M confirmation inside this corrective structure (lower timeframe BOS or SMC entry).
Targeting the HTF Lower Low (LL) at ~3,290, with potential for extended move toward 3,275 if NY volatility sustains.
Summary
Bias: Bearish
Reason: Structure Break (Indication), Pullback (Correction), Anticipating Downside Continuation
Confluences:
HTF Structure Break
Previous liquidity sweep from London
NY session volatility
Correction stalling beneath broken HL
Invalidation: A clean 1H close above 3,345–3,348 would invalidate the bearish bias and suggest a deeper retracement or reversal.
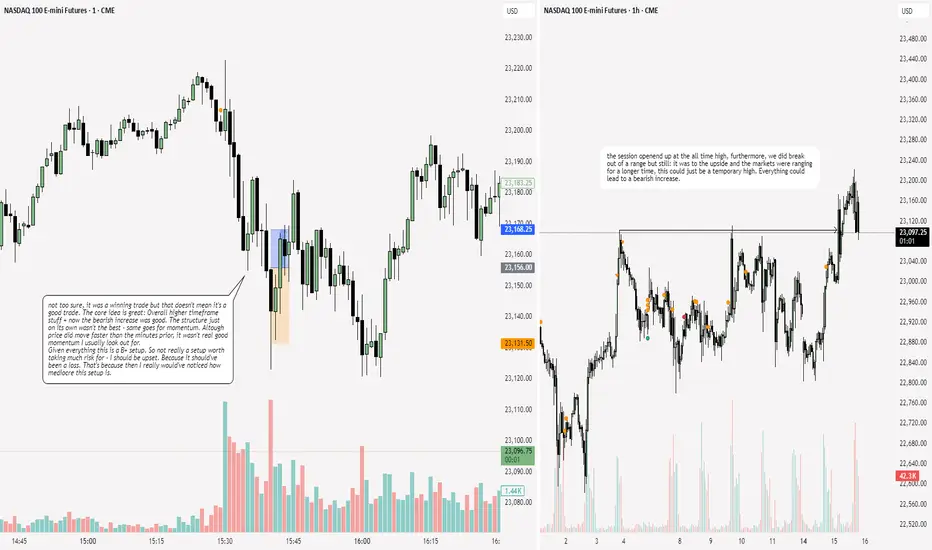
NQ: 218th trading session - recapYeaaa although I did make $2,000 profits it wasn't the best thing ever. I mean I gotta cut myself some slack: The higher timeframe bias was pretty good. And the structure wasn't too shabby. It really was the momentum that turned an A+/S tier setup into a B+ setup which is a HUGE jump.
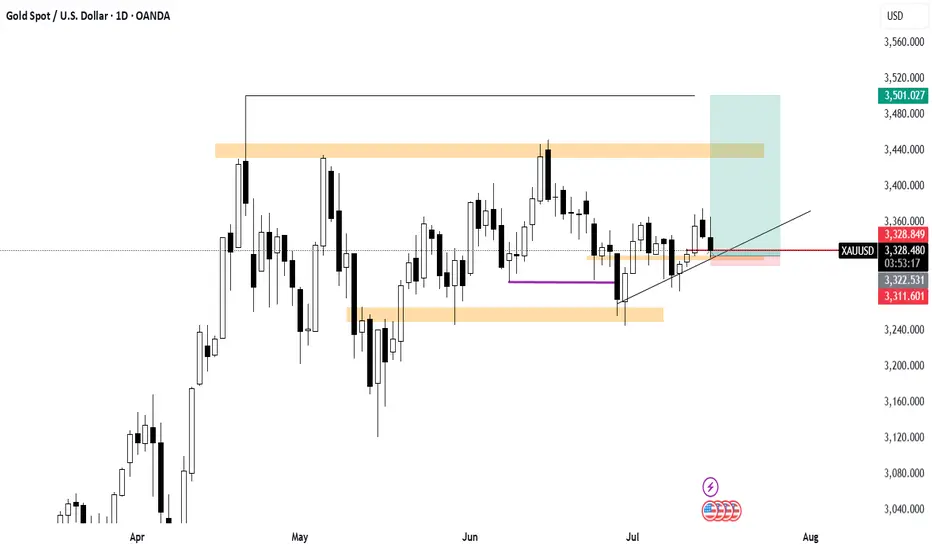
Gold about to hit and form a new all time highfor several weeks gold has been heading up, in a daily timeframe we see Gold heading up. after a retest of the 3321 level we we expect an aggressive to the upside.
we can hold this position for several days and weeks. patience is very crucial here.
Mid-Session Market ReviewMid-Session Market Review
S&P 500: After some initial volatility from the 8:30 news, the market accepted above the prior day’s levels but has since pulled back within range, consolidating just below the highs.
NASDAQ: The NASDAQ remains above all of yesterday’s levels and is currently balancing between the high of the day and the 23,100 level, showing a rotational pattern.
Russell 2000: This market is rotational within the prior day’s range and has accepted below the CVA and PVA. Potential trade opportunities might come with a pullback to the 2,245 area.
Gold: Gold has accepted below the prior value area and is still rotational within the CVA. Trade opportunities could present themselves near the prior day’s low.
Crude Oil: The market is quite choppy, hovering around the prior day’s low and value area low. Caution is advised, with potential long opportunities on a pullback, as long as conditions align.
Euro Dollar: The Euro is dropping significantly, moving below all key levels without much respect for them. This could provide short opportunities if there’s a pullback.
Yen: Similar to the Euro, the Yen is also pushing below previous levels. It’s getting choppy near the CVA low, so caution is needed until it shows more respect for those levels.
Natural Gas: The market is rotational within the prior day’s range and respecting the CVA high. Long opportunities might be possible if conditions are right.
Aussie Dollar: It’s showing some respect for the CVA low and is still rotational. There could be a potential long setup forming, depending on how it plays out.
British Pound: The Pound has accepted below all key levels, and a pullback to the CVA low might provide short opportunities, though caution is needed around the VWAP.

XAUUSDGOLD still on a uptrend in a bigger picture but we can probably have a pull back
We before breaking and closing outside 3400 or 3250 "there is nothing to do"

GOLD LONGPlease wait for the price 3330 to 3320
Buy after seeing the Hammer candle according to the stop and target
E 3330-3320
TP 3405
SL 3280

XAU AnalysisIf the price reaches the lower pips and confirms, you can consider buying for 300 to 500 pips.
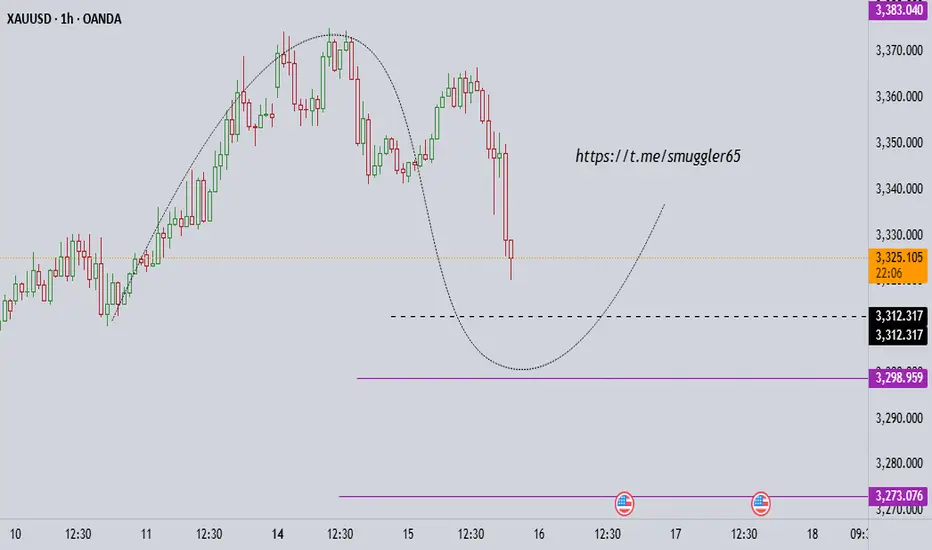
Gold Double Bottom Rejection - Bullish Confirmation PatternThere is currently a double bottom rejection pattern at play and price is reacting to an H4 TF demand zone. Confirmations to go long will be in this demand zone or the next one. But my money is on the current one.
Best thing to do is wait for an M15 supply to break to validate taking longs from the current demand. But the bulls are showing strength.

GOLD 1H CHART ROUTE MAP UPDATEHey Everyone,
Quick follow up on our 1H chart idea
We had a nice push up on the chart at the start of the week, coming close but just short of the 3381 gap. Still, it was a solid catch that respected our levels beautifully.
Following that, we cleared our 3353 Bearish Target, which also triggered the EMA5 cross and lock, confirming the move toward our 3328 retracement range, a level we hit perfectly.
As expected, we're now seeing a reaction in this 3328 zone, which remains key. We are watching this closely for a potential bounce. However, if price crosses and locks below 3328, the swing range will open, setting up the potential for a larger swing bounce from deeper levels.
We’ll continue using dips and key support zones for scalps and intraday bounces, aiming for 20–40 pips per level. The structure remains valid, and as mentioned before, our back-tested levels have consistently shown strong reaction zones over the past 24 months.
Updated Reminder of Key Levels:
BULLISH TARGET
3381
EMA5 CROSS & LOCK ABOVE 3381 opens
3416
EMA5 CROSS & LOCK ABOVE 3416 opens
3439
BEARISH TARGETS
3353 ✅ HIT
EMA5 CROSS & LOCK BELOW 3353 opens
3328 ✅ HIT
EMA5 CROSS & LOCK BELOW 3328 opens
3305
EMA5 CROSS & LOCK BELOW 3305 opens Swing Range:
3288
3259
As always, we’ll continue monitoring and sharing updates, as price reacts around these zones. Thank you all for the continued support, your likes, comments, and follows are genuinely appreciated!
Mr Gold
GoldViewFX

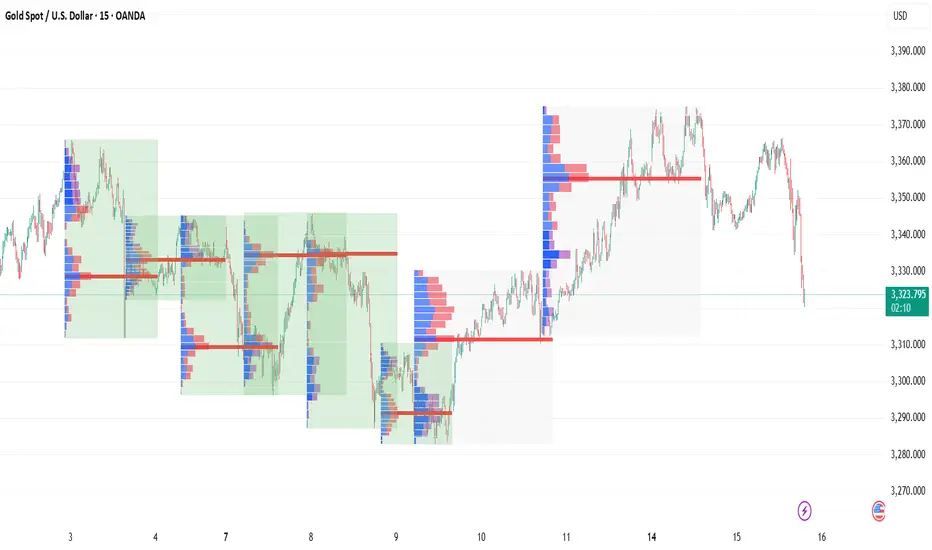
VOLUME PROFILE educationThere is a difference between the current wave and the previous wave, and the direction of the wave is also apparent.
GOLD - SHORT TO $2,800 (1H UPDATE)Yesterday's entry hit SL, as price pushed up a little higher for liquidity, ahead of today's CPI data.
I have entered another sell entry today at $3,353. Couldn't send analysis straight away as I was out & didn't have my laptop on me. But re-trying this analysis one last time. If SL is hit, we will wait for $3,400 entry.

GOLD - SHORT TO $2,800 (1H UPDATE)Gold sells are running in amazing profits! Price is now down 320 PIPS in profit from our entry at $3,353, within the Gold Fund for my investors.
Let me know how many of you are currently in this trade🤝

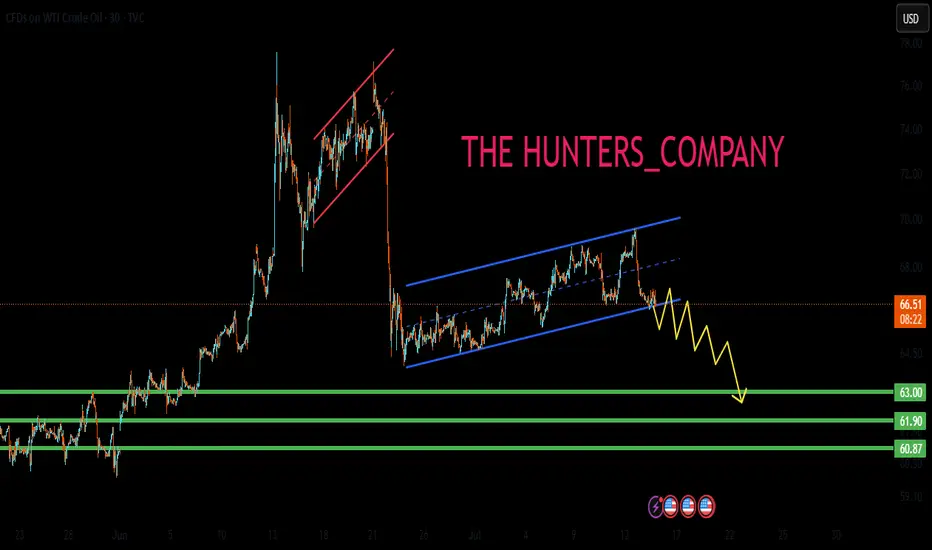
US OIL SELL...Hello friends🙌
🔊As you can see, this chart works well in forming a channel, and now that
we have witnessed a price drop, the price has reached the bottom of the channel, and given the previous heavy drop, the channel shows that the power is currently in the hands of sellers and it is likely that the specified targets will move.
🔥Follow us for more signals🔥
Trade safely with us
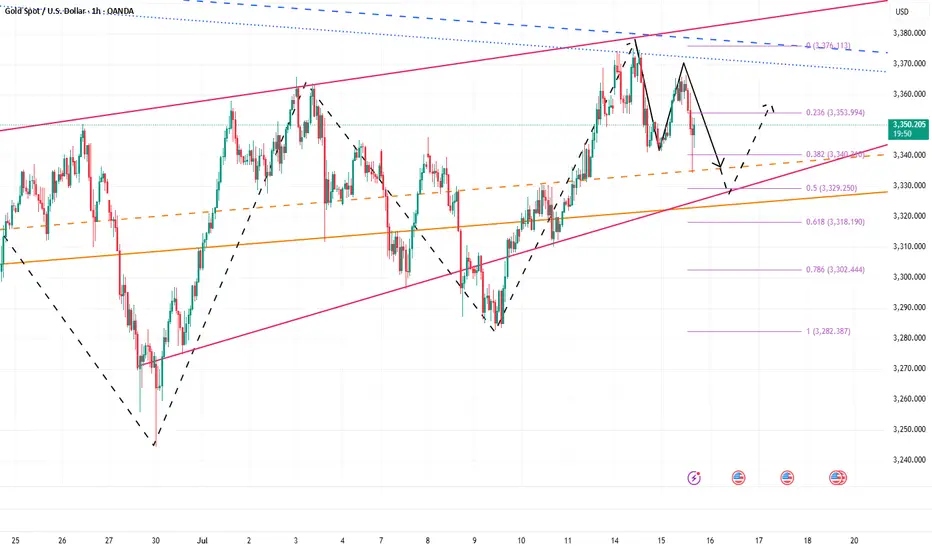
Don’t hesitate, a massive gold move Is brewingRefer to my previous trading idea. Gold retreated as expected. We almost caught the highest point of the day and shorted gold near 3365, and successfully hit TP: 3346, which enabled us to successfully profit 190pips in short-term trading, with a profit of nearly $10K, which is a good result in short-term trading.
Currently, the lowest point of gold in the retracement process has reached around 3335, which has fully released the short energy and vented the bearish sentiment in the market. All the bad news is out, which means good news! Although gold fell from 3375 to 3335, the retracement was as high as $40, but the rising structure has not been completely destroyed. The previous W-shaped double bottom support structure and the resonance effect of the inverted head and shoulder support structure still exist. As long as gold stays above 3325, gold bulls still have the potential to attack.
Moreover, after this round of retracement, the bearish sentiment of gold was vented, and the liquidity was greatly increased, attracting more buyers to actively enter the market. Gold may start a retaliatory rebound, and even touch 3375 again or even break through and continue to the 3380-3390 area.
So for short-term trading, I think we can try to go long on gold in the 3335-3325 area appropriately, first looking forward to gold regaining lost ground: 3350-3360 area, followed by 3380-3390 area.
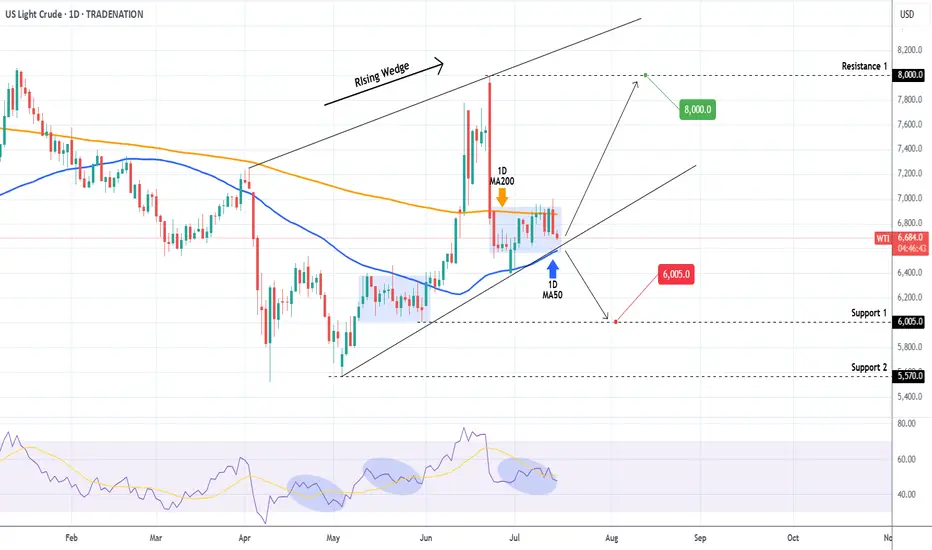
WTI OIL Is it forming a bottom?WTI Oil (USOIL) Has been trading within a Rising Wedge pattern and since June 02, it has turned its 1D MA50 as a Support. Technically the recent 2-week consolidation within the 1D MA50 (blue trend-line) and 1D MA200 (orange trend-line) is a bottom formation on the Higher Lows trend-line of the Rising Wedge.
As long as the 1D MA50 holds, we remain bullish, targeting $80.00 (Resistance 1). If the 1D MA50 breaks (closes a 1D candle below it), we will take the loss, and turn bearish instead, targeting $60.05 (Support 1).
-------------------------------------------------------------------------------
** Please LIKE 👍, FOLLOW ✅, SHARE 🙌 and COMMENT ✍ if you enjoy this idea! Also share your ideas and charts in the comments section below! This is best way to keep it relevant, support us, keep the content here free and allow the idea to reach as many people as possible. **
-------------------------------------------------------------------------------
Disclosure: I am part of Trade Nation's Influencer program and receive a monthly fee for using their TradingView charts in my analysis.
💸💸💸💸💸💸
👇 👇 👇 👇 👇 👇
GOLD AT CROSSROADS: CAPITALIZING ON MARKET SHIFTS FUNDAMENTAL ANALYSIS
With Gold currently trading at 3357, we're at a pivotal moment. The confluence of heightened geopolitical tensions and recent decisive US government actions – including renewed tariff threats and evolving monetary policy signals – is creating a clear trajectory. Analysis indicates a compelling opportunity to initiate aggressive sell signals, targeting 3345 and then pushing for 3330. Risk is rigorously managed with a disciplined stop loss at 3380. This is a strategic move, designed to profit from the immediate downward pressures stemming from the global political and economic landscape, as the market re-calibrates to these powerful forces."

Gold Trading Update: What's Next for Gold This Week? Hello Traders! 👋
In my last post, I flagged two prime zones for selling Gold, and guess what? The first one has already delivered! 🎯 The Hourly IFVG (Inversion Fair Value Gap) between 3360-3365 triggered perfectly before today's CPI release, playing out like a charm. 💰
Now, all eyes are on the next level: the 4H FVG, which will act as an IFVG. This is our second potential entry point, and I’m targeting the Take Profit levels as outlined. Let’s see if this setup unfolds as beautifully as the first! 👀
What’s your take on Gold’s direction this week? Are you bullish, bearish, or sitting on the fence? 🧠 Drop your thoughts in the comments below, and let’s spark some lively discussion! 💬 Don’t forget to like, follow, and share your views to keep the trading community buzzing! 🚀

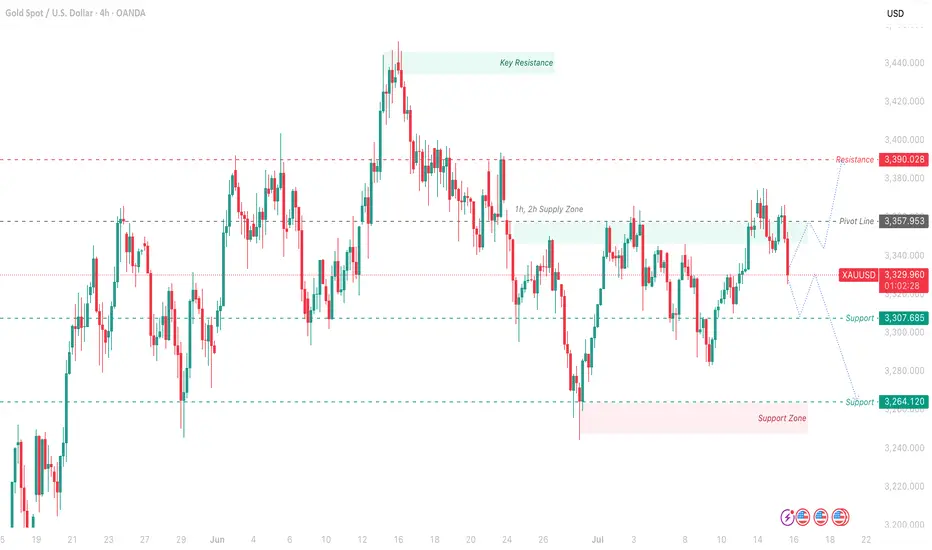
GOLD Outlook – Bearish Confirmed Post-CPIWith the CPI data released at 2.7%, gold’s bearish momentum is confirmed below the Pivot Line of 3,357.953 USD.
The market reaction suggests no immediate Fed rate cuts, supporting downward pressure. Expect a move toward Support at 3,307.665 USD and the Support Zone around 3,264.120 USD. A close above 3,357.953 USD on a 1H or 4H candle could indicate a bullish reversal toward Resistance at 3,390.028 USD.
Trade Setup:
Short Entry: Near 3,357.953 USD with bearish confirmation, Stop Loss above 3,390.028 USD.
Take Profit: Initial target at 3,307.665 USD, with a second target at 3,264.120 USD.
Long Entry: Only if price breaks and holds above 3,357.953 USD, with a Stop Loss below 3,250 USD, targeting 3,390.028 USD.
Pivot Line: 3,357.953 USD
Support: 3,307.685 USD – 3,264.120 USD (Support Zone)
Resistance: 3,390.028 USD – ~3,400 USD (Key Resistance)
1h, 2h Supply Zone: Between 3,357.953 USD and 3,390.028 USD
XAU/USD - Potential TargetsDear Friends in Trading,
How I see it,
1) A clean and decisive break above PIVOT area is required for broader upside.
2) If price remains below PIVOT area the potential for more downside is high.
2) Watch 3300- 3290 DEMAND closely.
3) If this demand area is breached - 3270 is next.
I sincerely hope my point of view offers a valued insight.
Thank you for taking the time to study my analysis.

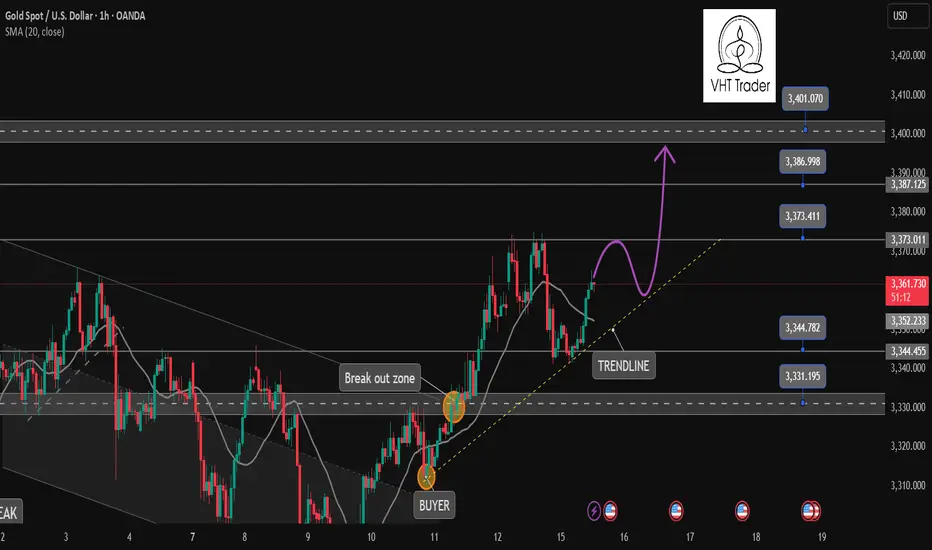
Gold is coming to our target✏️ OANDA:XAUUSD As analyzed on Monday, the market touched the BUY zone at 3345 and continued the bullish wave structure, heading toward the 3400 level. If gold breaks above 3373, it will likely continue its strong upward momentum. Therefore, it is advised to avoid trading against the trend once the 3373 level is broken.
On the other hand, if gold breaks below the key support level at 3343 (yesterday's U.S. session barrier), the current uptrend may temporarily pause. In that case, gold will need to find new momentum to establish a fresh market trend.
📉 Key Levels
SUPPORT: 3343 - 3330 - 3313
RESISTANCE: 3373-3387-3400
Hold BUY order 3345 with target 3400
SELL trigger: Rejection of prices 3373, 3387 with confirmation from sellers
SELL 3400 Strong resistance zone
Leave your comments on the idea. I am happy to read your views.