Long USDCAD
The streets all knows about this.
Use little percentage of your portfolio and keep adding to it. Will it develops,
This will take months to fully develop ... Be patient ...
Futures market

Gold: Data, Tariffs & Trading LevelsThis week is packed with market news and economic data 😣. Key focuses include the US CPI, PPI, retail sales data, and the University of Michigan's preliminary consumer sentiment index. Additionally, former US President Trump plans to make a "major announcement" on Russia; the Federal Reserve will release the Beige Book (Economic Conditions Survey); and the CFTC's weekly positioning report is also worth monitoring 📊.
Over the weekend, Trump imposed tariffs on the EU and other regions, prompting a strong counterattack from the EU. The subsequent evolution of the situation requires continuous tracking, as it has triggered sharp market volatility pushing toward the 3400 mark 😱. Trump has recently announced frequent tariff policies (e.g., 30% tariffs on the EU and Mexico, and threats of 100% tariffs on Russia), amplifying market uncertainty. While this theoretically benefits gold's safe-haven demand, the actual impact requires close observation of institutional capital flows 🤔.
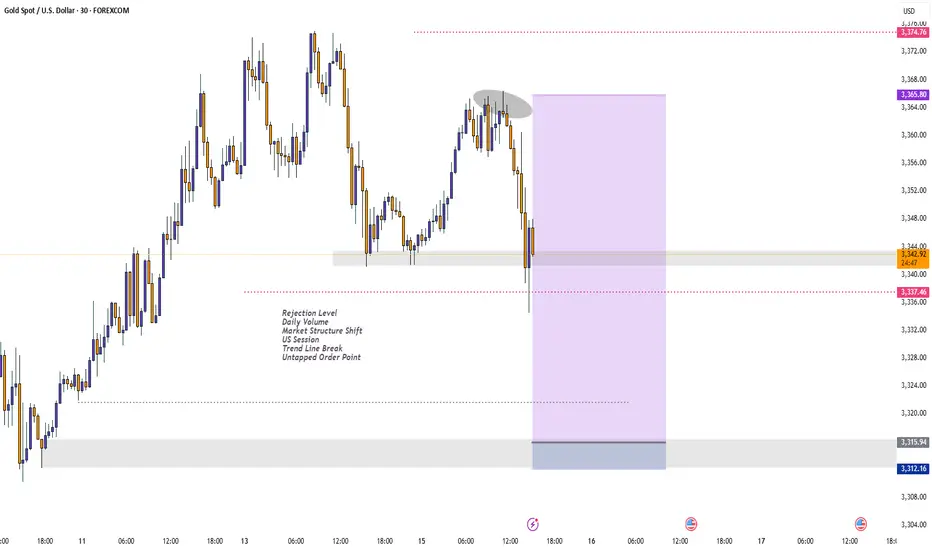
Gold prices consolidated at the bottom after a sustained pullback last night and extended their rebound this morning. Key pressure levels have undergone a support-resistance flip. The current gold rebound is merely a secondary confirmation of the 30-minute top structure, and after surging to 3365 in the afternoon, short-term signs of pressure have emerged 😕. In a volatile market, if prices start to consolidate sideways, it may signal the end of this oscillating upward trend, with a shift to a downward phase ahead.
Given market sensitivity ahead of the CPI data release, it’s advisable to focus on a volatile pullback trend 🧐. After today’s rebound, key attention should be on the 3363-3368 range as a shorting zone, with the long/short defensive level set at yesterday’s intraday high of 3375. Downside support is focused on the 3340-3335 range 🔍

BuyRejection Level
Daily Volume
Market Structure Shift
US Session
Trend Line Break
Untapped Order Point
Expecting Gold bullish Movement The chart illustrates a potential bullish reversal setup for Gold XAU/USD on the 15-minute timeframe Price action has recently tested and respected a key demand zone marked as the Kee point around the 32853 level This area acted as strong support with multiple rejections suggesting buyer interest
Following this, the price has started forming higher lows and higher highs indicating the beginning of a bullish structure The large blue arrow suggests bullish momentum is expected to continue, aiming for upside targets
Key Levels
Kee Point Support Zone 3285 Crucial area where the reversal initiated
Target 1: 3316 First resistance level and a potential take-profit zone
Target 2: 3330 Final bullish target if momentum sustains
Outlook
As long as the price holds above the Kee Point, bullish continuation is favored
Breaking and closing above Target 1 could lead to further gains toward Target 2
A break below the Kee Point would invalidate this bullish scenario
This setup presents a potential buying opportunity with defined upside targets contingent on sustained bullish pressure

Gold 30Min Engaged ( Bearish Reversal Entry Detected )Time Frame: 30-Minute Warfare
Entry Protocol: Only after volume-verified breakout
🩸Bearish Retest - 3347.5
➗ Hanzo Protocol: Volume-Tiered Entry Authority
➕ Zone Activated: Dynamic market pressure detected.
The level isn’t just price — it’s a memory of where they moved size.
Volume is rising beneath the surface — not noise, but preparation.
🔥 Tactical Note:
We wait for the energy signature — when volume betrays intention.
The trap gets set. The weak follow. We execute.
Gold 30Min Engaged ( Bearish Reversal Entry Detected )
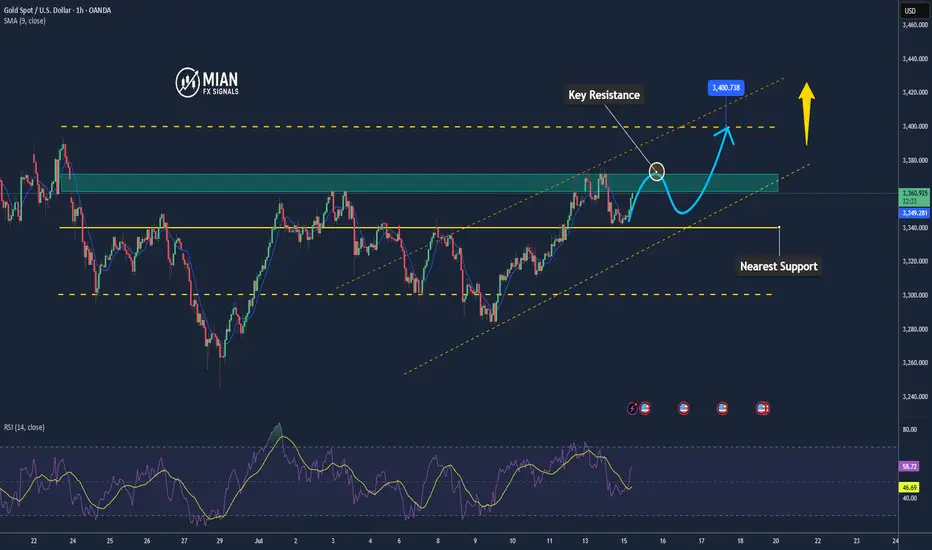
Gold Likely to Extend Gains as USD Weakens, but Faces Resistance📊 Market Move:
Gold surged to a three-week high near $3,370/oz, driven by safe-haven demand amid renewed trade tensions between the U.S. and EU/Mexico and threats of a 100% tariff on Russian imports.
Investors are now focused on upcoming U.S. CPI data, which could trigger sharp moves if inflation comes in below expectations.
📉 Technical Analysis:
• Key Resistance: ~$3,365–$3,372; a breakout could open the way to $3,400–$3,440
• Nearest Support: ~$3,340 (S1), then ~$3,326 (SMA50), and deeper at $3,300–$3,320 (Fibonacci zone)
• EMA: Price remains above short-term EMAs (20/50/100), suggesting a continuing bullish bias
• Candlesticks / Volume / Momentum:
• RSI is neutral-to-bullish around 54; MACD shows strengthening bullish momentum
• Bollinger Bands are narrowing, signaling potential for a breakout
📌 Outlook:
Gold may continue edging higher or consolidate around the $3,365–$3,372 resistance zone if no new geopolitical shocks occur. However, if U.S. CPI comes in below expectations or if USD/Yields weaken, gold could rally further toward $3,400–$3,440.
________________________________________
💡 Suggested Trading Strategy
🔻 SELL XAU/USD at: $3,370–3,373
🎯 TP: 40/80/200 pips
❌ SL: $3,376
🔺 BUY XAU/USD at: $3,340–3,337
🎯 TP: 40/80/200 pips
❌ SL: $3,334
Gold Analysis and Trading Strategy | July 15✅ Fundamental Analysis
🔹Gold prices surged and then retreated yesterday, mainly due to risk-off sentiment triggered by Trump’s announcement of a potential 30% tariff on EU imports. However, this sentiment was offset by the EU’s softened stance, indicating that “negotiation is still possible.” Additionally, the strength in both the U.S. Dollar Index and Treasury yields added pressure on gold.
🔹Geopolitical risks continue to rise. The EU is preparing to impose retaliatory tariffs on €72 billion worth of U.S. goods, while Trump has threatened a 100% tariff on Russian products. The ongoing Russia–Ukraine conflict also has the potential to escalate further, adding underlying support for gold.
🔹Today, the U.S. CPI data will be released — a key event for market participants. A higher-than-expected CPI figure will likely reinforce expectations that the Fed will maintain high interest rates, which is bearish for gold. Conversely, a weaker-than-expected reading may boost rate-cut expectations and support gold prices.
✅ Technical Analysis
🔸Gold failed to break the key resistance at $3375. The daily candlestick closed with a long upper shadow and a bearish body, indicating strong selling pressure from above. The MACD is showing early signs of a bearish crossover, suggesting short-term weakness.
🔴 Key Resistance Levels: $3360–3365, $3375 (critical level)
🟢 Key Support Levels: $3340, $3325 (major downside support)
✅ Trading Strategy Reference
🔺 Long Position Strategy:
🔰 If the price pulls back and stabilizes around $3335–3340, consider entering a light long position. Set a stop-loss below $3325 and aim for a target of $3355–3365.
🔰 If the price breaks above $3365 and holds, consider following the breakout with a long position, targeting $3375–3385.
🔻 Short Position Strategy:
🔰 If the price rebounds to $3360–3365 and faces resistance, consider shorting. Set a stop-loss above $3365 and aim for a target of $3340. If that level breaks, look for $3330.
🔰 If the price breaks below $3330, consider a momentum short toward the $3320 zone.
✅ Gold is likely to remain in a consolidation range during the European session. Maintain a buy-low, sell-high strategy with light positions and strict stop-losses. Pay close attention to the support at $3340 and resistance at $3365. Before the U.S. CPI data release, it's recommended to manage risk and control position sizes to avoid unexpected volatility.
🔥Trading Reminder: Trading strategies are time-sensitive, and market conditions can change rapidly. Please adjust your trading plan based on real-time market conditions. If you have any questions or need one-on-one guidance, feel free to contact me🤝

Price hit the target for the day Price hit the target for the day after taking the Asian high and other confluence


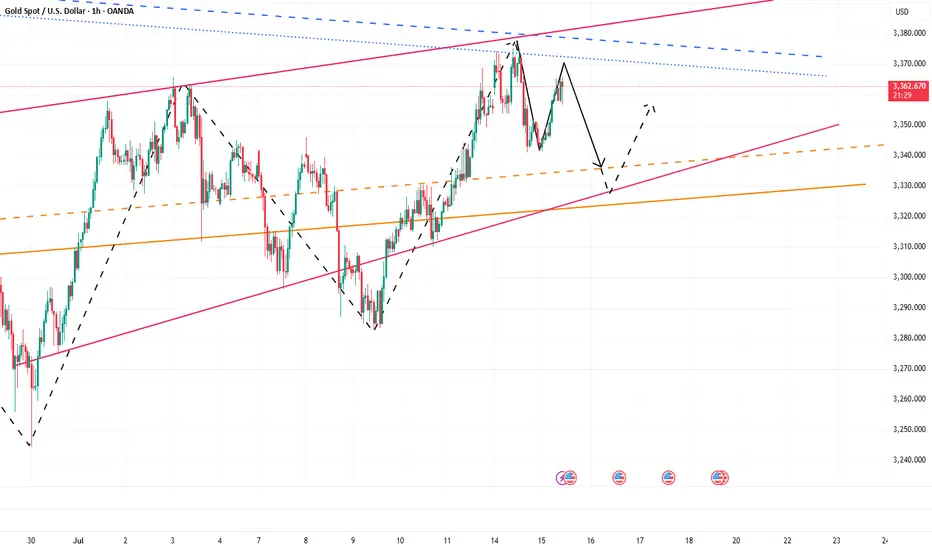
TIME TO BUY GOLD From the daily time frame we can see that gold has respected a rising trend line, so this rising trend line is acting as support.
But going forward we are bullish on gold,so we wait for price to retest the rising trend line on the daily time frame and from there we buy.
Levels to look out for in order to buy:3315,3320,3325,3330

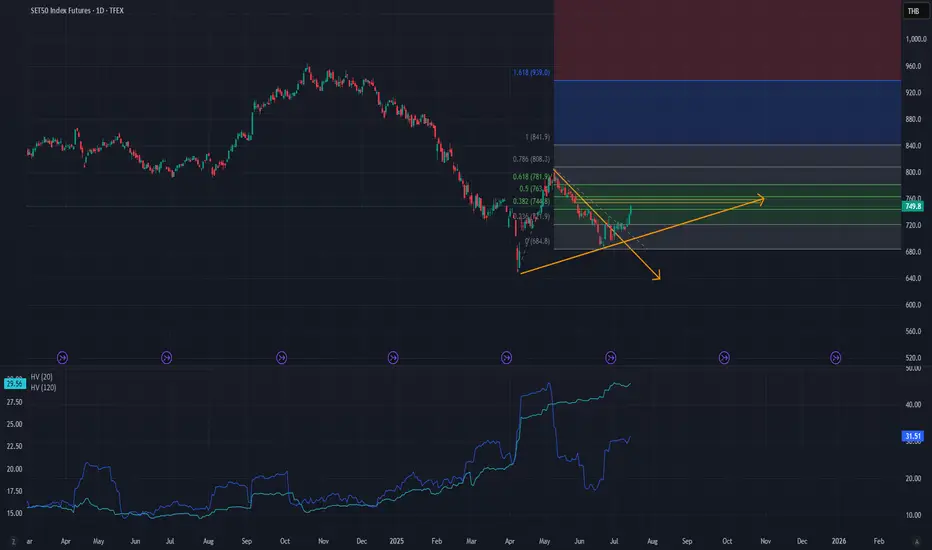
Analysis on S50 Futures: Almost hit the first targetDear all
if you are looking for long opportunity, it is not!.
The big resistance is there around 760-763
So either it is broken up or retrace first, then make a decision to buy follow or wait first.
Best Regards,
TraderPP
Pre-Market PrepToday’s market insights show a lot of potential opportunities across the board:
S&P 500: We’re in a strong upward imbalance, trading above the prior day’s range and value area. The focus is on long opportunities, but waiting for confirmation on any pullbacks.
NASDAQ & Russell 2000: Similar to the S&P, both are also in an upward imbalance. For the Russell, there’s a specific focus on looking for long setups around the prior day’s high.
Gold: The market is rotational within the prior day’s range and value area, with a slight bias toward looking for long opportunities from the lower end of that range.
Crude Oil: After some initial volatility, it has settled back into the prior day’s range. Long opportunities look promising, especially on a pullback to the CVA low.
Euro Dollar: The market is a bit low on volume and holding below the CVA. Longs are considered if we see acceptance back into that area, while shorts are on the table if we remain below the prior day’s value area.
Yen Dollar: Trading below the prior day’s range and value area, the focus is on short opportunities, especially if we see continued acceptance below key levels.
Aussie Dollar: It’s rotational and currently above the prior day’s value area, making both long and short opportunities viable, depending on how the market moves.
Nat Gas: It’s also rotational within the prior day’s range, but further analysis is needed after updating levels.
Overall, the strategy is to trade smart, confirm setups, and stay aware of the bigger trends while managing risk.

CPI Long Off of March's Monthly Open Possible NY SessionIf I can get a small doji formed after CPI at around the orange line (March's Monthly Open) I will enter Long.
Once entered, stop loss is 120 ticks and target the high 325 ticks.
I believe CPI will be whipsawed and range bound until NY opens up swinging
This is the 2 Hour chart for the pattern.
15 Minute entry time frame

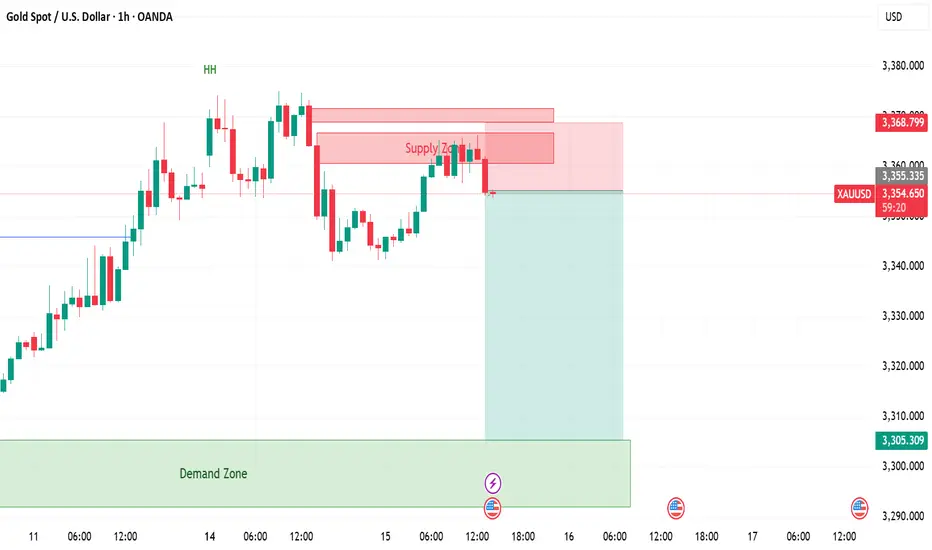
XAUUSD | GOLD | SellGot the confirmation from 15 minute timeframe.
Sell Gold till demand zone.
R:R 1:3,8

TIME TO BUY GOLD From the daily time frame you can see that gold has respected a rising trending, so this rising trend line is acting as support.
But going forward we are bullish on gold, so we wait for price to come and retest that rising trend line on the daily time frame and then we buy.
Levels to look out for in order to buy:-3310,3315,3325,3330

Gold’s Uptrend Is a Mirage, Bears Are Lurking Beneath!Gold repeatedly touched around 3375 yesterday and then fell under pressure, proving that there is strong resistance above. Moreover, after gold retreated and touched around 3341 yesterday, it did not recover in time and stand above 3350. It was not until today that it rebounded and touched around 3365. The rebound cycle has been extended to the present, and the rebound strength is not very strong.
Since gold retreated, it has not been able to recover the lost ground in time. Gold is under pressure in the 3360-3370 area in the short term. If gold cannot successfully break through this resistance area during the day, then gold will retreat again, and will refresh the 3341 low again, and continue to the 3335-3325 area.
So for short-term trading, I think we can try to short gold in the 3360-3370 area appropriately, looking at the target area: 3350-3340
The battle for gold 3375-40 has begun, and CPI is coming!The current market has entered a short-term shock consolidation phase. Taking advantage of the temporary calm of the market, I would like to share my judgment and strategy with my brothers. I still tend to be bullish in the medium term. Yesterday's trend just verified my point of view. If the bulls want to break through the 3375 line, they must first complete the "deep squat wash", and this wave of retracement has also brought good profits to both our long and short traders. Friends who follow should have gained.
But the core of today is the CPI inflation data. As a heavy macro event, the recent forward-looking data (such as employment and labor market) is likely to be bearish for gold. The market has formed a consistent expectation. In this case, I have to temporarily put aside the long thinking and turn to short. My point of view is that as a qualified trader, I have always attached great importance to the data market. Whether it is non-agricultural, CPI or interest rate resolution, I have never easily made mistakes in grasping this kind of structural drive. Since the market has locked the focus of long and short positions in the core range of 3375-3340, we must face up to this structural competition. If the judgment is wrong this time, I will re-evaluate whether I should continue to participate deeply in this obvious data expectation transaction, but for now, I must respect the game logic of the market.
Operation strategy reference:
Currently, the 3360-3366 area can be lightly shorted. If it touches the 3370 line before the CPI is released, it can be appropriately covered; the stop loss is clearly set above 3375. Once it breaks through, leave the market decisively without hesitation. The lower target is 3350-3340 first. If it breaks, continue to look down to the 3330 area.

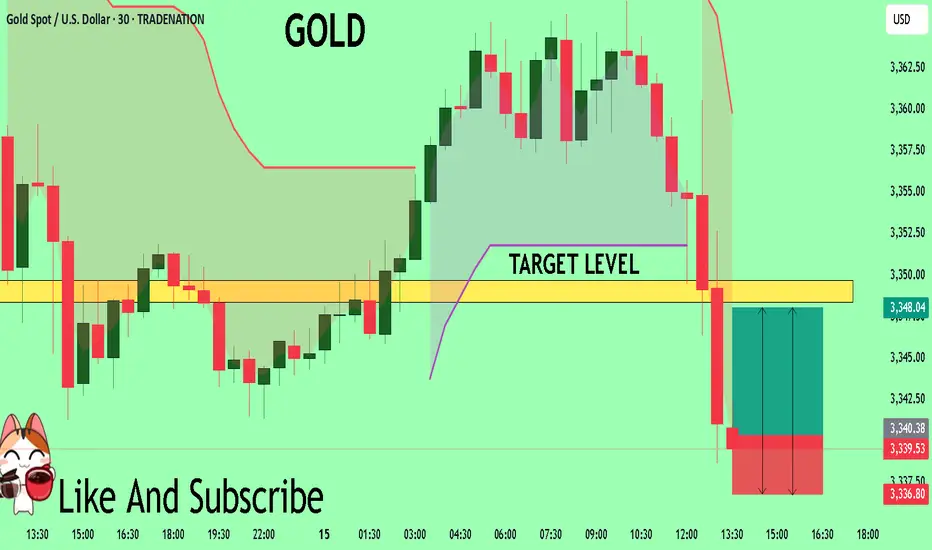
GOLD The Target Is UP! BUY!
My dear subscribers,
GOLD looks like it will make a good move, and here are the details:
The market is trading on 3340.39 pivot level.
Bias - Bullish
My Stop Loss - 3336.8
Technical Indicators: Both Super Trend & Pivot HL indicate a highly probable Bullish continuation.
Target - 3348.3
About Used Indicators:
The average true range (ATR) plays an important role in 'Supertrend' as the indicator uses ATR to calculate its value. The ATR indicator signals the degree of price volatility.
Disclosure: I am part of Trade Nation's Influencer program and receive a monthly fee for using their TradingView charts in my analysis.
———————————
WISH YOU ALL LUCK
XAUUSD 1:4 R Trade Idea - Bullish on gold - ICT1:4 RR trade idea on gold, we are at the daily FVG and aiming for the -OB on the 2hr.

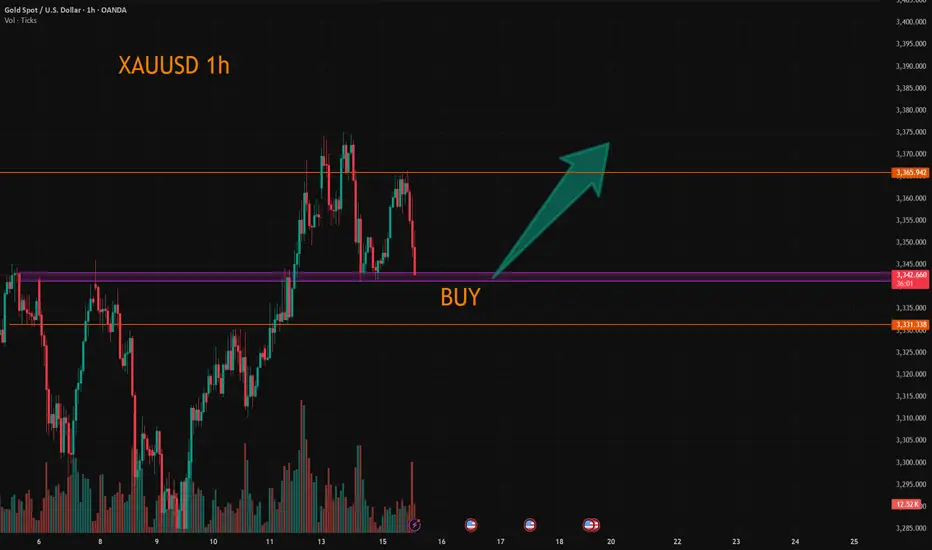
XAUUSD:Continue to go long
The gold price has just fallen after being pressured by the 3365 level. Currently, there are no obvious signs of a bottoming out. However, the 3340-43 range is the support position from the previous several declines. Here, one can lightly participate in the bullish orders. If going further down, the 3330 level is an important support point. Both of these positions can be utilized to go long.
Then the trading strategy:
BUY@3340-43
TP:3360-65
If the price retraces to the 3330 level, increase the position of the long bet. The goal remains the same. I will keep you informed if there are any changes.
More detailed strategies and trading will be notified here ↗↗↗
Keep updated, come to "get" ↗↗↗
XAUUSD, GOLDBullish view on GOLD for New York session, Daily FVG, if price taps in will look for confirmations to go long

Gold to continue downward trendXAUUSD 1H chart post-CPI data: Current trend suggests a drop to 3,282 from 3,349.54. Watch support at 3,341-3,349; a break below could confirm. #Gold #Trading #XAUUSD #CPI
