Bearish reversal off 38.2% Fibonacci resistance?WTI Oil (XTI/USD) is rising towards the pivot and could reverse to the 1st support which is a pullback support.
Pivot: 70.08
1st Support: 65.56
1st Resistance: 73.54
Risk Warning:
Trading Forex and CFDs carries a high level of risk to your capital and you should only trade with money you can afford to lose. Trading Forex and CFDs may not be suitable for all investors, so please ensure that you fully understand the risks involved and seek independent advice if necessary.
Disclaimer:
The above opinions given constitute general market commentary, and do not constitute the opinion or advice of IC Markets or any form of personal or investment advice.
Any opinions, news, research, analyses, prices, other information, or links to third-party sites contained on this website are provided on an "as-is" basis, are intended only to be informative, is not an advice nor a recommendation, nor research, or a record of our trading prices, or an offer of, or solicitation for a transaction in any financial instrument and thus should not be treated as such. The information provided does not involve any specific investment objectives, financial situation and needs of any specific person who may receive it. Please be aware, that past performance is not a reliable indicator of future performance and/or results. Past Performance or Forward-looking scenarios based upon the reasonable beliefs of the third-party provider are not a guarantee of future performance. Actual results may differ materially from those anticipated in forward-looking or past performance statements. IC Markets makes no representation or warranty and assumes no liability as to the accuracy or completeness of the information provided, nor any loss arising from any investment based on a recommendation, forecast or any information supplied by any third-party.
Futures market

Bullish reversal off major support?The Gold (XAU/USD) has bounced off the pivot and could rise to the 1st resistance which is an overlap resistance.
Pivot: 3,301.09
1st Support: 3,280.12
1st Resistance: 3,343.92
Risk Warning:
Trading Forex and CFDs carries a high level of risk to your capital and you should only trade with money you can afford to lose. Trading Forex and CFDs may not be suitable for all investors, so please ensure that you fully understand the risks involved and seek independent advice if necessary.
Disclaimer:
The above opinions given constitute general market commentary, and do not constitute the opinion or advice of IC Markets or any form of personal or investment advice.
Any opinions, news, research, analyses, prices, other information, or links to third-party sites contained on this website are provided on an "as-is" basis, are intended only to be informative, is not an advice nor a recommendation, nor research, or a record of our trading prices, or an offer of, or solicitation for a transaction in any financial instrument and thus should not be treated as such. The information provided does not involve any specific investment objectives, financial situation and needs of any specific person who may receive it. Please be aware, that past performance is not a reliable indicator of future performance and/or results. Past Performance or Forward-looking scenarios based upon the reasonable beliefs of the third-party provider are not a guarantee of future performance. Actual results may differ materially from those anticipated in forward-looking or past performance statements. IC Markets makes no representation or warranty and assumes no liability as to the accuracy or completeness of the information provided, nor any loss arising from any investment based on a recommendation, forecast or any information supplied by any third-party.

Analysis of the latest trend of gold and precise trading strategAnalysis of the latest trend of gold and precise trading strategies:
Core contradictions in the current market
Safe-haven support vs. dollar suppression
Gold bullish:
Trump's tariff increase on Japan and South Korea (effective on August 1) triggered market risk aversion, and US stocks fell.
The People's Bank of China has increased its gold holdings for 8 consecutive months, and long-term buying is stable.
Gold bearish:
The US dollar index rose to a one-week high (97.67), suppressing gold denominated in US dollars.
Technically, the strong resistance of $3345 has not been broken, and the bullish momentum is insufficient.
Key price breakthrough:
Break above 3345: Confirm the bullish trend, target 3380-3400.
Break below 3275: May accelerate the callback to the 3250-3230 support area.
Key technical signals
1. 4-hour level
Obvious pressure: 3345 forms a double top pressure, MACD golden cross momentum is exhausted, and if the dead cross will strengthen the callback.
Short-term support: 3280-3275 (if it falls below, look at 3250).
2. 1-hour level
Short-term bearish: The moving average is in a bearish arrangement, and the price rebounds weakly after falling below 3295.
Oversold rebound opportunity: If a long lower shadow or MACD bottom divergence appears near 3280, you can bet on short-term longs.
Today's precise trading plan
Strategy 1: Short-term rebound short (main strategy)
Entry point: 3323-3325 light position short, stop loss 3332 (to prevent false breakthroughs).
Target: 3300→3280 (if it breaks below 3280, you can hold and look at 3275).
Logic: 3345 resistance is effective + strong US dollar + 1-hour moving average suppression.
Strategy 2: Short-term long on pullback (auxiliary strategy)
Entry point: 3285-3295 stabilize and then long (need K-line to close positive or MACD golden cross to confirm).
Stop loss: below 3280, target 3310-3320.
Logic: support at the lower edge of the range + risk aversion may be repeated.
Strategy 3: Breakout and follow
Break above 3345: chase long, target 3360-3380, stop loss 3330.
Break below 3275: wait and see whether the decline accelerates, do not buy against the trend.
Risk control and key tips
Strict stop loss:
Short stop loss 3332 (to prevent sudden risk aversion).
Stop loss 3280 for long orders (to avoid a weakening trend).
Data risk:
Pay attention to US PPI data and speeches by Fed officials, which may trigger fluctuations.
Position management:
No more than 5% position in a single transaction, avoid heavy positions.
Summary
Main direction during the day: Prioritize high altitude below 3345, pay attention to pressure near 3325.
Key support: 3280-3275 is the last line of defense for bulls, and it will turn to short if it falls below.
Breakthrough strategy: Follow the trend after breaking above 3345 or below 3275.

Gold Returns to the $3,300 per Ounce ZoneOver the past two trading sessions, gold has depreciated more than 1.5%, as a consistent bearish bias begins to emerge in price action. For now, selling pressure has remained steady, supported by a temporary decline in global economic uncertainty and a recent rebound in U.S. dollar strength, factors that have led gold’s upward momentum to steadily weaken.
Lateral Range Remains Intact
Recent price action in gold has defined a well-established sideways channel, with resistance near $3,400 and support around $3,200 per ounce. So far, price movement has been insufficient to break out of this range, making it the most relevant technical structure to monitor in the short term. As long as price remains within these boundaries, neutrality may continue to dominate.
Technical Indicators
MACD: The MACD indicator continues to oscillate near the neutral zero line, signaling that momentum from moving averages remains balanced. If this pattern persists, the sideways range could extend further.
RSI: A similar pattern is unfolding with the RSI, which is hovering around the 50 level, indicating a constant balance between buying and selling pressure. Sustained moves at this level could reinforce short-term price neutrality.
Key Levels to Watch:
$3,400 per ounce: This historical high acts as the most significant resistance in the short term. A breakout above this level could trigger a stronger bullish bias and revive the upward trend stalled in recent weeks.
$3,300 per ounce: The current level aligns with the 50-period simple moving average. Price movement around this zone could extend market neutrality.
$3,200 per ounce: A key support level and recent low. A retest of this area could trigger a more decisive bearish bias in the short term.
Written by Julian Pineda, CFA – Market Analyst


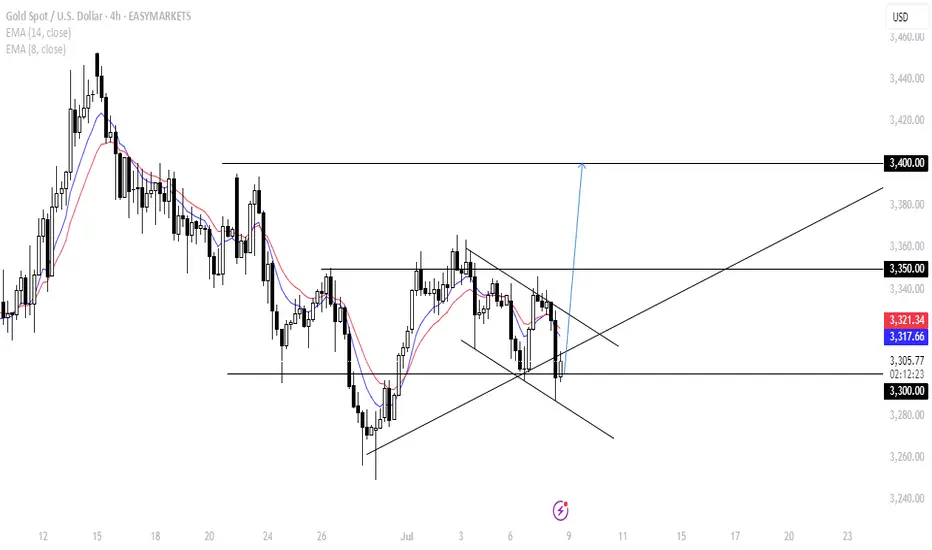
Gold is still in rangeGold, the general trend is as described in the continuous analysis. The price has fallen from the historical high of 3500 to 3120 in the first round this year. After rising to 3452, it is currently in the second round of downward cycle. The mid-term top idea is maintained, and the operating target is 3120;
The non-agricultural data at the end of last week was under pressure at 3365, and it dropped to 3296 on Monday and rebounded. It broke the high overnight, and the daily chart closed positive. The K-line combination is in a volatile arrangement. In the short term, it will maintain consolidation below 3365; short-term support is 3330-3326, and strong support is 3320-3316; short-term resistance is 3350-3358, and strong resistance is 3365;

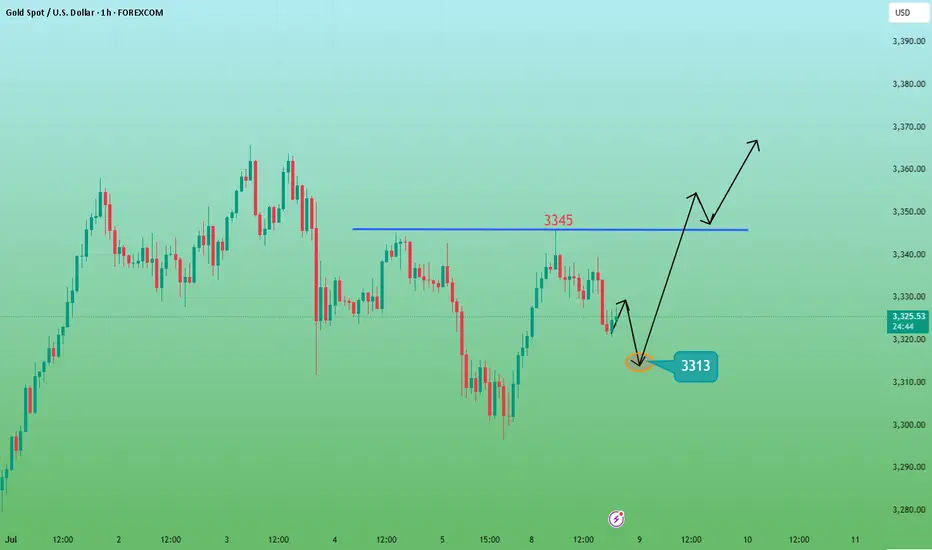
Gold price falls today and then looks bullish!Today, gold rose and fell back to 3345, which was the high point on Friday. It was suppressed and fell sideways.
From a technical point of view, the US market rose yesterday, and today's decline must continue to be bullish, but the position should not be too high or too low; if it is too high, there may be further decline, and if it is too low, there may be no reach.
The bullish position should be in line with the overall running rhythm of gold. Personally, I suggest that you can buy around 3320-3321, defend 3310, and target 3340-3345.
Focus on the rise of the European market. If the European market breaks through 3345 strongly, then you can continue to be bullish to 3360-3365; if the European market is always suppressed below 3345 and goes sideways, there is no performance, so you should consider selling, or there may be further retracement.
Put your thoughts in the comments section

9/7/25 Can Bulls Create More FT Buying?
Tuesday’s candlestick (Jul 8) was a big bull bar with a small tail above and closing above Jun 20 high.
In our last report, we said traders would see if the bulls could create a follow-through bull bar testing the July 4 high, or if the bears would be able to create a strong bear bar closing below Monday's low instead.
The market formed a strong follow-through bull bar testing the Jun 20 high.
The bulls hope to get a retest of the July 4 high and the Jun 20 high. They got what they wanted.
They want a measured move based on the first leg up (July 1 to July 3), which will take the market to around the 4260 area.
They must create follow-through buying above the Jun 20 high to increase the odds of a sustained move.
The bears see the current move as a retest of the prior high (Jun 20) and want a higher high major trend reversal and a double top bear flag (with the Jun 20 high).
They see the current move from June 11 as a large two-legged move. They want a lower high vs the April high.
The problem with the bear's case is that the follow-through selling has been limited still.
They must create strong bear bars to show they are back in control.
Production for July should be around June's level.
Refineries' appetite to buy so far looks decent.
Export: Up 31% in the first 5 days of July.
The Trump Tariffs have increased inflation expectations as reflected in the rising US Government Bond 10 Year Yield. Rising inflation expectations can cause commodities to rise.
The bulls need to create follow-through buying above the Jun 20 high for a sustained move higher.
For tomorrow (Wednesday, Jul 9), traders will see if the bulls can create a follow-through bull bar above the Jun 20 high.
Or will the market trade slightly higher but close with a long tail or a bear body instead?
Andrew

7/8: Inverse Head and Shoulders Pattern, Support at 3321–3312Good morning, everyone!
Yesterday, gold broke below the 3321 support during the session, dropped to around 3296, then staged a strong rebound back toward the opening price—forming a classic deep V-shaped reversal and regaining support above the MA60 on the daily chart.
The market remains in a consolidation phase between the MA20 and MA60 on the 1D chart, with no clear directional breakout yet.
On the 30-minute chart, the previous head-and-shoulders top pattern has been completed with the recent decline. The current structure can be tentatively viewed as the formation of a head-and-shoulders bottom.
If this bullish reversal pattern holds:
The 3321 level must act as valid support during any pullback; deeper confirmation may come from 3312, which corresponds to the previous left shoulder low. Although this was partially driven by a data-related spike, most candle bodies remained around 3321—so 3321 is the primary support, and 3312 is the backup.
If confirmed, the price may advance toward the 3360 target zone.
If the pattern fails, watch for the development of a double bottom formation, with MA60 on the daily chart remaining a key support level.
📌 For today, focus on trading within the 3312–3352 range, using a buy-low/sell-high approach, and stay flexible in response to evolving chart patterns.

Review and plan for 9th July 2025Nifty future and banknifty future analysis and intraday plan.
This video is for information/education purpose only. you are 100% responsible for any actions you take by reading/viewing this post.
please consult your financial advisor before taking any action.
----Vinaykumar hiremath, CMT

WTI USOIL WTI oil Prices are supported by supply cuts and production adjustments but tempered by inventory levels and economic concerns.
The market remains sensitive to geopolitical developments, OPEC+ policies, and US economic data.
#oil

GOLD STILL ON BULLISH TRENDunexpectedly, gold came down to retest the 3300 price level today. the bullish flag structure has not been broken yet. instead of the conventional four waves of bullish flag before continuation, gold made the sixth wave today.
from technical, gold will be bullish by tomorrow and is expected to hit the 3400 price level before the week ends.
technical shows pure BULLISH SIGNAL up to the 3400 price level before weekend.
have a wonderful trading week.
GOLD GOLD ,my call for buy on 3285 is standing at 3307 and the descending trendline will remain the demand floor until broken.

XAUUSD NY SESSION FLOW – JULY 8→ 9 , 2025"Structure doesn’t lie. Price answered exactly where we expected it to."
Hey traders 👋
Let’s set the record straight after today’s precision bounce. We saw textbook price action across all sessions — Asia triggered the short from our 3344–3351 HTF supply, and both London and New York followed through with no hesitation, driving price down to 3287.
But here’s the key point:
🧨 3287 was just 10 pips above our clean 3286–3280 buy zone.
No mitigation. Just a front-run.
That’s what real liquidity does — grabs what it needs before the crowd gets in. Our zone is still valid… just untouched.
🔍 HTF BIAS & STRUCTURE UPDATE
📆 Daily Bias:
Structure is still bearish — lower highs, CHoCH, and soft RSI.
EMAs 5/21 are flat. No power for bulls unless 3351 breaks.
⏰ H4 Bias:
New lower high confirmed after rejection from our 3344–3351 zone.
Trend is still bearish unless we reclaim 3330+ with conviction.
Liquidity is driving movement, not news.
🕐 H1 Flow:
Bounce from 3287 = engineered reaction before real demand
Price now hovering above 3306, forming mid-structure
No trade in the middle. Let’s work the edges.
🎯 TODAY’S SNIPER ZONES
🔻 SELL ZONES
1. 3325–3330
Nearest short trap. OB + inefficiency + H1 rejection base.
If price returns, watch M15/M30 for CHoCH or BOS → entry.
2. 3344–3351
Our major HTF supply. Asia already reacted from top half.
If revisited, this zone remains the high-probability rejection zone.
3. 3380–3394
Premium OB + imbalance pocket.
Untouched zone far above — if tapped late in the week, watch for liquidity sweep → clean reversal potential.
🟢 BUY ZONES
1. 3297–3300
NY session bounce zone. Price tapped 3297 → pushed to 3306.
Still live for intraday reentry if price retests and confirms with BOS.
2. 3286–3280
Our true demand base. Price front-ran it by 10 pips — didn’t mitigate.
Still valid, still reactive. Don’t delete this zone.
3. 3263–3255
Last line of support. Deep zone — only comes into play if 3280 fails with conviction.
✅ EXECUTION REMINDERS
Price is hovering mid-range → don’t force entries
Only act if structure reacts at the edges (3325 or 3286)
3380–3394 may be a late-week trap if bulls get overconfident
📌 If this breakdown helped, hit 🚀 and drop a comment:
👉 Are you stalking 3325… or waiting for 3286 to finally wake up?
Let structure talk. You just execute.
GoldFxMinds 💭🔥
📢 Disclosure:
This analysis is based on the Trade Nation TradingView feed. I’m part of their Influencer Program and receive a monthly fee.
⚠️ Educational content only — not financial advice.

XAUUSD 15M Smart Money Sell SetupGold is showing classic Smart Money Concepts (SMC) behavior with liquidity engineering and premium mitigation.
🧠 SMC Breakdown:
Price swept buy-side liquidity above 3,355 and failed to close above the zone.
Supply zone (red) at 3,350–3,360 was previously unmitigated and now tapped.
Clean mitigation candle formed inside the supply with a sharp rejection.
Sell pressure expected from institutions looking to fill short positions after engineered liquidity.
📌 Sell Idea:
We anticipate a bearish reaction from the 3,350–3,360 zone down to the demand area.
🎯 Trade Plan:
📍 Entry Zone: 3,350–3,360 (inside red supply zone)
🛑 SL: 3,365 (above the liquidity wick)
✅ TP: 3,300 zone (green demand block)
📊 Why This Trade?
Structure is bearish from higher timeframes.
This is a sell in premium after liquidity sweep.
Imbalance left behind during the move up still unfilled.
Expecting internal CHoCH on M1/M5 to confirm entry.
🧲 Liquidity Map:
Engineered highs above 3,355 swept.
Clean equal lows sitting at 3,300 – perfect magnet for price.
⚠️ Note: Patience is key. Let price come into your zone and show a reaction before entering.
#XAUUSD #SmartMoneyConcepts #SupplyAndDemand #GoldSellSetup #SMC #TradingView #InstitutionalTrading #LiquiditySweep #PriceAction #Forex

Bullish reversal off major support?XAU/USD has bounced off the support level which is an overlap support that lines up with the 76.4% Fibonacci projection and could rise from this level to our take profit.
Entry: 33,295.00
Why we like it:
There is an overlap support level that lines up with the 76.4% Fibonacci projection.
Stop loss: 3,278.48
Why we like it:
There is a pullback support level that aligns with the 100% Fibonacci projection.
Take profit: 3,338.86
Why we like it:
There is a pullback resistance level.
Enjoying your TradingView experience? Review us!
Please be advised that the information presented on TradingView is provided to Vantage (‘Vantage Global Limited’, ‘we’) by a third-party provider (‘Everest Fortune Group’). Please be reminded that you are solely responsible for the trading decisions on your account. There is a very high degree of risk involved in trading. Any information and/or content is intended entirely for research, educational and informational purposes only and does not constitute investment or consultation advice or investment strategy. The information is not tailored to the investment needs of any specific person and therefore does not involve a consideration of any of the investment objectives, financial situation or needs of any viewer that may receive it. Kindly also note that past performance is not a reliable indicator of future results. Actual results may differ materially from those anticipated in forward-looking or past performance statements. We assume no liability as to the accuracy or completeness of any of the information and/or content provided herein and the Company cannot be held responsible for any omission, mistake nor for any loss or damage including without limitation to any loss of profit which may arise from reliance on any information supplied by Everest Fortune Group.

7.8 Gold Analysis7.8 Gold Analysis
Currently, the market is in a tug-of-war between long and short positions
1. Short forces (suppressing gold prices):
Federal Reserve hawkish expectations: Strong non-farm data has reduced market expectations for a rate cut in July, and even strengthened the "higher and longer" interest rate stance.
Stronger US dollar and US Treasury yields: Cooling expectations for rate cuts have pushed up the US dollar and Treasury yields, increasing the opportunity cost of holding interest-free assets such as gold.
2. Long forces (supporting gold prices):
Geopolitical risks: Trump's threat to impose tariffs (trade friction risks) and other unspecified geopolitical tensions have increased gold's safe-haven appeal.
Economic uncertainty: Potential trade frictions themselves will also bring uncertainty to the economic outlook, which is good for gold.
Technical analysis
Watershed: 3320
Resistance level (short selling area): Near 3320
Strategy: Before the price effectively breaks through and stabilizes at 3320, any rebound to this position is seen as a short selling opportunity.
Breakout signal: If the price effectively breaks through and stands above 3320, the technical pattern will turn bullish, and the bearish idea should be abandoned. Consider going long or waiting.
Today's strategy
SELL: around 3320
SL: 3330
TP: 3310-3280
Be cautious in trading and control the risk! I wish you a smooth transaction!

Gold price plunges by $30 at openingGold fell sharply at the opening of the morning session, with the intraday high and low price difference exceeding 30 US dollars. The positive factors over the weekend failed to reverse the bullish trend, and the bearish forces prevailed. Gold fell sharply in the last week of June, and bottomed out and rebounded in the first week of July. The market is in fierce competition between bulls and bears, and the volatile pattern has not changed. At present, gold has fallen below the non-agricultural low of 3311, and the market is weak. There is a high probability of a high and fall in the future. The short-term resistance is in the 3325-27 area, which is the intraday strength and weakness watershed; the 3343-45 area is the key boundary between bulls and bears. If it is not broken, it will fall back. If it breaks through, it is expected to hit 3365, 3380 or even 3400. The current support below is 3295-3290, and the resistance above is 3317-3323. It is recommended to do more in the callback.

Will gold continue to fall?Judging from the current trend of gold, it is weak in the early trading and continues to break lows in the European trading. Then there will be a second bottoming action in the US trading. Pay attention to the 3330 and 3335 areas for short selling before the US trading. Pay attention to the two support levels of 3318-3315 below. The market changes in real time, and it is recommended to operate in real time according to my prompts before the trading!
XAU / USD 4 Hour ChartHello traders. Taking a look at the 4 hour chart, I have marked the areas of interest. I would need a break and close out of the current trading range. Sells below 3301, and buys above 3310.. I am not getting stuck trading in the range, so those are my markers to wait for a break and close out of. So being that we are almost mid week, I am just going to watch for now until a valid set up appears. Big G gets my thanks. Be well and trade the trend.

XAUUSD:Sharing of the Latest Trading StrategyAll the trading signals this week have resulted in profits!!! Check it!!!👉👉👉
Gold Market Analysis:
Overnight Dynamics: Following Trump’s reinstatement of tariffs, gold’s safe-haven demand drove another rally, but it still pulled back after facing pressure at the 3345 level. The decline extended today, requiring attention to the sustainability of safe-haven flows—recently, safe-haven-driven rallies have often been followed by pullbacks, so caution remains warranted for further gold corrections.
Technical Trends:
On the daily chart, gold continues to trade in a narrow range, with short-term moving averages essentially converging and flattening, suggesting a high probability of continued sideways movement in the near term.
The current range is temporarily compressed between 3285–3345, with the market bias leaning toward a "range-bound bearish" trend.
Trading Bias: Maintain a bearish stance on rebounds!
Trading Strategy:
Sell@3330-3320
TP:3300-3280

OIL Bouncing at SupportLooking for a short bounce on US Oil here after a massive sell off earlier this week when the ceasefire was announced in the middle east. Again this is a short, countertrend bounce trade . Once you get a few percent, take your profits and get out.

Copper Cup & Handle Formation - Confirmed by Half-Yearly CloseIn a recent interview, Kevin Warsh, a former Member of Board of Governors Federal Reserve said: “External shocks like wars, pandemics, and supply chain disruptions may cause a spike in prices, that's not inflation. That's more like the weather. Inflation's more like the climate.
Weather refers to the day-to-day state of the atmosphere. A storm may come, but it will eventually pass.
Climate is the long-term average of weather patterns, typically measured over 30 years or more. If the underlying causes of climate change are not addressed, they are likely to affect future weather — for example, storms may become more unpredictable, occur more frequently, and intensify when they happen.
Going back to the financial markets. Have we address the underlying causes of inflation climate today? If not, then with every war or rumors of war or tariff or any unwelcome surprises.
They are likely to become even more volatile than before, some more bullish and the others more bearish.
What is the real cause of inflation climate the world is facing? Debt. At every pit stop, I will keep checking if there’s any chance that U.S. debt might start trending downward. If it does, my existing strategies would have to change. But for now, I’m maintaining these strategies. Here are some examples:
With fears of inflation still in sight, stocks have become more volatile. Since inflation hit a high of 9% in 2022, we’ve seen stock market swings widen.
With fears of inflation, bonds are under pressure. The drop in U.S. bonds wasn't triggered by the “Liberation Day” tariff announced on 2nd April alone. In fact, bonds peaked in 2020 and broke below their main uptrend support when inflation hit 9%.
With fears of inflation are also driving commodities higher — from “weather” to “weather,” so to speak. I’ve been covering gold, bitcoin, silver, and soybean oil. Today, copper looks interesting to me. Let’s dive into the technical. I find the half-year chart particularly interesting.
On this half yearly chart. We can see as the close on 30th June, copper settled firmly, closed above its $4.44 resistance that has been tested for years. This study indicates that copper could be at the beginning of an uptrend. I will be looking out for buying-on-dips opportunities whenever they arise.
What Began Well, Grew Risky — Yet Opportunity Awaits. Besides debt, there are two other key elements that may trigger fears of inflation from time to time. What do you think they are?
I would like to hear your thoughts on this.
Video version:
Mirco Copper Futures
Ticker: MHG
Minimum fluctuation:
0.0005 per pound = $1.25
Disclaimer:
• What presented here is not a recommendation, please consult your licensed broker.
• Our mission is to create lateral thinking skills for every investor and trader, knowing when to take a calculated risk with market uncertainty and a bolder risk when opportunity arises.
CME Real-time Market Data help identify trading set-ups in real-time and express my market views. If you have futures in your trading portfolio, you can check out on CME Group data plans available that suit your trading needs www.tradingview.com
Trading the Micro: www.cmegroup.com
www.cmegroup.com
