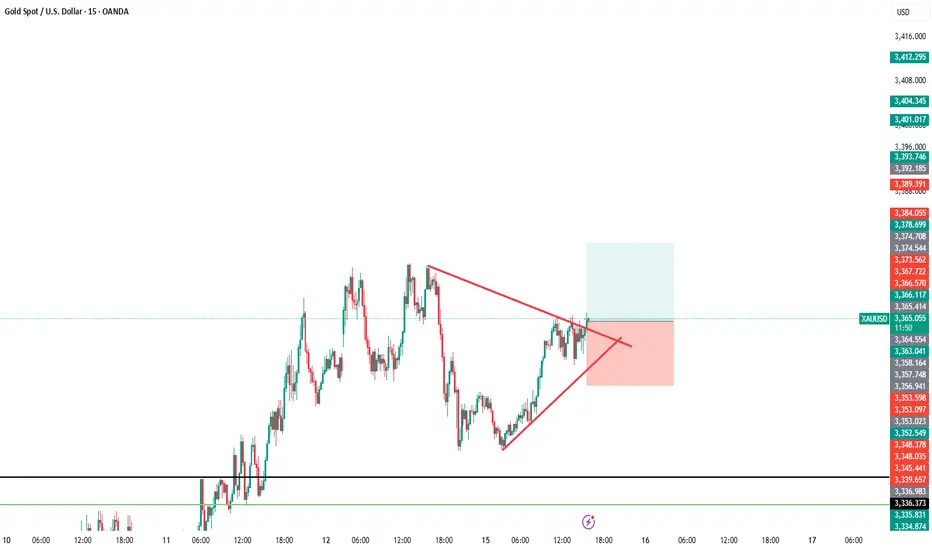
GOLD BUY M15 Gold (XAU/USD) 15-Min Chart Analysis – July 15, 2025
The price is currently trading around 3,352, having recently shown a Change of Character (CHoCH) indicating a potential bullish reversal. After a drop from the recent highs, price is now approaching a highlighted demand zone (purple box) between approximately 3,342 – 3,349, which could act as a strong support area.
Trade Setup:
Buy Zone: Inside the purple demand zone (approx. 3,342 – 3,349)
Stop Loss (SL): 3,342
Target (TP): 3,365
Key Levels:
Resistance Levels:
3,355
3,360
3,365 (Target)
3,370 (Potential extension)
Support Levels:
3,349
3,342 (Stop Loss)
3,341 (Strong Low zone)
Expectation:
If price reacts positively from the demand zone and holds above the support, we can expect a bullish move towards the target of 3,365, breaking through intermediate resistance levels.
Futures market

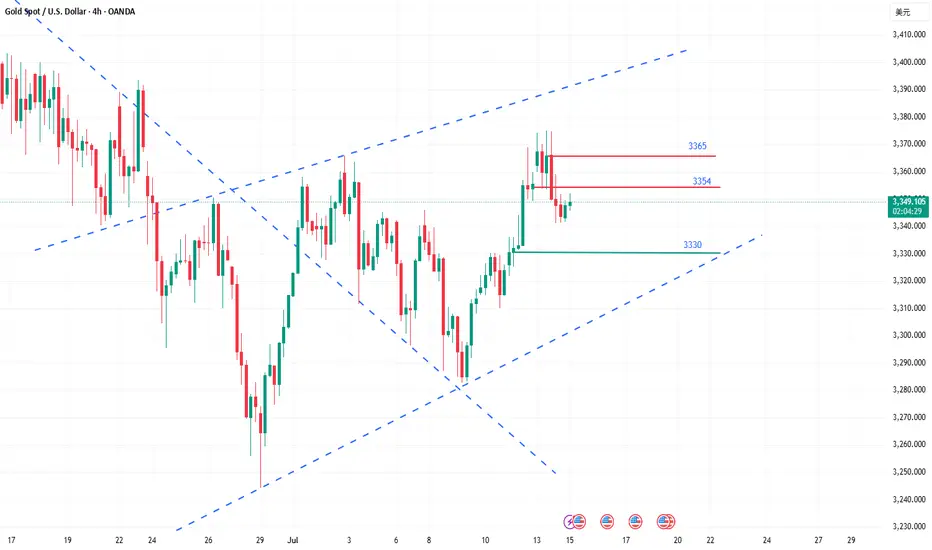
How to grasp the key trading points of gold?Yesterday, gold tested the 3375 line several times but failed to break through effectively. The selling pressure on the market was obvious, and the price immediately fell back, reaching a low of around 3341. The daily line closed with a long upper shadow, indicating that the bullish momentum has weakened and the short-term market has entered an adjustment phase. From the perspective of the 4-hour cycle, the continuous negative trend has led to the gradual closing of the Bollinger Bands, and the middle track position has temporarily gained support, but the overall market is volatile and weak. Today, we will focus on the 3354 watershed. If the rebound fails to effectively stand at this position, the pressure on the upper side will still be strong, and there is a risk of a short-term decline.
Key technical positions: upper resistance: 3365, 3354, lower support: 3340, 3330. In terms of operation rhythm, it is recommended to deal with it with a high-selling and low-buying, oscillating approach, and maintain flexible adjustments.
The operation suggestions are as follows: You can choose to short in the 3360-3365 area, with the target around 3350 and 3340; if the rebound is blocked below 3354, you can also enter the short order in advance. It is recommended to enter and exit quickly in the short-term weak market; strictly control the stop loss to avoid risks caused by sudden changes in the market.
The current market is obviously volatile, so don't blindly chase the rise and fall. It is particularly important to operate around the key pressure and support areas. The grasp of the rhythm will determine the final profit, and steady trading is the kingly way.
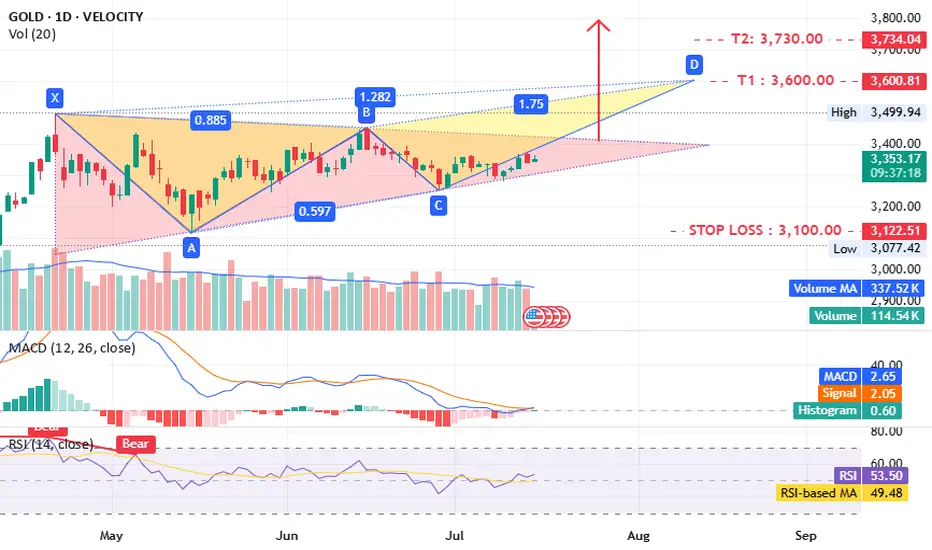
Gold what is next ?!!TVC:GOLD timeframe 1 day
is forming a potential triangle pattern, which could lead to a bearish setup.
The MACD and RSI indicators are positive, supporting this outlook. A close above 3400 would further confirm the idea.
Targets:
- T1: 3600
- T2: 3730–3800
Stop loss: 3100
Support: 3300–3260
Consider opening a long position now, with confirmation above 3400.
Disclaimer: This is not investment advice, only an analysis based on chart data. Consult your account manager before making any decisions. Good luck.
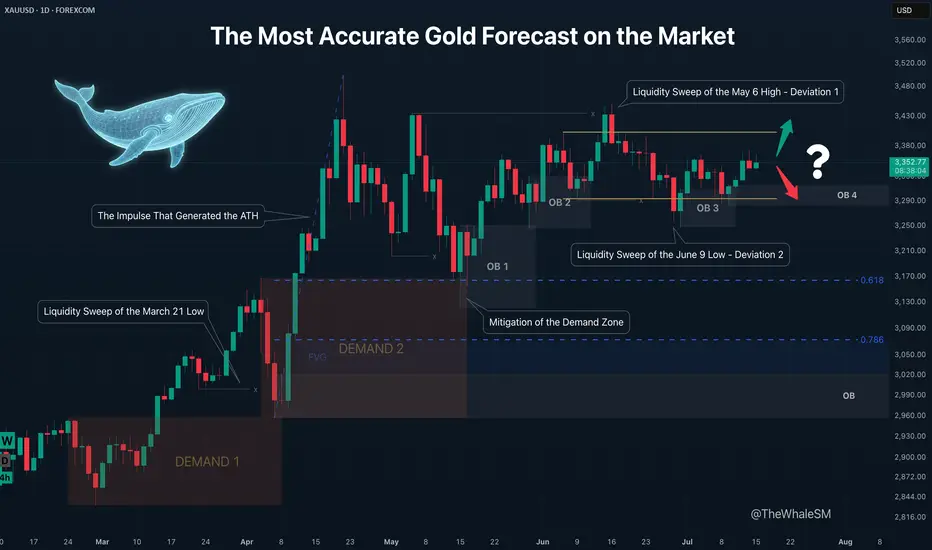
The Most Accurate Gold Forecast on the MarketThis is a continuation of sorts of my educational article that received an "Editor's Pick" from TradingView and a large number of positive reactions from this amazing trading community. However, unlike that post, this is a trade idea that outlines clear entry conditions for when the price reaches a relevant manipulation zone and shows a reversal reaction. If you don't want to get into the details and trace the entire chain of events through which large capital brought the price to its current levels, feel free to skip the intro and go straight to the 4H chart with the long setup conditions.
To better understand the logic of "smart money," let's revisit the Gold daily timeframe from my educational article:
We will approach this analysis like detectives, following the facts and footprints in the style of Sherlock Holmes and Hercule Poirot.
So, let's begin our investigation. On the daily structure, we see a clear order flow confirming the intention of large capital to lead the price in continuation of the uptrend. After the latest impulse that began on February 28th and ended on April 3rd, the price corrected and mitigated the DEMAND1 manipulation zone. The "Whale" refueled with liquidity, eliminated some competitors, closed its losing short positions used for the manipulation, and gained energy for the next impulse that set a new ATH. The correction that mitigated the DEMAND1 zone was nothing other than the next manipulation, also in the form of a DEMAND zone, within which there is a still-valid daily order block. How can we assert that DEMAND 2 is a manipulation and not just a correction?
Firstly, the sharp nature of the move swept liquidity from the March 21st low. Secondly, the sharp upward impulse accompanied by a series of FVGs showed the Whale's true intention. And thirdly, the reversal from this DEMAND 2 zone, combined with the 61.8% Fib retracement level, resulted in the formation of the next manipulation in the form of the OB 1 order block. Further, we see the continuation of the order flow on this daily structure; the price reacts to OB1, forming another order block, OB2 . The impulse from OB2 sweeps liquidity from the May 6th high. Many might have expected a continuation of the impulse and a new ATH instead of a sweep of this high, but as often happens when too many participants pile into one direction, the price sharply reverses and liquidates their positions. This intense decline after sweeping the high looked something like a local trend change from bullish to bearish, but the sharp recovery after sweeping the liquidity from the June 9th low and forming a new order block, OB 3 , finally revealed what was really happening: it turned out to be a range . It's impossible to identify a range until it is fully formed. A range is another type of manipulation where internal and external liquidity is swept from both sides. In our case, there was first a deviation above (Deviation 1 on the chart), then a deviation below (Deviation 2), after which the price swept some internal liquidity and got stuck exactly in the middle of the range.
And finally, after all our investigations and deductions, we can say with absolute certainty, practically with 100% confidence divided by two, that ABSOLUTELY NO ONE KNOWS where the price will go from the current levels. Because the center of a range is a state of complete uncertainty. Moreover, I dare to suggest that even the Whales don't know where the price will go right now. They certainly have enormous funds to sharply move prices at the right moments to capture liquidity and conduct manipulations. At other times, they can nudge the market to create a trend and direct it like a chain reaction of falling dominoes. But the entire market is much larger, and if its sentiment changes drastically due to external factors, smart money won't waste its resources fighting it. Their goal is to make more money, nothing personal. Why else is the price stuck in the middle right now? Inflation data is coming out soon, which could push the price in an unpredictable direction. The Whales will wait to use this news-driven impulse to their advantage.
So, what have we concluded from this investigation? Was it all in vain since we can't even say with 51% probability where the price will go next? Of course not. We simply need to wait for the price to reach an area where the probability of it moving in a certain direction is significantly higher than 50% — that's all you need to be profitable in the long run. This probability will never be close to 100% because we don't know what's really happening in the depths of the market. Are the Whales accumulating positions in this range now, or are they selling off at high prices after the ATH? Unless you are one of the few direct participants in large capital, you can't know this. Moreover, you don't need to know it to make a consistent profit in the market. It is enough for us to predict the next move of smart money with high probability at certain moments, join their movement, and take our profit. It's like a weather forecast: the further from the current date, the lower the probability of it being accurate. It's the same with the market; a completely unpredictable combination of factors, news, and hidden internal processes can lead the price on a unique path, but always accompanied by smart money. It doesn't matter where the gold market goes next, whether to a new ATH or down to the next correction level. When the Whale reveals itself again by leaving a trail in the form of a manipulation, we can lie in wait near it and join its next move. Why is it generally a good idea to enter from manipulation zones? You are essentially stepping onto a field where the Whale has already cleared the liquidity, and it has returned to that place for other business — to close its losing positions. That is, a mitigated manipulation zone is a safer place to enter the market; there's a much lower chance the Whale will absorb your position. Right now, we have such a manipulation in the form of the OB 4 order block, and we can switch to the 4H timeframe to look at a potential entry zone in more detail.
4H CHART - SETUP CONDITIONS
So, we already know the general context: the price is inside a range. After the second deviation, it has already reacted to the order block formed after it, and we are waiting for the mitigation of the next one, OB 4 , which will serve as a pivot point for a potential setup. A reversal from this order block will confirm the order flow for the price to move at least to the upper boundary of the range. The presence of a manipulation zone alone is not enough to open a position; additional confirming conditions are always needed. As one such condition here, we can take the combination of mitigation with one of the Fibonacci retracement levels — 61.8% or 78.6%. Upon reaching each level, the price must hold (not be broken by the bodies of 1-4H candles) and show a reversal reaction. The final confirmation for entry will be an LTF confirm in the form of a break of structure (BOS) or the beginning of order flow on a lower timeframe. An important part of the context is that important US inflation news is coming out soon, and positions should not be opened right before it or for some time after (at least an hour).
Invalidation of the long scenario would be a break below the 78.6% level and OB 4.
~~~~~~~~~~~~~~~~~~~~~~~~~~~~~~~~~~~~~~~~~~~~~~~~~~~~~~~~~~~~~~~~~
If you found this analysis helpful, support it with a Boost! 🚀
Have a question or your own view on this idea? Share it in the comments! I read every single one. 💬
► Follow me on TradingView for more educational content like this and to not miss my next detailed trade idea .
~~~~~~~~~~~~~~~~~~~~~~~~~~~~~~~~~~~~~~~~~~~~~~~~~~~~~~~~~~~~~~~~~
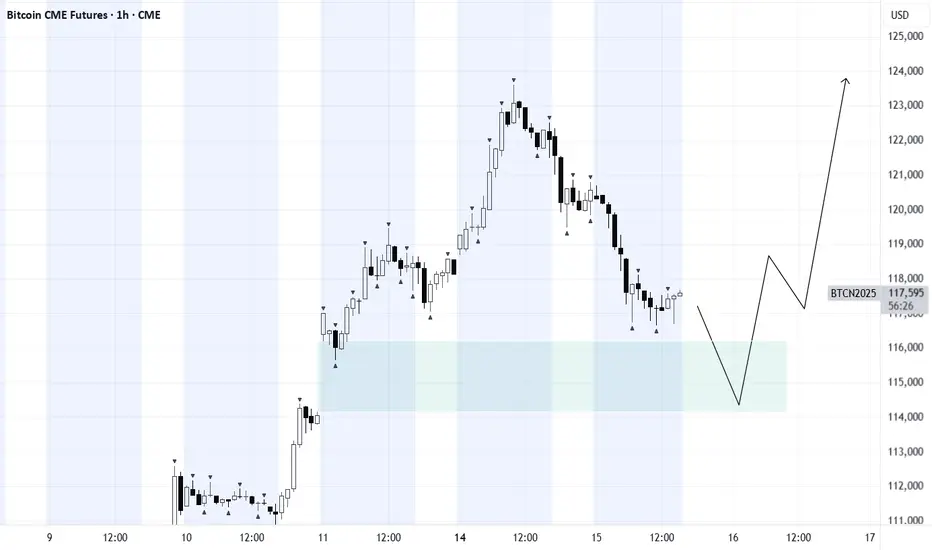
BTCA gap is currently in play. For further upside, it would be healthy to see a full or partial fill in the near term, followed by a strong reaction.
Such a move would signal strength and validate bullish momentum.
XAUUSD Long OpportunityXAUUSD is currently on a retracement from the Asian high of the day at $3365. Looking for a Long opportunity from either the pivot level at $3351 (Break and Retest zone) or the Asian lows of the day at $3342.
Momentum is in favour of further bullish movements with these key level provide the best platform for the market to continue the bullish move. Price is trading above both the 21 and 50 SMA at these levels and is perfectly situated in the sweet spot region of the RSI (between 45-55) indicating that the retracement is nearing the end and we could see a pivot in the next few hours.
Looking for entry on the 5 minute chart and will be awaiting the NY market open for added liquidity into the market which could push it further into the bullish territory and beyond the high of $3365. Will need to be wary of the volatility at the open but will be looking at this bullish move continuing throughout the NY Session.
Will also be awaiting the release of CPI to confirm the strength in Gold and weakness in USD for added bullish confluence for this market.

Gold Faces Strong Rejection Below $3,365 – Bearish Wave Ahead?Gold is currently trading around $3,359, showing signs of exhaustion after climbing from the $3,248 low. The chart illustrates a textbook scenario of channel rejection after testing the upper boundary of the descending wedge and failing to break above the $3,365–$3,392 resistance zone. Price is now hovering just below the diagonal black trendline, indicating a potential lower high formation and setting up for another bearish wave.
📌 Key Technical Highlights
Resistance Zone: $3,365–$3,392
This area marks the confluence of the black long-term trendline, the top of the descending purple channel, and the previous high at $3,392.
Price attempted a "Possible Retest" as annotated on the chart and is now starting to pull back—showing signs of bearish rejection.
Bearish Scenario (Blue Arrows):
Multiple downward arrows show likely bearish paths if the current resistance holds.
Key short-term targets:
$3,337, $3,320, $3,303, Strong support at $3,293–$3,248
Further downside may test extension levels toward $3,220–$3,200 by early August if momentum builds.
⚠️ Bearish Confirmation Criteria
Failure to close above $3,365 (black trendline)
Breakdown below $3,337 followed by $3,320
Strong selling pressure supported by fundamentals (e.g. USD strength, Fed hawkish stance)
✅ Invalidation / Bullish Outlook
A decisive breakout and close above $3,392.73 would invalidate the bearish structure.
In that case, targets would shift toward:
$3,412, $3,434, $3,490 (long-term trendline intersection)
However, today's U.S. CPI (Consumer Price Index) release adds a layer of volatility and potential trend disruption, making this a high-risk trading day.
📊 CPI News Impact – What to Watch
High CPI (Stronger than forecast):
- Increases expectations of further Fed tightening → strengthens USD → bearish for gold
- Likely scenario: sharp drop toward $3,337 → $3,320 → $3,293
Low CPI (Weaker than forecast):
- Signals disinflation → weakens USD → bullish for gold
- Possible breakout above $3,365 → retest of $3,392 → if broken, target $3,412 and $3,434
Neutral or as expected CPI:
- Likely leads to whipsaw — fakeout on both sides
- Caution advised — wait for candle close confirmations post-news
Note
Please risk management in trading is a Key so use your money accordingly. If you like the idea then please like and boost. Thank you and Good Luck!

XAUUSD on consolidation Gold is currently holding Range of 3340-3375 along with rising channel.
What's possible scanarios we have?
▪️I'm looking for Buying towards at 3340-3345 support area if it's sustained
Secondly 3330-3335 consider as structural support H4 remains above then keep buy set targets at 3370 then 3380.
-> Moral of Day buy the Dips
Additional TIP:
Below 3330-3325 I will Activate my resell and hold till 3315 then 3305.
#XAUUSD

Gold CPI shocks and fallsMarket news: Focus on the US CPI, PPI, retail data and the initial value of the University of Michigan Consumer Confidence Index; in addition, US President Trump plans to make a "major statement" on the Russian issue, the Federal Reserve will release the Beige Book on economic conditions, and the CFTC weekly position report is also worth noting.
Last weekend, Trump imposed tariffs on the EU and other countries and regions, and the EU has strongly counterattacked. The subsequent developments need to be tracked. The market has fluctuated violently and moved towards the 3400 mark. Trump has recently frequently announced tariff policies (such as 30% tariffs on the EU and Mexico, and threatened to impose 100% tariffs on Russia), exacerbating market uncertainty. Although theoretically beneficial to gold's safe-haven demand, the actual impact requires close observation of institutional capital flows.
The 1-hour chart shows that gold prices fluctuated and consolidated at the bottom after a continuous correction yesterday, and continued to rebound today. The key pressure level is the top and bottom conversion level. The current gold rebound is only a secondary confirmation of the 30-minute top structure. After the high of 3365, the short-term has shown signs of pressure. In the volatile market, if the price starts to consolidate horizontally, it may indicate the end of this round of volatile upward trend, and it will turn into a downward phase later. Considering the market sensitivity before the release of CPI data, it is recommended to focus on the volatile decline trend. After today's rebound, it is necessary to focus on the 3363-3368 area as the short-selling range, and the long-short defense position is set at yesterday's intraday high of 3375. In terms of operation, it is recommended to maintain the rebound short-selling idea, and pay attention to the 3340-3335 range for support below.

THE KOG REPORT - UpdateEnd of day update from us here at KOG:
Nice start to the week with price attempting that higher red box and failing to breach it. We then activated an Excalibur signal short, identified the structure and got a lovely move into the 3552 level from 3371 activation. Traders then had the opportunity to capture the tap and bounce from the 50MA on the hourly, again giving a minimum of 100pips on the bounce.
Now, we have support below 3340 which was the bias level which has also rejected price giving a long, but, resistance here stands at 3357. Below that level we are more likely to see this range or attempt lower sticking to the plan on the KOG Report published yesterday.
KOG’s Bias of the day:
Bullish above 3340 with targets above 3375, 3388 and above that 3392
Bearish on break of 3340 with targets below 3335, 3332, 3320 and 3310 (No Breach)
RED BOXES:
Break above 3376 for 3382, 3390, 3396 and 3304 in extension of the move (No breach)
Break below 3365 for 3362✅ and 3355✅ in extension of the move
As always, trade safe.
KOG

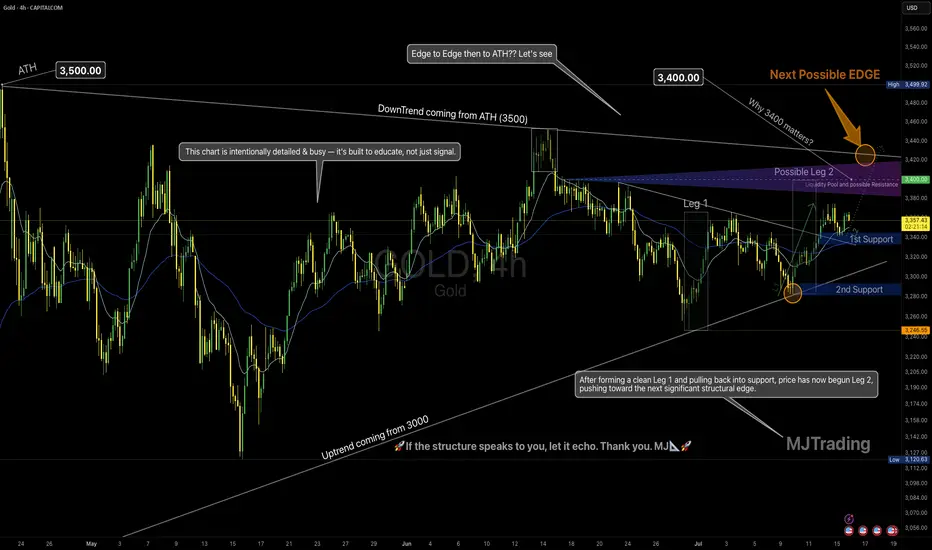
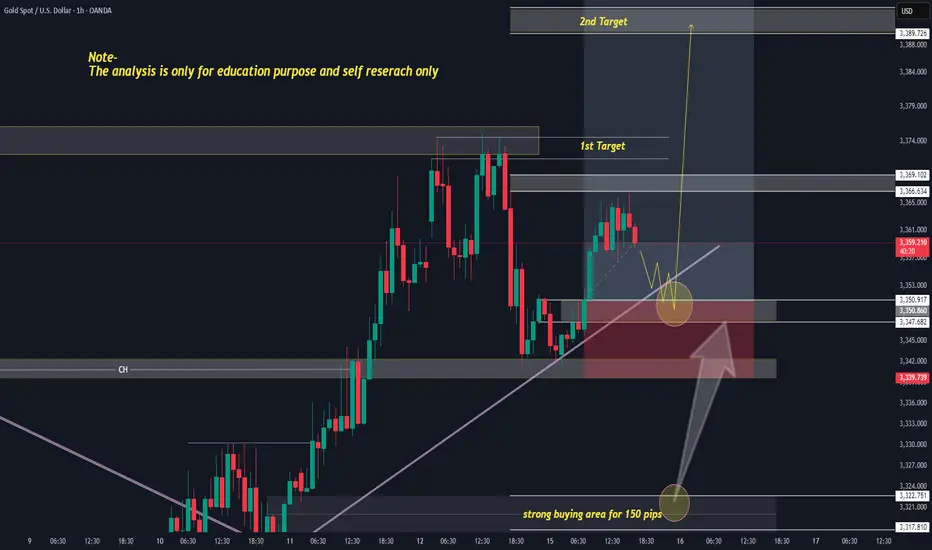
Leg 2 in Progress? | All Eyes on the Possible EDGE around 3400💡 GOLD 4H – MJTrading:
After forming a clean Leg 1 followed by a technical pullback into support, Gold has initiated Leg 2, pushing upward toward the next possible EDGE: 3400.
🟠 Why 3400 Matters
This zone is not just a round number:
It aligns with the long-term downtrend coming from the ATH (3500)
It’s the last reaction high before a deeper correction
There’s likely liquidity resting above — it’s where smart money may make decisions
This is where structure and psychology meet.
And end of 2 possible 2nd leg...
🔄 Possible Scenarios:
🟥 Scenario A – Rejection from the Edge (if could reach):
A reaction from this zone could lead to a pullback toward:
1st Support around 3340-3360
2nd Support near 3250 (also the uptrend line from 3000)
Use these zones to reassess momentum.
🟩 Scenario B – Breakout Above 3400:
A clean break above this structural edge opens the path for:
An “Edge to Edge” move back toward ATH (3500)
Possible higher timeframe trend shift — especially if retest holds
🧠 Our Strategy
We’re long-biased into the edge, not beyond it yet.
Let 3400 show its hand — we stay adaptive, not predictive.
🔍 This chart is intentionally detailed — it's built to educate, not just signal.
Focus on structure, sequence, and behavior — not just levels.
Lets Zoom in around the Breakout area...
And a Zoomout to Daily...
🧭 “If the structure speaks to you, let it echo.”
– MJTrading 🚀
📍#Gold #XAUUSD #TradingView #TechnicalAnalysis #ChartDesigner #MJTrading #MarketStructure #ForexIdeas #Edge
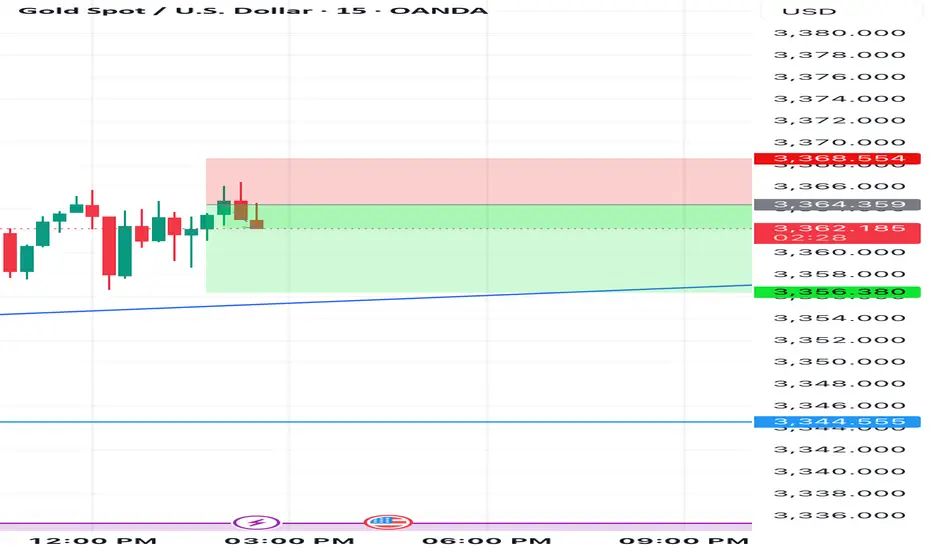
XAUUSDXAUUSD is currently trading at 3358, entering a potential buy zone for short-term upside continuation.
This level is attractive for buyers, positioned just above the key support at 3339.00, offering a favorable risk-reward setup.
The immediate resistance is located at 3370, which will serve as the first test of bullish strength.
A breakout above 3370 opens the door for a move toward the second resistance at 3375.
Sustained bullish momentum and a clear close above 3375 would build confidence toward the confirmation target at 3400.
Stop-loss should be strictly placed below 3339.00 to manage downside risk and protect capital.
The optimal buy zone lies between 3356–3359, providing a tight entry range above support with upward potential.
Momentum indicators and volume spikes near 3370–3375 should be monitored to confirm breakout validity.
If price holds above 3350 with strength, it signals buyer dominance and increases the probability of hitting 3400.
Overall, this is a high-probability buy setup above 3358, targeting 3370, 3375, and 3400, with 3339 as the critical invalidation point.

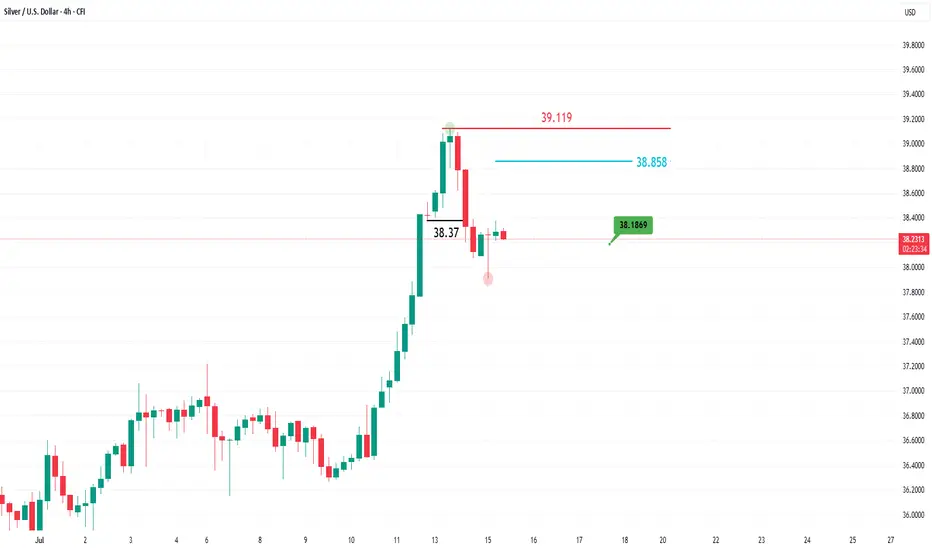
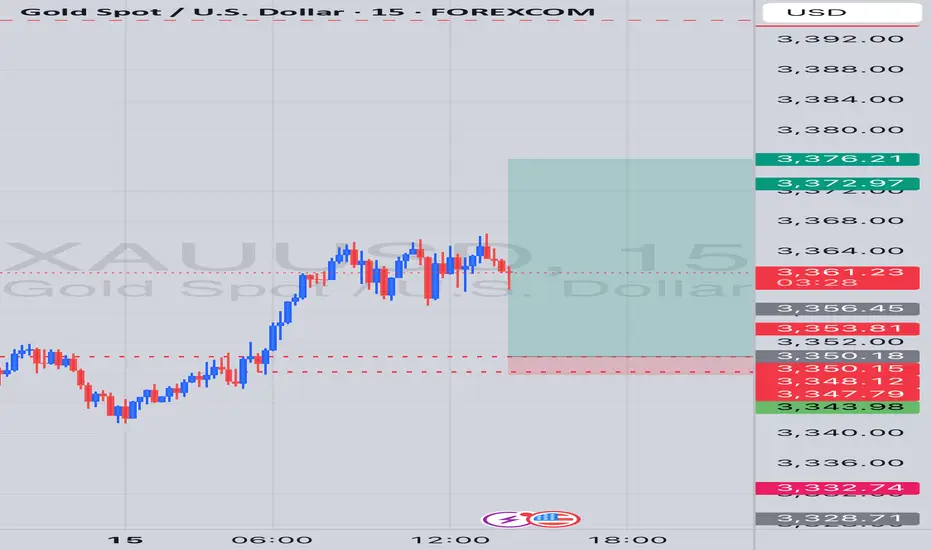
A temporary pause for silver!After its recent surge to reach the highest levels since September 2011, silver is showing short-to-medium-term negative signals on the 4-hour timeframe, before potentially resuming its upward trend on the daily chart.
As seen in the chart above, the price dropped quickly below the 38.37 level, forming a new low and shifting the 4-hour trend from bullish to bearish. The rebound to the 38.858 level appears to be a corrective move targeting the 38.1869 level.
The bearish scenario would be invalidated if the price rises again and forms a higher high on the 4-hour chart above the 39.119 level.
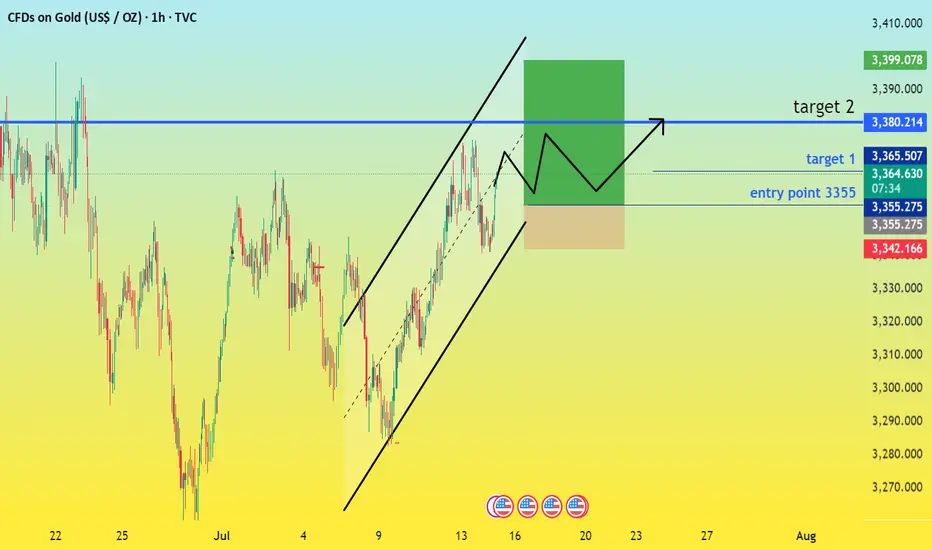
THE BULLISH CASE FORE BUYERS FUMDAMEMTAL ANALYSIS
Key Drivers for the Bullish Outlook:
Strong Technical Support and Breakout Potential: Recent price action indicates a robust underlying strength. Gold has demonstrated resilience around the $3331-$3335 zone, which is acting as a strong demand area. Furthermore, a "Break of Structure" (BOS) above $3340 has been confirmed, signaling bullish control. If gold can decisively break and close above the immediate resistance level of $3360-$3364, it opens the path for significant gains. Analysts are eyeing targets of $3380 and potentially $3406 (1.272 Fib extension)
With gold currently trading around $3364, the signals are pointing towards an attractive buying opportunity for discerning investors. A confluence of technical indicators and underlying market fundamentals suggests that the yellow metal is poised for further upside.
Persistent Geopolitical and Economic Uncertainty: Gold's traditional role as a safe-haven asset shines brightest during times of uncertainty. Current global dynamics, including ongoing trade tensions (e.g., renewed US tariffs), geopolitical risks, and concerns about potential economic downturns, continue to fuel demand for gold. This "risk-off" sentiment directs capital towards the precious metal, bolstering its price.
Central Bank Accumulation: Central banks worldwide have been consistent and significant buyers of gold. This trend is expected to continue throughout 2025 and beyond, with projections of around 900 tonnes of central bank buying in 2025. This sustained institutional demand provides a strong floor for gold prices and underscores confidence in the metal as a reserve asset.
Potential Entry Points and Targets:
"Buy the Retest" Strategy: A highly attractive entry point is around $3335. This zone aligns with multiple bullish confluences, including a bullish order block, Fair Value Gap (FVG), and the 38.2% Fibonacci retracement level. A stop-loss below $3327 would manage risk effectively, with initial targets at $3355 and $3380. This offers a favorable risk/reward ratio.
Breakout Long: For more aggressive traders, a decisive break and close above $3360 could trigger a long position, targeting $3380 and potentially $3406.
Deeper Pullback: In case of a deeper market shakeout, the $3313-$3315 zone (61.8% Fib + deeper demand) presents another robust buying opportunity.
GOLD NEXT MOVE (expecting a bullish move)(15-07-2025)Go through the analysis carefully and do trade accordingly.
Anup 'BIAS for the day (15-07-2025)
Current price- 3358
"if Price stays above 3340, then next target is 3372, 3390 and 3410 and below that 3325 and 3315 ".
-POSSIBILITY-1
Wait (as geopolitical situation are worsening )
-POSSIBILITY-2
Wait (as geopolitical situation are worsening)
Best of luck
Never risk more than 1% of principal to follow any position.
Support us by liking and sharing the post.
bull trend back to GoldGold has returned back above EMAs on daily chart.
On 4h chart, there is a chance for it to break through last top level to make a new high up to 3438 .
Take a good use liquidity of CPI of US today.
You could get a great result of that.

Big Data Incoming — XAUUSD in Focus!
Core inflation data drops at 6 PM IST and traders are watching closely 👀
📈 Forecast says inflation is heating up — if actuals are higher, expect:
💵 USD strength ⬆️
🥇 Gold (XAUUSD) down ⬇️
💣 Volatility to spike!
🔥 Trade with logic, not emotion. Protect your capital. Let the market react — we react to the reaction 🧠📊
#XAUUSD #ForexNews #InflationReport #GoldAnalysis #CoreInflation #USData #TradingMindset #SmartMoneyMoves #ForexLife #PriceActionTrader #MacroMoves #TradingPsychology #NewsEventTrading #ReelForTraders #ReelTradingUpdate #GoldSetup #USDStrength

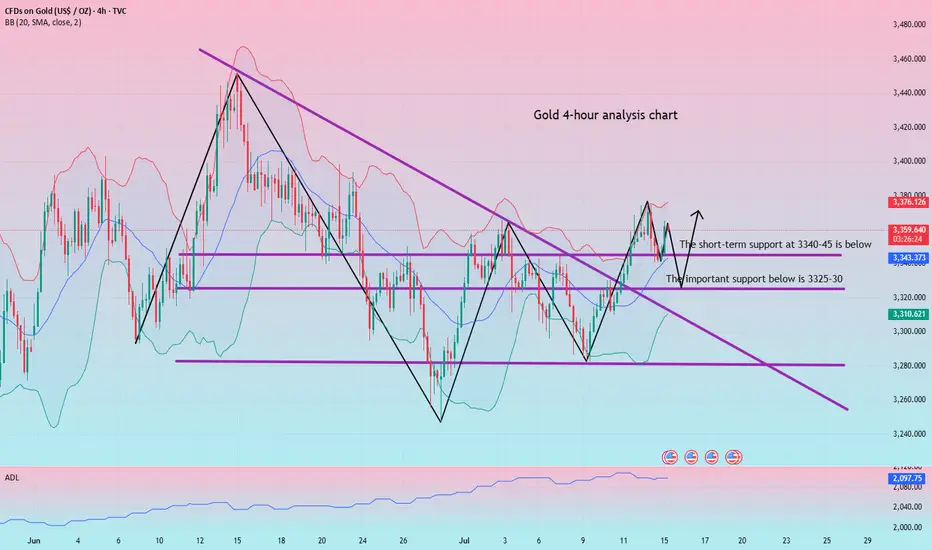
Bullish adjustments are ready to counterattack at any time
Today, we will first look at the adjustment of gold. The current overall price framework is relatively favorable to bulls. After all, after the continuous breakthrough in the previous period, the current daily line has also stood firmly above the short-term moving average. Whether it will reverse again in the future is also the key trend in the later period. Although the US market was in a retracement yesterday, it did not break the key support of 3325-30 below. This position can also be used as the key support point and watershed position in the later period. Only if this position continues to fall, it may turn from long to short in the later period. Yesterday, we had a long order at 3341 and successfully made a profit at 3348. After three consecutive trading days of rebound, the overall price finally came under pressure at the 3375 mark and ushered in a suppressed decline and shock adjustment. Although there was a shock decline adjustment in the short term, the overall technical pattern is still in the bullish shock upward rhythm. If your current gold operation is not ideal, I hope I can help you avoid detours in your investment. Welcome to communicate!
From the 4-hour analysis, the bullish strong dividing line below is 3325-30. Below, we focus on the short-term support of 3340-45. The daily level stabilizes at this position and continues to maintain the bullish rhythm of falling back and following the trend. The short-term pressure focuses on the vicinity of 3370-75. The overall main tone of high-altitude low-multiple cycle participation remains unchanged based on this range.
Gold operation strategy:
Gold falls back to 3340-45 and goes long. Fall back to 3325-30 and add more positions. Stop loss 3317. Target 3365-70. Continue to hold if it breaks;
Daily gold analysisDaily gold analysis
Sell trade with target and stop loss as shown in the chart
The trend is down and we may see more drop in the coming period in the medium term
All the best, I hope for your participation in the analysis, and for any inquiries, please send in the comments.
He gave a signal from the strongest areas of entry, special recommendations, with a success rate of 95%, for any inquiry or request for analysis, contact me
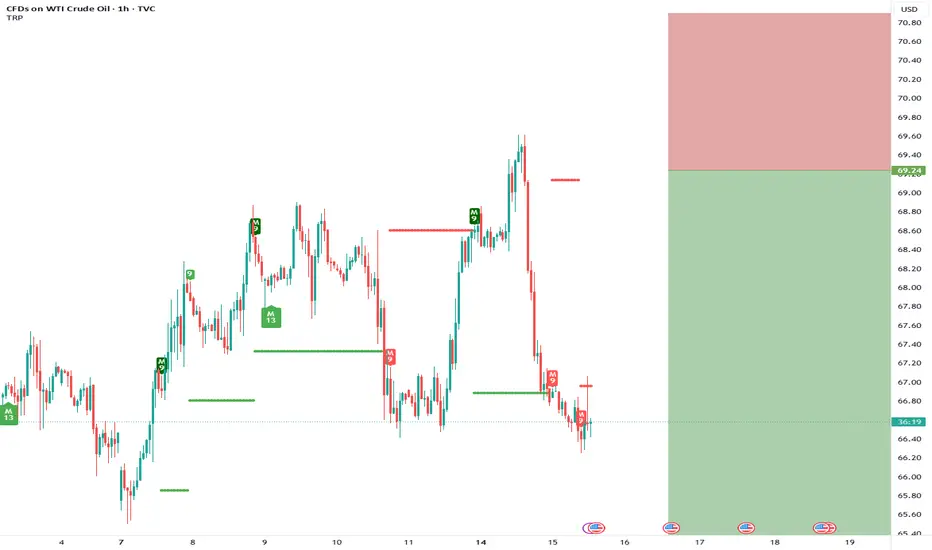
I’m short USOIL🛢️ USOIL is WTI Crude Oil, the oil that powers our world.
I’m short USOIL 📉
Too much oil is flooding the market while demand slows down.
Would you take this trade? 🤔
GOLD Intraday Chart Update For 15 July 2025Hello Traders,
Welcome to the US CPI Day, as you can see that market is in tight range for now and all eyes on the breakout for now
Only clear breakout of 3380 we will consider market will be bullish towards 3400 & 3425
If markets sustains below 3335 it will move towards 3305 or even 3285
All eyes on US CPI
Disclaimer: Forex is Risky
XAU/USDPrice action trading is a methodology in financial markets where traders make decisions based on the actual price movements of an asset over time, rather than relying heavily on technical indicators or fundamental analysis. It involves observing and interpreting patterns and trends in price charts to predict future price movements.