GoldWe have a strong bullish move and again we are moving on a bullish flag,price had just retested previous resistance turned into support so now I'm expecting buys till previous HOD
Futures market

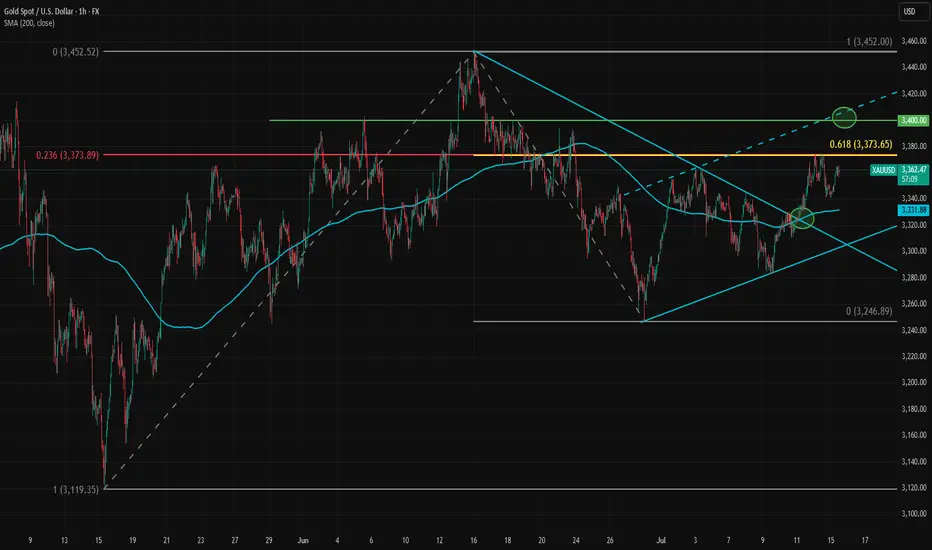
GOLD → Consolidation ahead of CPI. Chances for growth?FX:XAUUSD Gold is consolidating amid a correction in the dollar ahead of important news. Consumer price index data is due later today. The market is stagnant and will not move prematurely.
On Tuesday, gold rose slightly amid profit-taking ahead of the US CPI release. Investors are waiting for a signal from inflation: weaker data could strengthen bets on a Fed rate cut and support gold, while strong inflation would strengthen the dollar and put pressure on the metal. The situation is exacerbated by Trump's new tariff threats and his criticism of the Fed chair. Let me remind you of Trump's pressure on regulators regarding inflation and interest rate cuts.
Technically, gold is trading above the previously broken “symmetrical triangle” consolidation. Bulls are trying to hold their ground above 3340-3350. Focus on the current range of 3340-3373
Resistance levels: 3373, 3394
Support levels: 3350, 3340
Favorable news for gold could boost interest in the metal, which would generally lead to growth. However, there is a factor of unpredictability, and against this backdrop, gold may test support at 3350-3340. If the bulls manage to keep the price above this zone, we may see growth in the medium term. Otherwise, the price may drop to 3310-3280.
Best regards, R. Linda!

1507 a bull trend back to Gold Hello traders,
Gold has returned back above EMAs on daily chart.
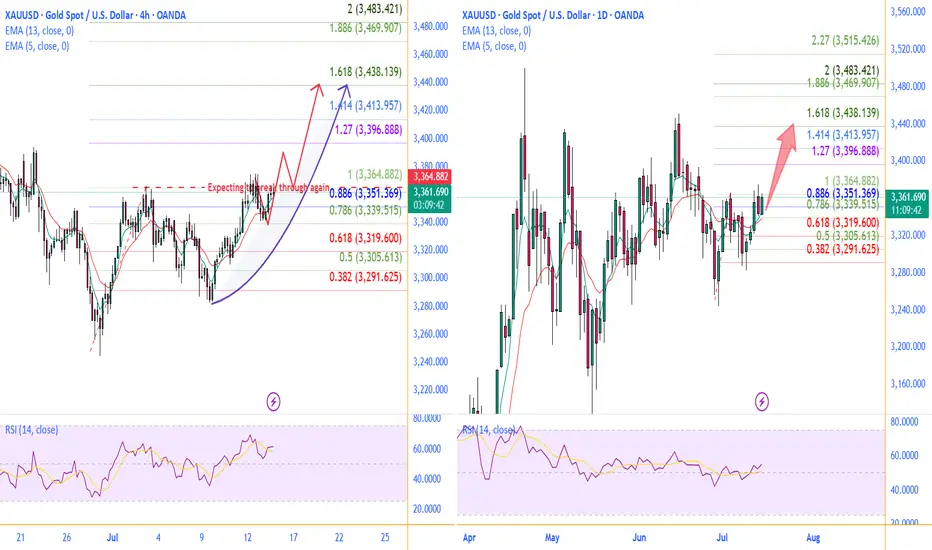
On 4h chart, there is a chance for it to break through last top level to make a new high up to 3438 .
Take a good use liquidity of CPI of US today.
You could get a great result of that.
GOOD LUCK!
LESS IS MORE!
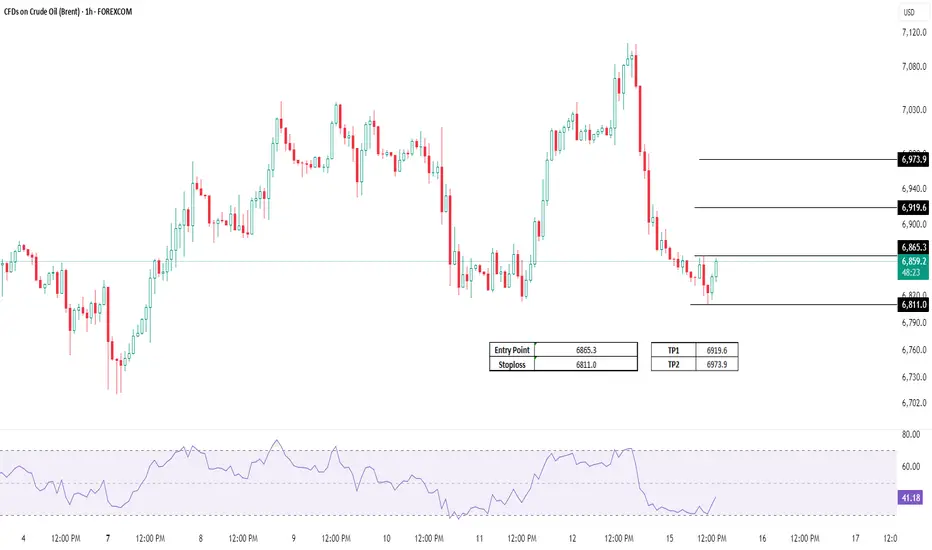
CRUDEOIL FUTURE - BULLISH VIEWCrudeoil just showed a reversal from 0.618 golden fibonnaci zone. It may go till 6000-6100 levels in coming weeks with 5700 as strong support.
please do your own research before taking any trades. This chart is only for educational purpose

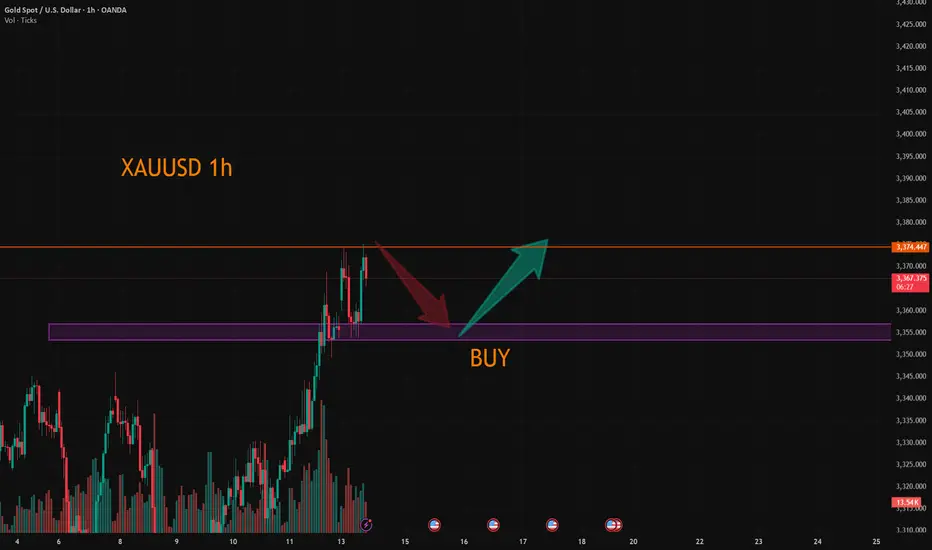
XAUUSD BUYSTemporary shorts into 3351 before CPI news release
From 3351 levels looking for buys into 3395 and above

Buy XAUUSD?Date: July 15, 2025
Pair: XAUUSD (Gold Spot)
Timeframe: 4H
Direction: Long
Entry: ~3,360
Stop Loss: ~3,327 (below sell-side liquidity)
Take Profit: ~3,492
RR Ratio: ~1:4
⸻
🔍 Market Context
• Price had been trending downward and then consolidated for several sessions.
• A sell-side liquidity sweep occurred just below 3,327 — taking out stops beneath local lows.
• Strong bullish reaction followed, forming a clean bullish order block and reclaiming structure.
⸻
🎯 Trade Rationale
• Sell-side liquidity taken → market structure shift → bullish BOS (break of structure).
• Bullish order block formed with clear mitigation.
• Small black-box consolidation likely a retest zone for low-risk entry.
• Targeting inefficiency toward 3,492, with a clean range above.
⸻
🧠 Trade Management Plan
• Move stop to breakeven at 3,375 once price clears local resistance.
• Consider partial TP at 3,420–3,450 to lock profit.
• Trail remainder to higher lows or use fib-based trailing stop.
⸻
😐 Emotional State Before Trade
Calm and focused. Recognized a textbook SMC entry — no rush or FOMO.
⸻
✅ Post-Trade Reflection (To Fill Later)
• ❓ Did price react to the zone as expected?
• ❓ Was entry execution precise (limit vs market)?
• ❓ Any slippage or management improvements?
• ❓ Was I patient enough?

XAUUSD. TRADE PLAN BULLISH 📈 Bullish Trade Plan – XAU/USD (Gold Spot) | 15-Minute Chart
🔍 Market Structure Overview:
Price recently formed a CHoCH (Change of Character), shifting from bearish to bullish structure.
A solid Higher Low (HL) has formed after the CHoCH – indicating bullish continuation.
EMAs (20, 50, 200) are stacked bullishly below price, acting as dynamic support.
Current price is pulling back into a potential demand zone and HL area for a long setup.
🟩 Long (Buy) Trade Setup
Entry Zone: 3,357.00 – 3,359.00
(around HL zone + demand area + EMA confluence)
Stop Loss (SL): 3,349.50
(below HL structure and EMA support)
Take Profit 1 (TP1): 3,370.00
(near-term resistance level)
Take Profit 2 (TP2): 3,375.00
(previous swing High / HH zone)
Take Profit 3 (TP3): 3,380.00
(liquidity target / extended bullish move)
📐 Risk-to-Reward Ratio (RRR):
Target Risk Reward RR
TP1 @ 3,370 ~7.5 pts ~13 pts ~1:1.3
TP2 @ 3,375 ~7.5 pts ~18 pts ~1:1.85
TP3 @ 3,380 ~7.5 pts ~23 pts ~1:2.5
✅ Bullish Confluences:
Confirmed CHoCH → bullish trend shift
Strong Higher Low (HL) and support forming
Price rejecting from a demand zone
EMAs (20, 50, 200) aligned in bullish direction
Clean RR setup with clear invalidation level
❌ Invalidation:
If price breaks and closes below 3,349.50, bullish bias is invalid.
That would indicate a break in bullish structure and potential reversal.
---
📘 Trading Notes:
Ideal for intra-day bullish trading setups.
Avoid trading during high-impact news events (e.g., FOMC, CPI).
Always apply proper risk management – never risk more than 1–2% of your capital on a single trade.

SILVER: Next Move Is Down! Short!
My dear friends,
Today we will analyse SILVER together☺️
The recent price action suggests a shift in mid-term momentum. A break above the current local range around 38.253 will confirm the new direction upwards with the target being the next key level of 38.151 and a reconvened placement of a stop-loss beyond the range.
❤️Sending you lots of Love and Hugs❤️

XAUUSD Analysis todayHello traders, this is a complete multiple timeframe analysis of this pair. We see could find significant trading opportunities as per analysis upon price action confirmation we may take this trade. Smash the like button if you find value in this analysis and drop a comment if you have any questions or let me know which pair to cover in my next analysis.

GOLD: Target Is Up! Long!
My dear friends,
Today we will analyse GOLD together☺️
The in-trend continuation seems likely as the current long-term trend appears to be strong, and price is holding above a key level of 3,363.43 So a bullish continuation seems plausible, targeting the next high. We should enter on confirmation, and place a stop-loss beyond the recent swing level.
❤️Sending you lots of Love and Hugs❤️

Nifty 15th-July-Trend day projection Hello everyone !!!
This is the geometric projection and price action with marked up chart for nifty
trend day
Grid-_-Work's production ©
Two Retracement Levels Converge, Creating Strong ResistanceGold is hovering near 3370 amid a wave of tariff-related headlines over the past few days. After Trump’s threats toward Mexico, Canada, and the European Union, gold has been pushing toward higher levels. The latest warning came over the weekend, targeting both the EU and Mexico with a 30% tariff unless an agreement is reached by August 1. The EU trade commissioner described the proposed tariff as “absolutely unacceptable.”
So far, markets remain calm due to ongoing delays in the actual implementation of these tariffs. However, that could change as the August deadline approaches. Trump may view it as politically damaging to issue repeated threats without following through.
Meanwhile, the EU is preparing countermeasures in case the deadline passes without an agreement and the U.S. enforces the 30% tariffs. The EU’s plan targets $84 billion worth of goods, including automobiles, aircraft, wine, bourbon, agricultural and chemical products, plastics, and electrical equipment. The outcome of U.S.-EU negotiations could be a major driver for gold in July.
Another factor to watch is the recent surge in bond yields in Japan. The rising probability that Japan’s ruling coalition may lose its majority is creating uncertainty, especially since opposition parties favor tax cuts and increased government spending. Higher Japanese yields could trigger a reversal in carry trade flows, which might also push up yields in Europe and the U.S.
Gold pushed higher, breaking out of the bearish trendline drawn from the July 13 top, and reached the 3370–3375 area. So far, this zone has provided strong short-term resistance. The 3374 is significant, as it marks both the 23.6% Fibonacci retracement level of the May–June rally and the 61.8% retracement of the June 16–30 pullback. This confluence could make it a key pivot point for gold this week.
If this level is broken, gold could gain further momentum and move above 3400. On the downside, 3342 has been acting as a support level for now.
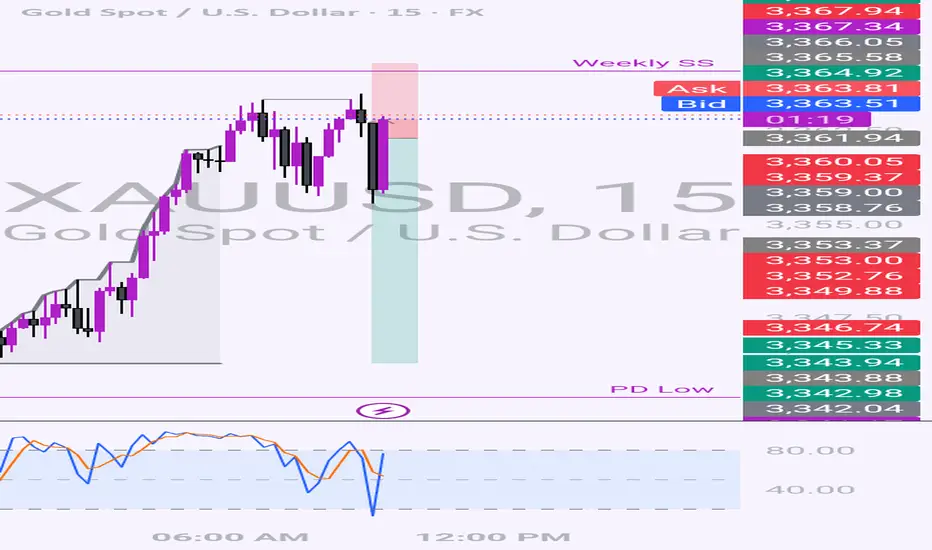
XAUUSD:Today's trading strategies for buying and selling
The gold price reached a peak of 3374.69 during the Asian trading session. Overall, it remains in a bullish uptrend. From the half-hour and hourly charts, the 30-day line provides support at around 3353. Therefore, when trading within this fluctuating range, it is important to note that in a situation where the bullish trend is strong, short selling should be conducted with a light position.
Trading Strategy:
BUY@3353-57
TP:3370-75
SELL@3375-80
TP:3360-63
More detailed strategies and trading will be notified here ↗↗↗
Keep updated, come to "get" ↗↗↗

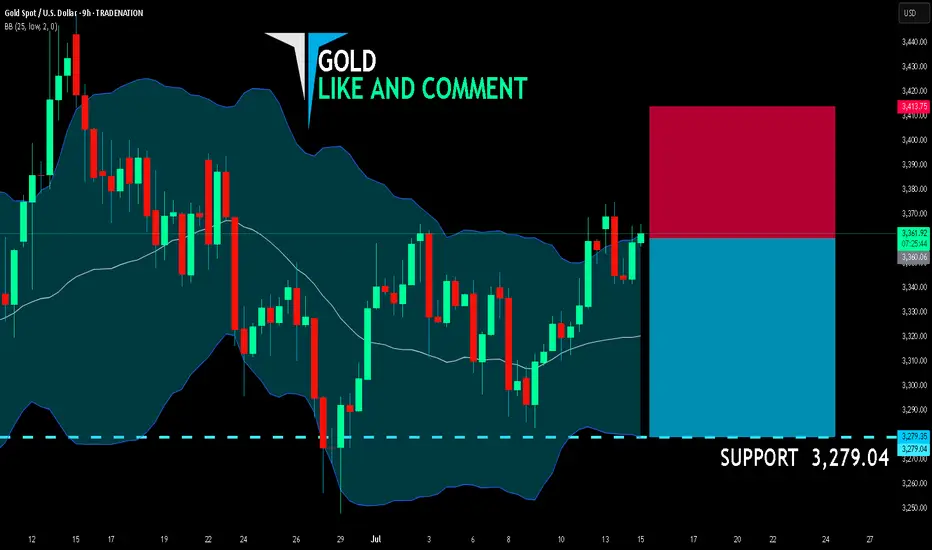
GOLD SHORT FROM RESISTANCE
GOLD SIGNAL
Trade Direction: short
Entry Level: 3,360.06
Target Level: 3,279.04
Stop Loss: 3,413.75
RISK PROFILE
Risk level: medium
Suggested risk: 1%
Timeframe: 9h
Disclosure: I am part of Trade Nation's Influencer program and receive a monthly fee for using their TradingView charts in my analysis.
✅LIKE AND COMMENT MY IDEAS✅
Excellent re-Buy opportunities as expectedAs discussed throughout my yesterday's session commentary: "My position: I have Bought Gold throughout Friday's session within #3,330's however closed earlier below #3,348.80 (missed #3,352.80 benchmark break-out) however my Profits were already great so I don't mind. Keep Buying every dip on Gold (aggressive Scalps)."
I have re-Bought Gold firstly on #3,357.80, then #3,340's many times until actual #3,360.80 reversal towards #3,342.80 where I bought Gold again twice towards #3,352.80 benchmark. My key reversal points are nicely respected by Gold.
Technical analysis: Gold is showcasing underlying Bullish trend as #3,377.80 Resistance stands between current Price-action and #3,400.80 benchmark. However if #3,337.80 gets invalidated before any of the above happens, I have a Selling breakout as DX turned Neutral again on the Short-term (and remains Bearish on the Medium-term). This uptrend is directly related to the decline on DX but even then the drop on Gold will not be so strong. It seems that Investors who Sold Gold during the current #1-Week drop, closed their positions much earlier. Theoretically it makes Investors take capital off of riskier assets and place it in safe-haven assets such as Gold. Gold is testing once again #3,357.80 new / old Resistance after series of Bullish Hourly 1 chart’s candles (Engulfing, Three Outside Up) reaching Medium-term Resistance zone on #4th straight red candlestick. The Daily chart’s Volumes are on the rise again as the Daily chart’s Ascending Channel is looking to Price in a Higher High’s as last attempt was so far unsuccessful. Based on the Monthly chart where Bullish and Bearish Months take turns, I expect the whole July / August’s fractals to remain Bullish.
My position: My strategy remains the same, Buying every dip on Gold on my calculated key entry points which Gold respects and ultimately, anticipating #3,377.80 Resistance break-out to the upside.

Gold CPI shocks and fallsThe hourly chart shows that the gold price fluctuated and consolidated at the bottom after a continuous correction, continuing the rebound trend. The key pressure level is the top and bottom conversion position. The current gold rebound is only a secondary confirmation of the top structure at the 30-minute level. After reaching 3365, the short-term has shown signs of pressure. In the volatile market, if the price begins to consolidate horizontally, it may indicate the end of this round of volatile upward trend, and it will enter a downward phase later. Considering the market sensitivity before the release of CPI data, it is recommended to focus on the volatile decline trend. After today's rebound, it is necessary to focus on the 3363-3368 area as a short-selling range, and the long and short defense position is set at yesterday's intraday high of 3375. In terms of operation, it is recommended to maintain the idea of rebounding and shorting, and pay attention to the 3340-3335 range for support below.
Operation strategy:
1. It is recommended to short gold near the rebound of 3363-3368, with a stop loss at 3375 and a target of 3350-3340.

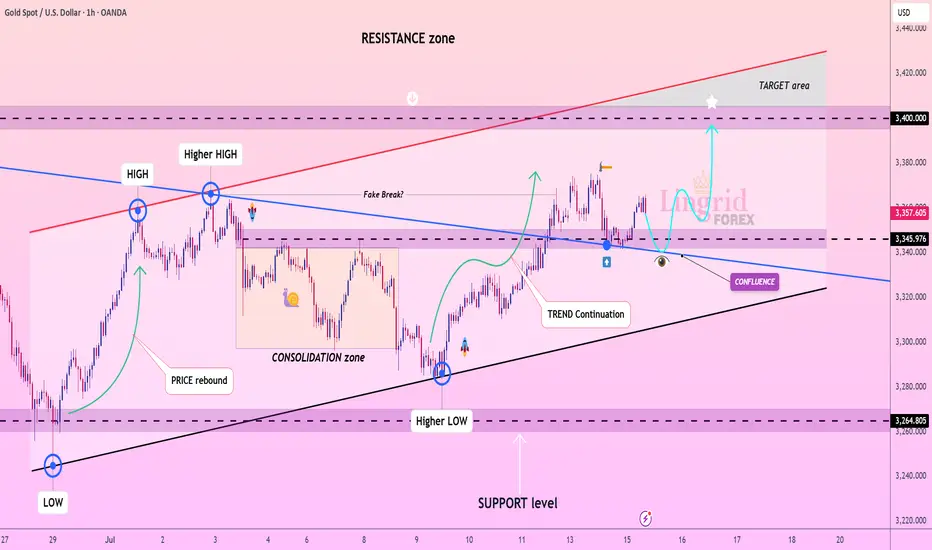
Lingrid | GOLD potential Bullish Move From Confluence ZoneOANDA:XAUUSD is forming a higher low above trend support, following a breakout from the consolidation zone and a bullish continuation leg. Price is currently pulling back toward the 3345–3350 region, which aligns with the previous breakout and key structure support. A successful retest of this area would provide confirmation for a renewed push toward the 3400 resistance zone. Momentum favors further upside if bulls defend the support and reclaim bullish control.
📉 Key Levels
Buy trigger: bullish bounce from 3345 with reclaim above 3360
Buy zone: 3345–3360 (trend support and previous breakout)
Target: 3400
Invalidation: drop below 3345 with sustained pressure cancels bullish thesis
💡 Risks
Weak volume on bounce could lead to range-bound price action
Global macro shifts may interfere with expected trend continuation
Another fake breakout near 3400 could trigger sharp rejection
If this idea resonates with you or you have your own opinion, traders, hit the comments. I’m excited to read your thoughts!
Gold 30Min Engaged ( Dual Entry's Detected )Time Frame: 30-Minute Warfare
Entry Protocol: Only after volume-verified breakout
🩸Bullish Reversal 3357 Zone
🩸Bearish Reversal 3357 Zone
➗ Hanzo Protocol: Volume-Tiered Entry Authority
➕ Zone Activated: Dynamic market pressure detected.
The level isn’t just price — it’s a memory of where they moved size.
Volume is rising beneath the surface — not noise, but preparation.
🔥 Tactical Note:
We wait for the energy signature — when volume betrays intention.
The trap gets set. The weak follow. We execute.
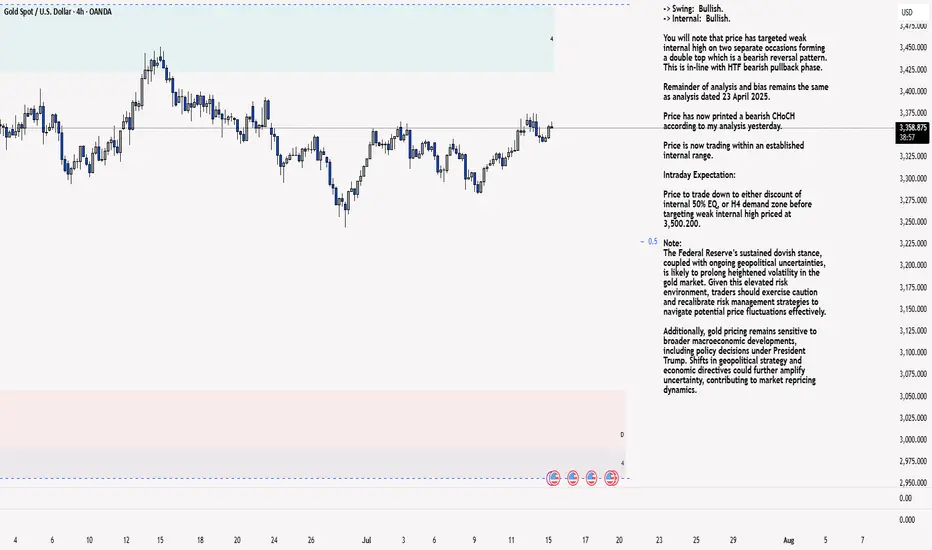
XAU/USD 15 July Intraday AnalysisH4 Analysis:
-> Swing: Bullish.
-> Internal: Bullish.
You will note that price has targeted weak internal high on two separate occasions forming a double top which is a bearish reversal pattern. This is in-line with HTF bearish pullback phase.
Remainder of analysis and bias remains the same as analysis dated 23 April 2025.
Price has now printed a bearish CHoCH according to my analysis yesterday.
Price is now trading within an established internal range.
Intraday Expectation:
Price to trade down to either discount of internal 50% EQ, or H4 demand zone before targeting weak internal high priced at 3,500.200.
Note:
The Federal Reserve’s sustained dovish stance, coupled with ongoing geopolitical uncertainties, is likely to prolong heightened volatility in the gold market. Given this elevated risk environment, traders should exercise caution and recalibrate risk management strategies to navigate potential price fluctuations effectively.
Additionally, gold pricing remains sensitive to broader macroeconomic developments, including policy decisions under President Trump. Shifts in geopolitical strategy and economic directives could further amplify uncertainty, contributing to market repricing dynamics.
H4 Chart:
M15 Analysis:
-> Swing: Bullish.
-> Internal: Bullish.
H4 Timeframe - Price has failed to target weak internal high, therefore, it would not be unrealistic if price printed a bearish iBOS.
The remainder of my analysis shall remain the same as analysis dated 13 June 2025, apart from target price.
As per my analysis dated 22 May 2025 whereby I mentioned price can be seen to be reacting at discount of 50% EQ on H4 timeframe, therefore, it is a viable alternative that price could potentially print a bullish iBOS on M15 timeframe despite internal structure being bearish.
Price has printed a bullish iBOS followed by a bearish CHoCH, which indicates, but does not confirm, bearish pullback phase initiation. I will however continue to monitor, with respect to depth of pullback.
Intraday Expectation:
Price to continue bearish, react at either M15 supply zone, or discount of 50% internal EQ before targeting weak internal high priced at 3,451.375.
Note:
Gold remains highly volatile amid the Federal Reserve's continued dovish stance, persistent and escalating geopolitical uncertainties. Traders should implement robust risk management strategies and remain vigilant, as price swings may become more pronounced in this elevated volatility environment.
Additionally, President Trump’s recent tariff announcements are expected to further amplify market turbulence, potentially triggering sharp price fluctuations and whipsaws.
M15 Chart: