Gold Short Term OutlookGold has extended its recovery after holding above the Pullback Support Zone and is now trading around 3,359, attempting to build momentum toward higher resistance levels.
The structure remains bullish with price trading above both the 50MA and 200MA , which are starting to slope upward and act as dynamic support.
A confirmed break and hold above 3,354 would open the path toward the next resistance cluster at 3,383 and potentially 3,400, with 3,416 and 3,440 as higher-timeframe resistance targets.
If price fails to hold above 3,354 and begins to fade, watch the Pullback Support Zone (3,335–3,305) closely for signs of renewed buying interest.
A clean break below that zone would shift focus to the deeper Support Zone (3,289-3,267) and potentially the HTF Support Zone (3,241–3,208) if selling pressure builds.
📌 Key Levels to Watch
Resistance:
‣ 3,364
‣ 3,383
‣ 3,400
‣ 3,416
Support:
‣ 3,354
‣ 3,335
‣ 3,305
‣ 3,289
‣ 3,267
‣ 3,241
‣ 3,208
🔎 Fundamental Focus
All eyes are on today’s U.S. CPI release
Futures market

Gold Market Regains Momentum Toward 3380Gold market looks to regain its recent shed, aligning with a daily demand mitigation at 3340–3330. This recovery hints at a bullish continuation, with price action aiming to mitigate 3380’s liquidity zone. Stay alert for confirmation as the session unfolds. follow for more insights , comment and boost idea

GOLD → Consolidation. Long squeeze before growth to 3400FX:XAUUSD has broken through resistance at 3353-3357 since the session opened, and bulls are currently trying to keep the market in the buying zone. Should we expect a long squeeze before growth?
Gold is in local consolidation after breaking through a key level. The price is still in the consolidation phase formed during a week-and-a-half correction. The price reached a three-week high of $3,374 on Monday but fell after the EU's conciliatory statements. Investors are awaiting US inflation data and Chinese GDP figures as they assess the prospects for a Fed rate cut. Heightened geopolitical and trade tensions are keeping demand for safe-haven assets high.
Technically, gold has entered a local buying zone, but there is a fairly complex resistance zone above it, and consolidation is needed to break through it. Such patterns could include a retest of support and a liquidity grab before growth.
Resistance levels: 3373, 3394
Support levels: 3357, 3353, 3345
There is a possibility of a retest of eql 3353 in a long squeeze format and a return to resistance at 3373 for a breakout. I also do not rule out a retest of the key level of 3345. The global trend is bullish, with the price locally in a fairly wide range, with an emphasis on the support zone of 3345-3355. If the bulls can hold this zone overall, the market will have a good chance of rising to 3400-3450
Best regards, R. Linda!

XAUUSD: Trading Strategy Before the US SessionAhead of the release of key US session data, gold is oscillating in a narrow range between $3340 and $3375. The daily chart shows a balance between bulls and bears. On the 4-hour chart, $3375, which coincides with the 61.8% Fibonacci retracement level, serves as a critical watershed for the market trend.
In terms of trading strategy, it's advisable to trade within the aforementioned range and follow the trend once there is a clear breakout. If gold stabilizes above $3360 and breaks through $3375, it could rally towards $3400. Conversely, if it falls below $3340 and loses the $3310 - $3320 range, it may test $3300. It's essential to confirm the direction in conjunction with fundamental news and avoid blind trading.
I am committed to sharing trading signals every day. Among them, real-time signals will be flexibly pushed according to market dynamics. All the signals sent out last week accurately matched the market trends, helping numerous traders achieve substantial profits. Regardless of your previous investment performance, I believe that with the support of my professional strategies and timely signals, I will surely be able to assist you in breaking through investment bottlenecks and achieving new breakthroughs in the trading field.

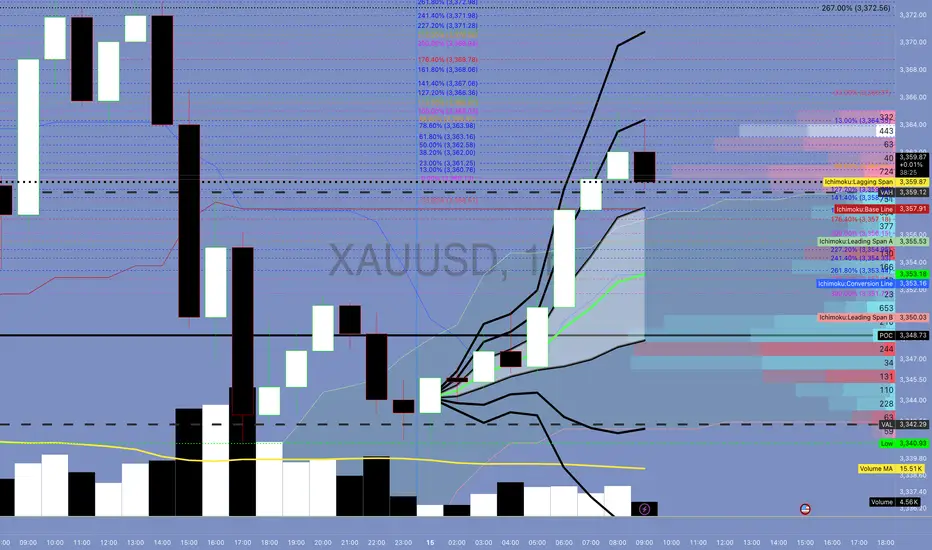
XAUMO Golden Report – Institutional Strategy Plan (July 15, 2025🚨 XAUMO Golden Report – Institutional Strategy Plan (July 15, 2025, Cairo Time)
Directional Bias: ✅ Bullish with retracement traps
Market Structure: Classic Schabacker Congestion to Continuation
Phase: Distribution > Trap Liquidity > Breakout Pullback
📊 KEY TECHNICAL LEVELS (All Cairo Time)
Level Type Price
🔺High of Day 3,374.88
🟢Key Resistance 3,366.36 - 3,368.06 (Fibo 127-161%)
🔻VAL (Daily) 3,342.29
🔵POC (High Volume) 3,348.73
🟡VWAP Confluence 3,355.37 - 3,357.14 (Golden VWAP)
🔻Volume Imbalance LQ 3,358.51 (Naked Delta Rejection)
🔫Stop Hunt Watch 3,340.93 - 3,344.50 zone
MARKET MAKER GAMEPLAN
From “Technical Analysis & Stock Market Profits,” Schabacker says:
“Congestion following a sharp advance indicates preparation for further movement in the same direction unless sharply reversed by volume reversal or exhaustion.”
That’s exactly where price is now.
What MMs are doing:
Accumulated below 3342-3350 last session.
Ripped price in Kill Hour → targeting breakout traders’ FOMO above 3360.
Current pullback = engineered trap.
AREAS OF INTEREST & LIQUIDITY
Zone 1 (Trap / Reload Zone):
3,352.74 → 3,344.50 → Strong buyer reaction last 3 touch points
VWAP + FVRP + POC = confluence reload
Zone 2 (Fakeout / Bull Trap):
3,366 → 3,372 → Upper golden fib extensions + cluster volume delta divergence (see footprint)
💎 THE JEWEL TRADE
🔰 “Best R:R + Structure + Volume Alignment”
BUY LIMIT @ 3,348.50
SL: 3,340.00
TP1: 3,360
TP2: 3,368.50
TP3: 3,374.00
🧠 Backed by:
Schabacker’s congestion re-entry logic
VWAP golden reload
High delta absorption under consolidation
🎯 Confidence: 85%
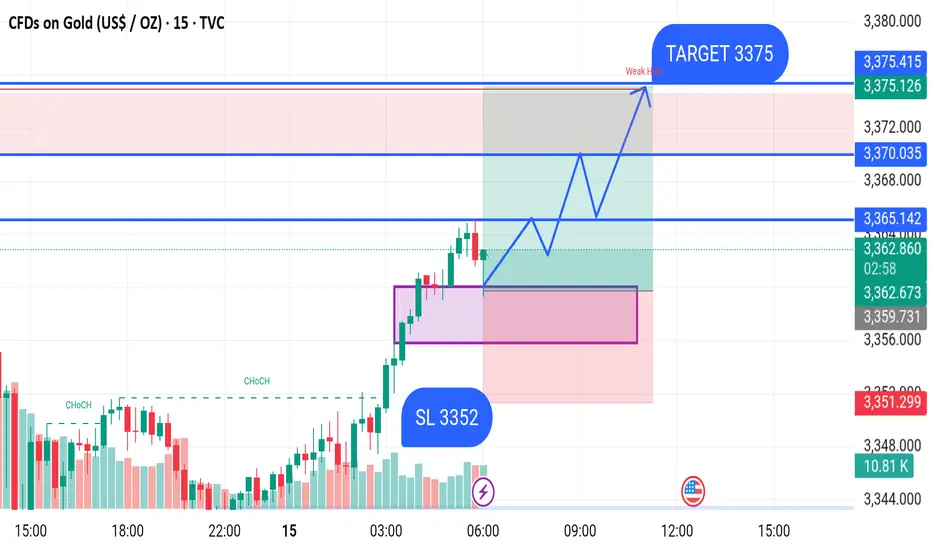
GOLD BUY M15 XAU/USD (Gold) 15-Minute Chart Analysis – July 15, 2025
Gold is currently trading around 3362.050, showing strong bullish momentum after a Change of Character (CHoCH) confirmation. Price has broken previous structure highs and is now expected to continue the upward trend.
A bullish order block (marked in purple) has been identified as a demand zone, which could act as a strong support if the price pulls back.
Entry Plan:
Buy on a retest near the demand zone.
Stop Loss (SL): 3352
Target (TP): 3375
Key Levels:
Support Zone (Demand Area): 3352–3360
Resistance Levels:
Minor resistance: 3365.142, 3370.035
Final target zone: 3375 (Weak High)
Price is expected to form higher highs and higher lows on its way toward the target. Watch for a clean retest of the demand zone for a potential long entry.
XAUUSD – Bearish Setup: Watching Entry Below Key Level🔹 Current View:
Price is falling from the Shooting Star Candle + Supply zone and is now near a key short-term support at 3295.
🔹 My Plan:
I'm waiting for a clear break and close below 3295 to enter a short trade.
➡️ Entry: 3295 (breakout confirmation)
➡️ Target: 3266
➡️ Further drop possible toward demand zone below
🔹 Supply Zones Noted:
- 3340–3350: Supply + Shooting Star
- 3360–3370: Supply + FVG
If price respects the supply zones and breaks below 3295, we may see continuation to the downside.

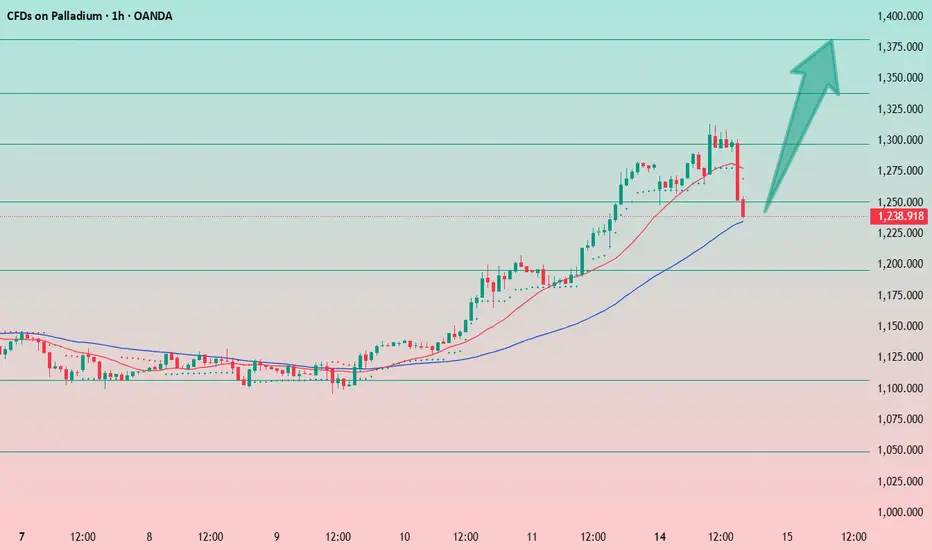
Palladium Pullback Offers Long Opportunity Amid UptrendPalladium has undergone a solid correction.
The bullish factors remain in place. I believe the current level is acceptable for entering a long position, with a stop at 1230.
If the stop is hit, we’ll need to reassess further long opportunities.
No shorts on metals — only longs for now! The market is in an upward trend.
XAUUSD SELL 3428On the 4-hour chart, XAUUSD stabilized and rebounded, and short-term bulls took the lead. At present, we can pay attention to the area around 3428, which is a potential short position of the bearish bat pattern, and this position is in the previous supply area.

XAUUSD MULTI TIME FRAME ANALYSISHello traders , here is the full multi time frame analysis for this pair, let me know in the comment section below if you have any questions , the entry will be taken only if all rules of the strategies will be satisfied. wait for more price action to develop before taking any position. I suggest you keep this pair on your watchlist and see if the rules of your strategy are satisfied.
🧠💡 Share your unique analysis, thoughts, and ideas in the comments section below. I'm excited to hear your perspective on this pair .
💭🔍 Don't hesitate to comment if you have any questions or queries regarding this analysis.

Gold/XAUUSD Analysis Breaks Bullish Channel – Targeting 3400+🟨 Market Context:
Gold (XAU/USD) has recently completed a significant technical move that signals the potential start of a strong bullish continuation phase. After a period of consolidation inside a descending channel, price has broken above key resistance levels and is showing firm buyer strength across the board.
🔍 Technical Structure Breakdown:
🔹 Descending Channel (Consolidation Phase)
For several sessions, gold was confined within a well-defined descending channel, which typically indicates a temporary correction in a broader bullish trend. This phase served as a liquidity-building zone where smart money accumulated long positions.
🔹 Breakout & Retest Confirmation
The breakout above the upper boundary of the channel was clean and impulsive, confirming bullish intent. This breakout aligned perfectly with a previous demand zone (now retested as support), adding strong confluence.
Key Breakout Zone: $3,330–$3,340
Retest Action: Price pulled back to test the breakout zone, respected it, and printed a bullish reversal.
This behavior confirms the “breakout–retest–continuation” pattern—highly reliable in trending markets.
🔹 SR Interchange – Key Pivot Zone
The level around $3,340 served a dual role:
Previously acted as resistance within the channel.
Now acting as support post-breakout (SR flip).
This interchange area is significant because it reinforces the idea that bulls are now defending this level aggressively.
🔹 Bullish Pattern Confirmation
A bullish price pattern has formed exactly at the SR zone and near the trendline. This double confluence (pattern + level) provides high-probability trade setups and confirms the entry point for buyers.
🔹 Ascending Trendline Support
An emerging bullish trendline is now guiding the move upward, confirming that the market has shifted its short-term trend. Every bounce on this trendline reinforces bullish structure and validates higher-low formations.
🎯 Price Targets & Expectations:
✅ Previous Target Zone:
Around $3,375, already tapped and respected.
This shows that gold is following technical targets with precision.
🎯 Next Bullish Target:
$3,400 – $3,410 zone stands as the next supply region.
This area is a major psychological resistance and aligns with historical reaction points.
🧠 Trading Insight & Strategy:
With current price action and momentum, buying dips remains the optimal approach, provided the price stays above the SR Interchange zone.
🔽 Entry Zone: $3,345 – $3,350
📈 Targets:
TP1: $3,375 (partial exit)
TP2: $3,400–$3,410 (final target)
❌ Invalidation Zone (Stop Loss): Below $3,330
Breaking below this would invalidate the breakout structure and possibly signal a false breakout.
📌 Summary:
✅ Clear breakout from descending channel
✅ Retest of previous demand and SR flip zone
✅ Bullish pattern confirmed on key support
✅ Ascending trendline intact
🎯 Next logical move: $3,400+
The gold market is giving strong bullish cues, and this setup could be a textbook example of “buy the breakout, ride the trend.”
Stay sharp, trade smart, and keep your risk in check. 👑

XAUUSDGold is likely to correct to the price level of 3350. After that, we should wait for the reaction of buyers and sellers in this price range.

Eyes on the Gap – Discipline Over FOMO NQ📌 Waiting for High-Probability Levels to Engage
Right now, price has been stuck in a multi-week range, coiling just beneath major resistance and above strong demand. I’m not forcing trades — I’m waiting for price to reach the key gap zone and confirmed strong support near 22,781.75.
No reason to act until the market gives me a clear setup.
The real move will come from the edges — not the middle.
🔹 Support Confluence: Gap fill zone + Strong Support label
🔹 Range Context: Price capped under ATH & recycling between session highs/lows
🔹 Bias: Bullish only after sweep or confirmed hold of the lower zone
💬 Discipline is waiting when others get chopped up in the middle. Let the trap spring — then strike.
#PlaymakerTrading #GapZone #SmartMoneyLevels #NQFutures #MarketStructure #SupportAndResistance

Gold – M15 Downtrend in Play | July 15 Analysis🔻 Gold (XAUUSD) – July 15 Analysis | Bearish Bias Until Proven Otherwise
The market has entered a pullback phase on H4, and we’re expecting a potential retest of the 3320 Order Block before any continuation of the broader uptrend resumes.
🔍 M15 Market Structure:
✅ ChoCH followed by BoS confirms a downtrend on M15
🎯 Current short-term objective: Retest of H4 OB (3320)
📍 Price Action Context:
Price is now revisiting the same M15 POI where yesterday’s short setup originated.
Last session, this POI was respected, but instead of creating a new Lower Low, price is trading inside the same zone again.
This signals indecision — so we let price reveal its intent
🧭 Trade Planning Scenarios:
Scenario 1 – Bearish Continuation:
→ If the POI is respected again with clear M1 confirmation ( Micro-ChoCH + BoS ), we will plan for a short setup toward 3320
Scenario 2 – POI Breaks:
→ If price breaks above this POI zone, the next key level to observe is the 3355–3359 supply zone
→ We’ll reassess from there based on new confirmation
📌 Bias for Today:
🔻 Bearish bias remains intact as long as M15 structure does not shift back to bullish.
All setups must align with structure — we are short-biased only until the market proves otherwise
📖 Structure before emotion. Let the market invite you — not the other way around.
📘 Shared by @ChartIsMirror

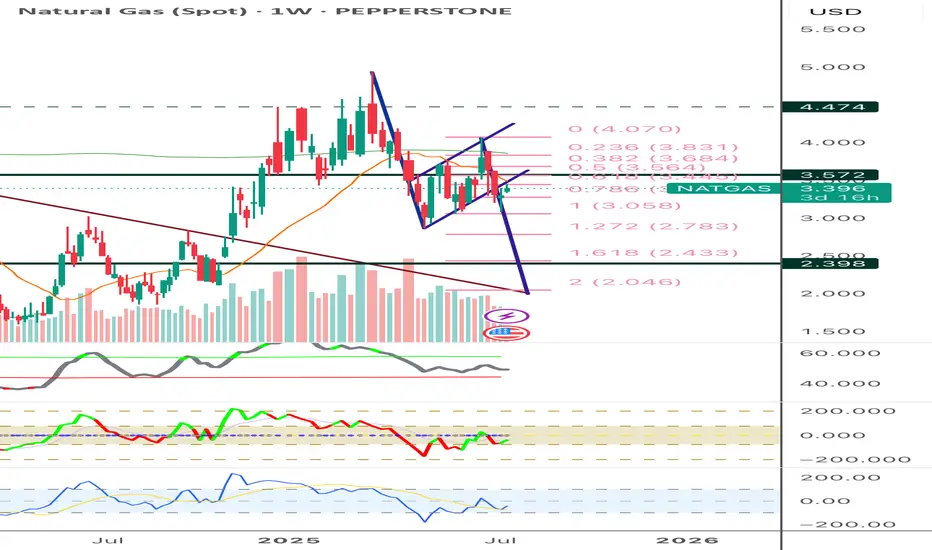
Natural Gas NGThis is just for my own learning purposes. To keep track of how indicators work. This is not for trading.

Gold is showing signs of bearish RSI divergence.🚨 Gold Update – Potential Selling Opportunity Ahead 🚨
Gold is showing signs of bearish RSI divergence on the 15-minute chart, while the RSI is already in the overbought zone. The price is also approaching a key supply zone, which could trigger a reversal.
📉 Multiple confirmations are pointing toward a potential sell setup:
Bearish RSI divergence
Overbought RSI condition
Approaching a strong supply zone
If price breaks below the 8 EMA with a bearish engulfing candle, it may confirm downward momentum.
⚠️ Watch closely — This setup is shaping up with solid confluence.
🔍 Always do your own research (DYOR) – This is not financial advice.

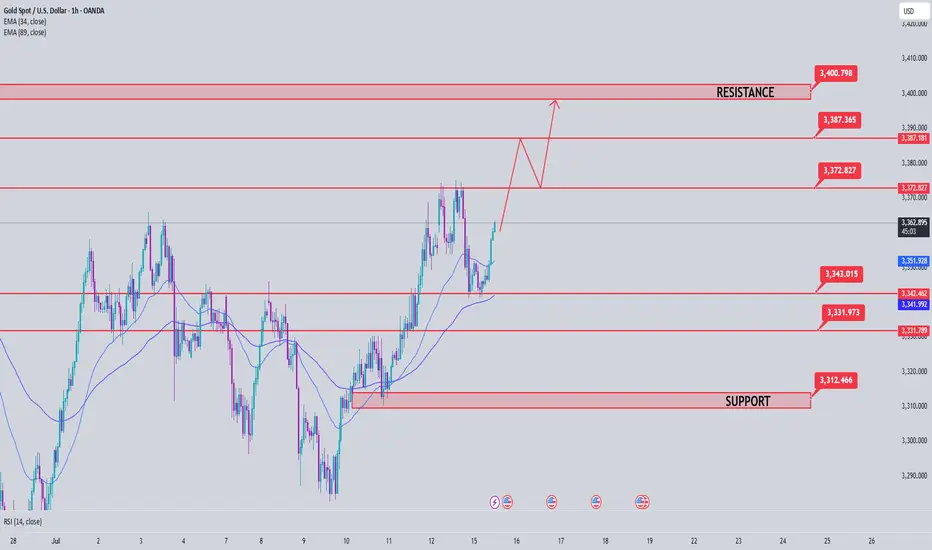
Gold Price Analysis July 15Continued uptrend after touching the 3345 buy zone
As analyzed at the beginning of the week, gold price has touched the buy zone around 3345 and continues to maintain the bullish wave structure, heading towards the 3400 resistance zone.
Currently, if gold breaks the 3373 mark, the uptrend is likely to be further strengthened. At that time, it is not advisable to trade against the trend, especially when the buyers completely control the market.
However, in case gold falls below the 3343 support zone (the resistance level in yesterday's US session), the current uptrend may be temporarily interrupted. At that time, the market will need to form a new momentum to establish the next trend.
🔑 Important price zones:
Support: 3343 – 3330 – 3313
Resistance: 3373 – 3387 – 3400
📌 Trading strategy:
Hold BUY order at 3345, expected target 3400
Activate SELL order if there is a clear price rejection signal at 3373 or 3387 (with confirmation of selling pressure)
SELL at 3400 if the strong resistance zone reacts clearly
Gold recently tapped into key liquidity zones✨ Gold Market Update – Key Insights You Need to Know ✨
Gold recently tapped into key liquidity zones—specifically the highs of the previous day and the previous week. After grabbing liquidity at those levels, the market closed below them, signaling a potential shift in momentum.
🔻 What could be next?
This price behavior suggests we might see further downside in the short term, possibly targeting the Fair Value Gap (FVG) below. If that area is reached, the market may find support and stage a rebound, potentially triggering a strong bullish move from that zone.
📊 What to watch for:
Price reaction around the FVG
Confirmation of support before entering any long positions
Volume and structure shifts on lower timeframes
⚠️ Disclaimer: This is not financial advice. Always Do Your Own Research (DYOR) and manage risk wisely.

XAUUSD 2H | Smart Money Buy from Strong DemandXAUUSD 2H | Support Rejection with Upside Targets 🎯
Price respected the key support zone and is now showing bullish momentum. Two clear target levels are marked above. Ideal buy opportunity after rejection confirmation from demand zone. Watch for clean continuation toward 3370 and 3390.
#XAUUSD #GoldAnalysis #SmartMoneyConcepts #SMC #Forex #PriceAction #BuySetup

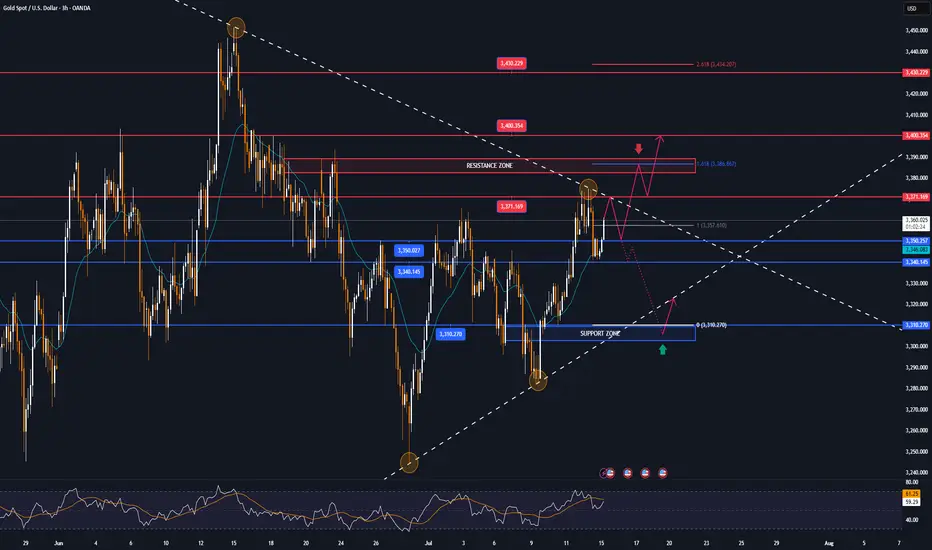
GOLD again targets $3,371, new bullish cycle conditionToday (Tuesday, July 15), in the Asian market, the spot OANDA:XAUUSD maintained a slight recovery trend, currently at around 3,360 USD/ounce.
The spot OANDA:XAUUSD rose to a 3-week high on Monday, but quickly fell back and finally closed lower. Trump's open attitude towards trade negotiations has improved the market's risk-on sentiment and negatively impacted gold, a safe-haven asset. But gold still has a lot of potential risks for price increases, and personally, the fundamental trend for gold has not changed.
The US Bureau of Labor Statistics will release its June Consumer Price Index (CPI) report today (Tuesday).
According to a Reuters survey, economists expect the US CPI to increase year-on-year in June to 2.7% from 2.4% the previous month, while the core CPI is expected to increase year-on-year to 3% from 2.8%.
The survey also showed that the US CPI is expected to increase 0.3% month-on-month in June, and the core CPI is also expected to increase 0.3% month-on-month.
According to the Chicago Mercantile Exchange's "FedWatch Tool", the market believes that the Fed is unlikely to cut interest rates in July and the probability of keeping interest rates unchanged in September is about 30%.
If the US core CPI rises by 0.4% or more in June, this could prompt market participants to reassess the possibility of a rate cut in September. In this case, the US Dollar could hold steady and push gold prices lower. On the other hand, if the data is lower than expected, gold will become more attractive while a weaker Dollar will be positive for gold prices.
Technical Outlook Analysis OANDA:XAUUSD
After gold reached the resistance target of attention to readers in the weekly publication at 3,371 USD, which is the location of the 0.236% Fibonacci retracement, it fell slightly but is now recovering positively.
Currently, gold is trading in the range of 3,360 USD, the price action above the lower edge of the long-term rising price channel with support from the EMA21, gold is now likely to continue to retest the 0.236% Fibonacci retracement level.
If gold breaks above $3,371 it will be eligible for a new bullish cycle, with the target then being around $3,400 in the short term, more so than $3,430.
On the other hand, the RSI is pointing up, maintaining activity above 50, and this should be considered a positive signal in terms of momentum. It shows that there is still a lot of room for growth ahead.
However, as of now, gold is still neutral in terms of trend, with conditions gradually tilting towards the possibility of price increase.
Along with that, the notable positions will be listed as follows.
Support: $3,350 – $3,340 – $3,310
Resistance: $3,371 – $3,400 – $3,430
SELL XAUUSD PRICE 3390 - 3388⚡️
↠↠ Stop Loss 3394
→Take Profit 1 3382
↨
→Take Profit 2 3376
BUY XAUUSD PRICE 3304 - 3306⚡️
↠↠ Stop Loss 3300
→Take Profit 1 3312
↨
→Take Profit 2 3318
Gold Fibonacci for the weekGold respects a smooth Fibonacci for the week. The pair is moving within a range, therefore the market is expected to move within the Fibonacci.

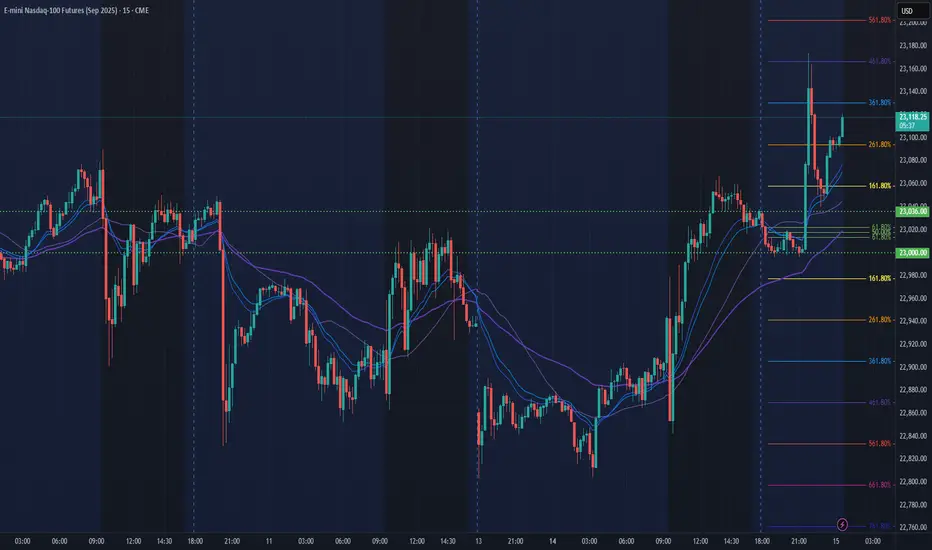
NQ Power Range Report with FIB Ext - 7/15/2025 SessionCME_MINI:NQU2025
- PR High: 23036.00
- PR Low: 23000.00
- NZ Spread: 80.5
Key scheduled economic events:
08:30 | CPI (Core|MoM|YoY)
Asian hours vol spike breakout swing into new ATHs
Session Open Stats (As of 12:15 AM 7/15)
- Session Open ATR: 290.39
- Volume: 42K
- Open Int: 276K
- Trend Grade: Neutral
- From BA ATH: -0.3% (Rounded)
Key Levels (Rounded - Think of these as ranges)
- Long: 23239
- Mid: 21525
- Short: 20383
Keep in mind this is not speculation or a prediction. Only a report of the Power Range with Fib extensions for target hunting. Do your DD! You determine your risk tolerance. You are fully capable of making your own decisions.
BA: Back Adjusted
BuZ/BeZ: Bull Zone / Bear Zone
NZ: Neutral Zone