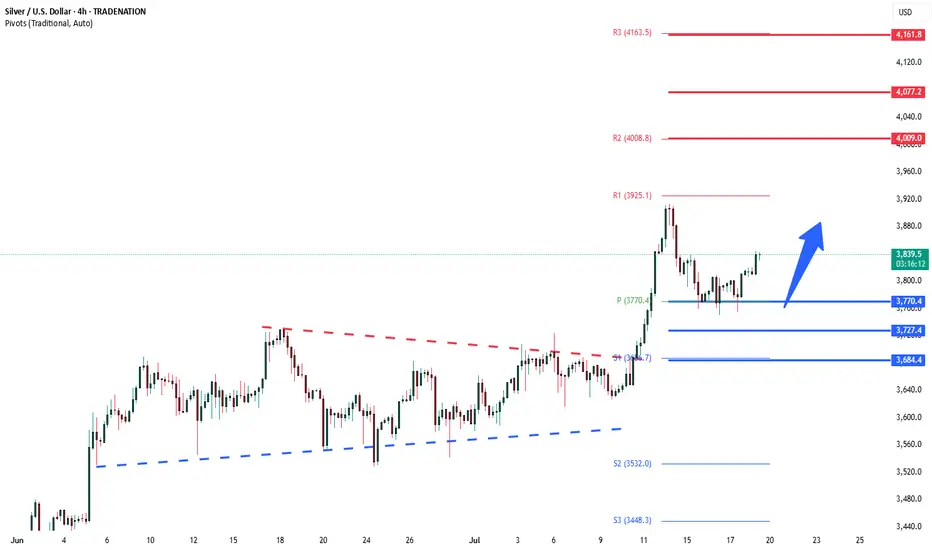
Silver bullish above 3770The Silver remains in a bullish trend, with recent price action showing signs of a continuation breakout within the broader uptrend.
Support Zone: 3770 – a key level from previous consolidation. Price is currently testing or approaching this level.
A bullish rebound from 3770 would confirm ongoing upside momentum, with potential targets at:
4000 – initial resistance
4077 – psychological and structural level
4160 – extended resistance on the longer-term chart
Bearish Scenario:
A confirmed break and daily close below 3770 would weaken the bullish outlook and suggest deeper downside risk toward:
3727 – minor support
3685 – stronger support and potential demand zone
Outlook:
Bullish bias remains intact while the Silver holds above 3770. A sustained break below this level could shift momentum to the downside in the short term.
This communication is for informational purposes only and should not be viewed as any form of recommendation as to a particular course of action or as investment advice. It is not intended as an offer or solicitation for the purchase or sale of any financial instrument or as an official confirmation of any transaction. Opinions, estimates and assumptions expressed herein are made as of the date of this communication and are subject to change without notice. This communication has been prepared based upon information, including market prices, data and other information, believed to be reliable; however, Trade Nation does not warrant its completeness or accuracy. All market prices and market data contained in or attached to this communication are indicative and subject to change without notice.
Futures market
Gold Buying every dip as expectedTechnical analysis: Interesting turn of events regarding the Short-term as Gold crossed the second Resistance (and is Trading #2 points above it currently) on the Hourly 4 chart and crossed aswell #6-session High’s, which may result as an traditional Buying back every dip (as I advice Traders to Buy every local Low’s recently / what I am doing personally), offering no Selling continuation patterns to Trade by. This is an additional Short-term Buying signal similar to cycle of February #2 - #5 #2020 parabolic rise, which ended as an correction. Hourly 4 chart is under much needed consolidation (current dip Buying) near #3,352.80 benchmark and is again leaning on Bullish side rather than Neutral, as Gold is still ignoring strong Overbought levels following mostly losses on DX (taking strong hits), turning as well Oversold in the process as global Geo-politics dust rises, and as long those guide the market sentiment, further uncertainty on Gold is inevitable and Buying underlying trend will persist.
My position: I repeat / keep in mind that Swing Trading is not possible currently on Gold as Scalp / in & out aggressive orders are key to make excellent Profits (I will advise when to continue with Swing orders). I have firstly Bought Gold on #3,324.80 throughout yesterday’s session and closed my set of Buying orders on #3,332.80 Resistance and since I knew news may push Gold down, had Buy limit on one of my possible reversal points of #3,307.80 / #3,310.80 / #3,313.80 which worked nicely. This was one of many brilliant weeks of Scalping the market. Keep in mind that #MA50 on Daily chart plays big role currently and whether Gold establishes it as an Support or Resistance, major trend will continue. I do believe it will be established as an Support and that’s why I maintain my #3,377.80 and #3,400.80 Medium-term Targets. Enjoy the Profits!

Gold returns to 3500Refer to my previous trading idea. Gold retreated as expected. We almost caught the highest point of the day and shorted gold near 3365, and successfully hit TP: 3346, which enabled us to successfully profit 190pips in short-term trading, with a profit of nearly $10K, which is a good result in short-term trading.
Currently, the lowest point of gold in the retracement process has reached around 3335, which has fully released the short energy and vented the bearish sentiment in the market. All the bad news is out, which means good news! Although gold fell from 3375 to 3335, the retracement was as high as $40, but the rising structure has not been completely destroyed. The previous W-shaped double bottom support structure and the resonance effect of the inverted head and shoulder support structure still exist. As long as gold stays above 3325, gold bulls still have the potential to attack.
Moreover, after this round of retracement, the bearish sentiment of gold was vented, and the liquidity was greatly increased, attracting more buyers to actively enter the market. Gold may start a retaliatory rebound, and even touch 3375 again or even break through and continue to the 3380-3390 area.
So for short-term trading, I think we can try to go long on gold in the 3335-3325 area appropriately, first looking forward to gold regaining lost ground: 3350-3360 area, followed by 3380-3390 area.
I am a trader with 10 years of experience. I started from nothing and burned my account overnight. If you are a novice or your account is being burned, please contact me. I will give you free professional advice.
In trading, the long way is the shortcut⚠️ The Shortcut Is an Illusion — And It Will Cost You
In trading, everyone wants to arrive without traveling.
They want the profits, the freedom, and the Instagram lifestyle — even if it’s fake.
What they don’t want is the process that actually gets you there.
So they chase shortcuts:
• Copy signals without understanding the reason behind them
• Over-leverage on “the perfect setup”
• Buy indicators they don’t know how to use
• Skip journaling and backtesting
• Trade real money without trading psychology
And then they wonder…
Why is my account bleeding?
Why does this feel like a cycle I can't break?
Because:
Every shortcut in trading is just a fast track to disaster.
You will lose. You will restart. And it will take even longer than if you just did it right the first time.
🤡 The TikTok Fantasy: “1-Minute Strategy That Will Make You Millions in 2025”
This is the new wave:
A 60-second video showing you a magical indicator combo.
No context. No testing. No risk management.
Just fake PnL screenshots and promises of millionaire status before next summer.
“This 1-minute scalping strategy made me $12,000 today!”
And people fall for it… because it’s easier to believe in shortcuts than to accept that real trading is boring, repetitive, and hard-earned.
If it fits in a TikTok video, it’s not a strategy. It’s clickbait.
________________________________________
❓ Looking for a System Without Knowing the Basics
Here’s the paradox:
Most people are desperate to find a “profitable strategy” — but they haven’t even mastered the basic math of trading.
• They don’t know how pip value is calculated
• They don’t understand how leverage works
• They confuse margin with risk
• They size positions emotionally, not based on their account
• They can’t define what 1% risk per trade actually means in dollars
But they’re out here, loading indicators, watching YouTube “hacks,” and flipping accounts with 1:500 leverage.
Imagine trying to perform surgery before learning anatomy.
That’s what trying to trade a strategy without knowing pip cost looks like.
________________________________________
🛠️ The Long Way Is the Fastest Way
You want the real shortcut?
Here it is:
• Learn price structure deeply
• Backtest like a scientist
• Journal like a professional
• Risk small while you're learning
• Stay on demo until your edge is proven
• Master basic math: leverage, margin, pip value, position sizing
This is the long way.
But it’s the only way that doesn’t end in regret.
________________________________________
⏳ Most Traders Waste 2–5 Years Looking for a Shortcut
And in the end?
They crawl back to the long path.
Broke, humbled, and wishing they had just started there from the beginning.
The shortcut is a scam.
The long way is the only path that leads to consistency.
You either take it now… or take it later — after your account pays the price.
________________________________________
✅ Final Thought
Don’t ask how fast you can get profitable.
Ask how solid you can build your foundation.
Because in trading:
❌ The shortcut costs you everything
✅ The long way gives you everything
And the longer you avoid it, the longer it takes.


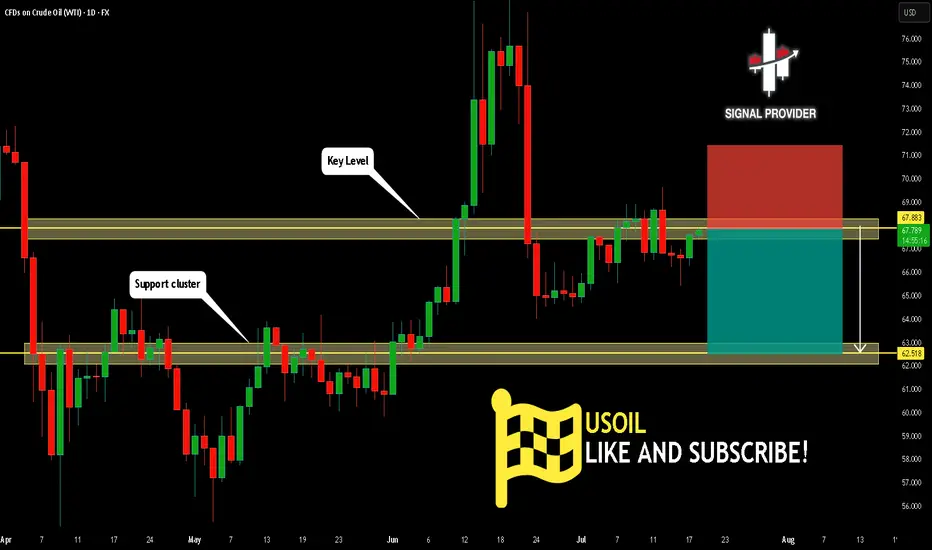
USOIL Will Go Lower! Sell!
Take a look at our analysis for USOIL.
Time Frame: 1D
Current Trend: Bearish
Sentiment: Overbought (based on 7-period RSI)
Forecast: Bearish
The price is testing a key resistance 67.883.
The above-mentioned technicals clearly indicate the dominance of sellers on the market. I recommend shorting the instrument, aiming at 62.518 level.
P.S
Overbought describes a period of time where there has been a significant and consistent upward move in price over a period of time without much pullback.
Disclosure: I am part of Trade Nation's Influencer program and receive a monthly fee for using their TradingView charts in my analysis.
Like and subscribe and comment my ideas if you enjoy them!
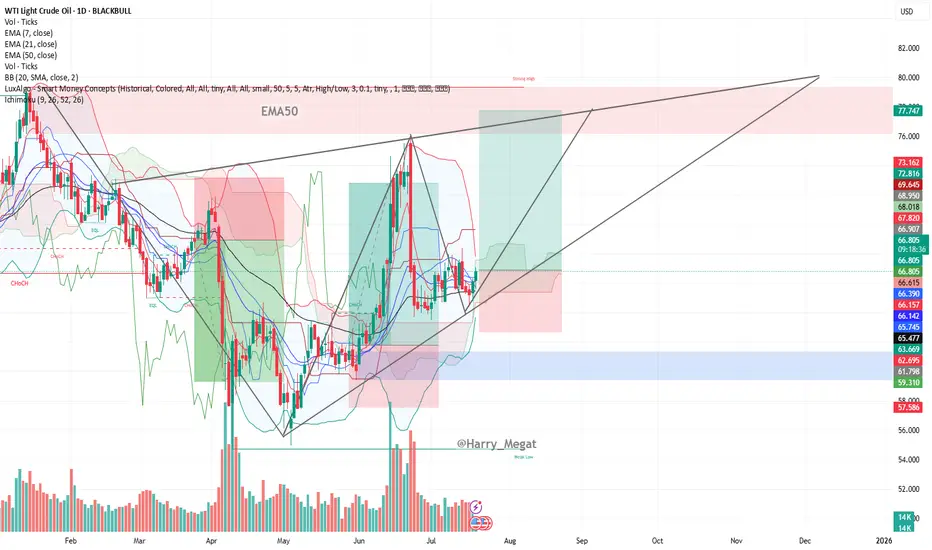
WTI Crude Oil Daily Chart Analysis (symmetrical triangle)WTI Crude Oil Daily Chart Analysis
**Trend & Structure:**
* The chart displays a **symmetrical triangle** formation, signaling a **potential breakout setup**.
* Price is currently trading around **\$66.78**, gradually rising from its recent consolidation.
* **Higher lows** and **lower highs** indicate a tightening range, which usually precedes a sharp move.
**Support & Resistance:**
* **Support Zone:** Around **\$65.47–\$66.15**, marked by the 50 EMA and prior price reactions.
* **Resistance Levels:**
* **\$68.95** – Short-term resistance and previous peak.
* **\$72.81** – Strong horizontal resistance.
* **\$77.75–\$80.00** – Projected upper trendline zone of triangle.
**Moving Averages (Bullish Setup):**
* EMA 7: **\$66.15**
* EMA 21: **\$66.14**
* EMA 50: **\$65.47**
* All EMAs are aligned in bullish order (7 > 21 > 50), confirming **bullish momentum**.
**Volume Insight:**
* Volume remains relatively steady; a spike in volume with breakout from the triangle would confirm trend continuation.
**Trade Setup Suggestion (based on chart):**
* **Breakout Buy Idea:** If price breaks above **\$68.95–\$70**, potential upside to **\$77–\$80**.
* **Invalidation:** A break below **\$65** would invalidate the bullish structure.
**Conclusion:**
WTI crude oil is trading within a symmetrical triangle, supported by bullish EMAs and tightening price action. A breakout above \$69 could trigger a bullish rally toward \$77–\$80. Keep an eye on volume confirmation and geopolitical headlines that can impact oil fundamentals.
XAUUSDsell gold for a continuous bearish order flow
Looking a a continuous downside to 3000 till September when rate cut is more probable

LONG SILVERDirection: Bullish
Moving Average: Red above Blue
Pattern Impulse: Impulse correction
Fib Retracement: 38.2
MACD > 0
1st Target = 39.11
2nd Target = 39.87
RISK: Silver already making new highs

How to seize deterministic trading opportunities?The rebound momentum of the gold market has been significantly enhanced today. After breaking through the 3345 resistance in the Asian session, it has continued to rise. It has now reached around 3360, and has rebounded by more than US$50 from this week's low of 3310, setting a new rebound high in the past three trading days. After the gold price effectively broke through the key resistance band of 3340–3350, it triggered some short stop loss trading and trend funds to enter the market, driving the price to accelerate the upward trend. Judging from the hourly chart, the trading volume has increased by about 30% compared with the same period yesterday, indicating that the market's recognition of this round of rebound has increased significantly.
A physically full sun candle chart has been closed in the 4-hour cycle, successfully standing on the Bollinger middle track, further confirming the upward structure, the mid-track support area 3340–3345 has become a key position for bulls' defense, and the short-term structure of the market is still relatively strong. Overall, the intraday retracement range of gold is limited, and the probability of continuing to rise is relatively high. In terms of strategy, it is still recommended to go long. In the short term, focus on the 3340–3345 area retracement support, and the stop-profit target is 3365–3370; if the upward breakthrough, pay attention to the suppression performance of the 3370–3375 line, beware of highs and falls, and pay attention to controlling risks.
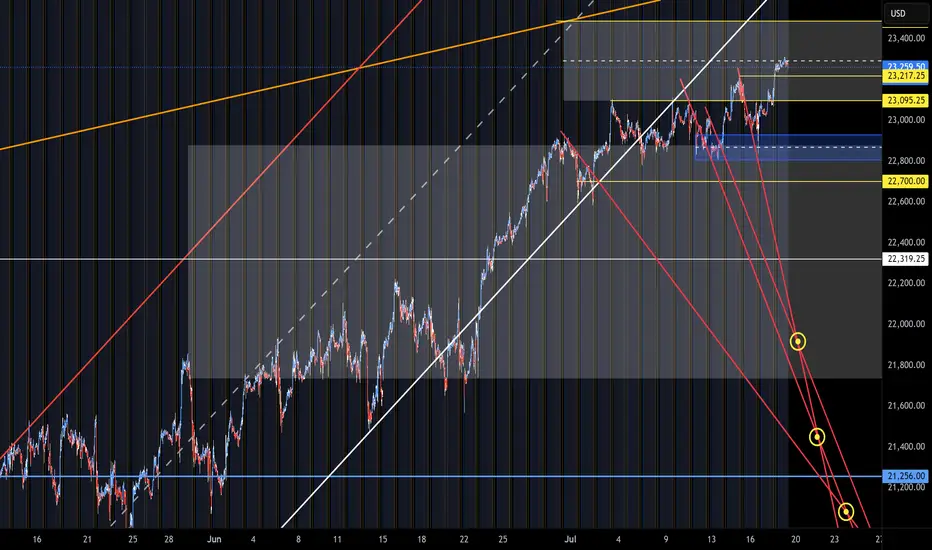
NQ Targets (07-18-25)I have not posted a Target call in awhile, this one is Long to upper TZ (23,486) and Short to YTD Open level. Prior use of Diablo's to Target drop was prior to NAZ 25% drop (11/24 Post's).
We are due for some drop retesting as we watch typical Long Side Tweets, Tricks and Games start to fizzle some. Today into Monday will be a key signal.
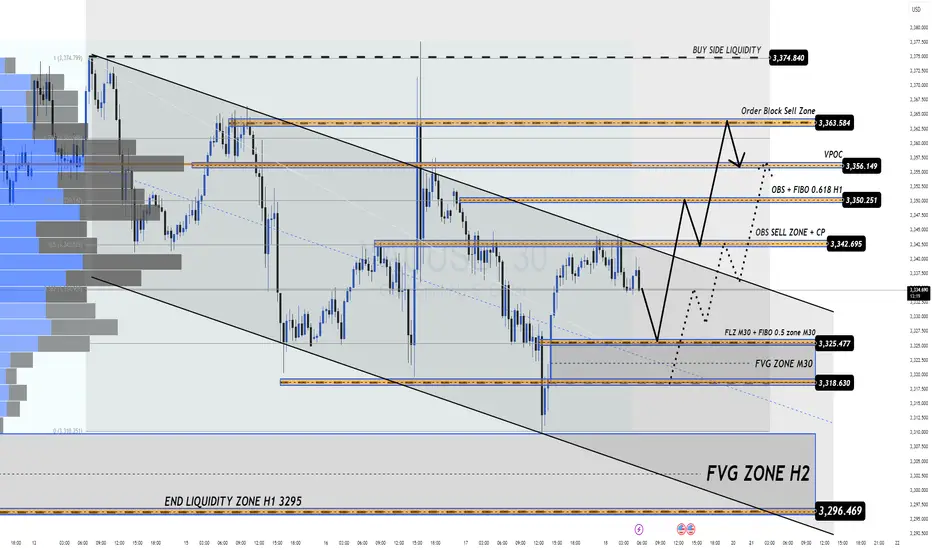
18/07 Gold Outlook Market Tensions Mount Liquidity Zones in Play Gold Outlook – Market Tensions Mount, Liquidity Zones in Play
Price action heats up as we enter the final trading day of the week. Are you ready to ride the wave or get caught in the liquidity sweep?
🔍 Market Sentiment & Global Highlights
Gold rebounded strongly after dropping on better-than-expected US data. However, several macro risks are keeping gold buyers in the game:
Buy-the-dip activity emerged amid concerns that Trump’s tariff policies may fuel inflation.
Rate cut expectations remain strong as US core inflation shows no signs of cooling.
Geopolitical risks intensified as Israel conducted fresh airstrikes on Syria.
EU threatens $84B in tariffs on US goods should trade talks break down.
💡 These tensions are giving gold strong support — especially as traders prepare for potential volatility into the weekend.
📈 Technical Overview – Liquidity Zones at Play
Yesterday's bounce from FLZ H2 (3310) — a critical demand and liquidity zone — triggered a clean reversal. Sellers took profit, volume shifted, and buyers regained control. Price has since pushed up to retest the OBS SELL ZONE + CP Pattern near the 334x area with a sharp reaction.
For today, price is likely to revisit lower liquidity pockets (M30–H2) before making the next directional move.
🔑 Key Levels to Watch
🟢 BUY ZONE: 3318 – 3316
Stop Loss: 3312
Take Profits: 3322 – 3326 – 3330 – 3335 – 3340 – 3345 – 3350 – 3360+
⚡ BUY SCALP ZONE: 3326 – 3324
Stop Loss: 3320
Take Profits: 3330 – 3335 – 3340 – 3345 – 3350 – 3360
🔴 SELL ZONE: 3363 – 3365
Stop Loss: 3370
Take Profits: 3360 – 3355 – 3350 – 3346 – 3342 – 3338 – 3335 – 3330
⚠️ Final Notes
Today’s session has no major news releases, but as it’s the end of the week, we may see liquidity grabs and unexpected volatility. Stay disciplined, stick to your plan, and always respect TP/SL.
🔔 Follow the key zones carefully – volatility loves indecision.
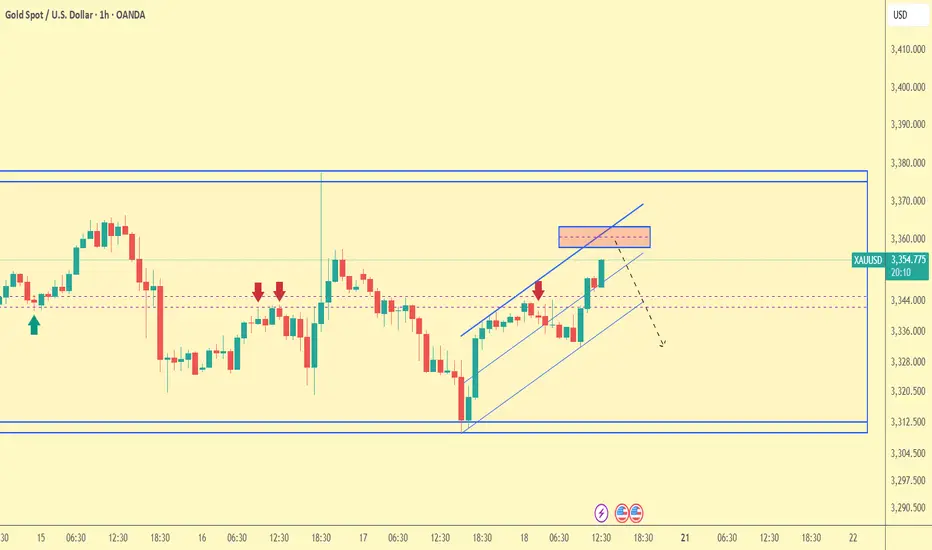
XAUUSD NEW OUTLOOKXauusd buy from 3352
tp1 3360
tp2 3370
tp3 3380
Stope lose 3342
TRADE AT YOUR OWN RISK

GOLD Price Continue to GrowXAUUSD has formed a bullish pattern after successfully testing and holding the strong support zone at 3310, which marked a key demand level. The recent bounce from this level confirms strong buyer interest despite temporary USD strength.
Demand for gold has sharply increased, often seen as a hedge during uncertain economic periods—even with a temporarily stronger dollar. The current price action reflects a bullish continuation pattern, suggesting potential for further upside. targeting will be 3360 3378 / 3400
You may find more details in the chart Ps Support with like and comments for better analysis.
I am Part of Trade Nations Influencer program and receive a monthly fee for using their Trading view charts charts in my analysis.

Gold Trade Plan 18/07/2025Dear Traders,
Gold (XAUUSD) – Short-Term Outlook – July 18, 2025
Price is currently moving within an ascending channel and approaching a key resistance zone around 3355–3360, highlighted in red. This zone has acted as previous supply (marked with red arrows), and we anticipate potential bearish reaction from here.
As long as price fails to break and hold above 3375, we remain bearish near the top of the range, with short opportunities targeting the mid-range (~3340) and possibly the bottom of the channel (~3315–3320).
If price breaks above 3375 with strong momentum and closes above it, the bullish breakout scenario becomes active, invalidating the short setup.
📌 Strategy:
Watch for bearish confirmation in the resistance zone
Sell near the top, targeting lower range levels
Invalidation: Break and close above 3375
Regards,
Alireza!
Today's GOLD Analysis (MMC) – Bullish Momentum Building Ahead🔍 Market Overview:
Gold is currently showing signs of a bullish reversal structure after experiencing a downward correction. Price action has reacted strongly from well-defined demand zones, suggesting institutional buying activity at key levels. The current setup highlights a clear accumulation phase transitioning into a potential markup phase, driven by buyers regaining control.
🧱 Chart Structure Breakdown:
1️⃣ Initial Channel Formation (Left Side of Chart)
After a major downtrend, price began consolidating within a rising channel, indicating a retracement or correction phase.
This ascending channel showed a short-term bullish effort, but eventually broke to the downside, resuming the dominant bearish flow temporarily.
2️⃣ Previous Reversal Zone ($3,312 – $3,322)
This is the origin of the recent bullish move, where price strongly reversed after heavy selling.
The reversal formed a long bullish wick and an engulfing candle—clear signs of buying absorption.
This level has historical confluence, acting as both support and prior demand.
3️⃣ Mini SR - Interchange Zone ($3,327 – $3,335)
This zone is a mini structure level where previous resistance has now become support (SR Flip).
The area acted as a platform for the recent bullish reaction.
This zone also aligns with the interchange of order blocks, adding more confluence to the bullish argument.
4️⃣ Bullish Pattern Formation
Price formed a micro double bottom/inverse head and shoulders structure just above the Mini SR.
The pattern suggests strong base-building and provides momentum for the current bullish move.
Confirmation came after the neckline breakout and retest within the Central Zone.
5️⃣ Central Zone ($3,340 – $3,345)
This is an intraday pivot area, acting as a decision-making zone between buyers and sellers.
Price is currently testing this zone with strong bullish candles.
A clean break above this level increases the probability of further upside.
6️⃣ Reversal Zone 1 ($3,345 – $3,353) – ✅ Condition 1
Price is now entering this zone, where previous price rejections occurred.
If buyers can maintain momentum and break above this zone on strong volume, it will validate the bullish continuation thesis.
This zone is also an ideal area to monitor for partial profit-taking or potential short-term rejection.
7️⃣ Reversal Zone 2 ($3,365 – $3,375) – ✅ Condition 2
This is the next significant resistance block.
If price reaches this level, it could face heavy resistance and profit-booking from swing traders.
However, a breakout above this zone could lead to a much larger bullish wave, targeting $3,390+.
🎯 Trade Setup Idea:
Long Bias: Above $3,335 with targets at $3,353 (TP1) and $3,370 (TP2)
Risk Invalidation: Break below Mini SR zone ($3,327) may invalidate bullish thesis
Aggressive Entry: At retest of Mini SR after pattern breakout
Conservative Entry: On breakout and close above Reversal Zone 1 with confirmation
🧠 Trader’s Mindset:
The market is showing a clear shift in momentum, but buyers must sustain control above key levels.
Stay patient at resistance zones; avoid chasing.
Watch for rejection wicks or bearish divergence near Reversal Zone 2 if you're looking for a counter-trade.
📌 Summary:
📈 Bias: Bullish (as long as $3,335 holds)
💡 Opportunity: Breakout from Mini SR with structure support
📉 Risk: Failure to hold central zone could trigger retest of lower support
🚀 Potential: If momentum continues, gold could revisit July highs near $3,390–$3,400

Gold elliot wave countMarket Structure – Corrective Wave 2 Still in Progress
We're currently in a Wave 2 correction, unfolding as a classic ABC structure – labeled with Circle A → Circle B → Circle C.
✅ Circle A and Circle B are already complete.
We're now in the move from Circle B → Circle C, which itself is unfolding as a:
→ (A) → (B) → (C) (in parentheses)
Currently, we are in the move from (B) to (C), which again is breaking down as a smaller A → B → C move.
🔍 Key Levels to Watch:
📈 We might now be completing Wave A of (C) around the 3362 level.
🔁 A pullback to around 3322 could follow as Wave B,
➡️ leading to a final Wave C (of (C), of Circle C, completing Wave 2) targeting around 3405.
⏳ What’s Next?
Once we hit the 3405 zone, that would potentially complete the entire Wave 2 correction.
From there, I expect a trend reversal to the downside, beginning the next impulsive wave down.

Pay attention to the 3350 high point suppression!At present, we are paying attention to the short-term pressure near 3340-3350. If this position is not broken today, the daily line will continue to maintain a downward oscillation state, and continue to pay attention to the short-term competition near 3340-3350. Considering that the US dollar index is at a relatively high level in the short term, there is a certain demand for pressure repair, which may also bring a certain range of fluctuations to gold. Therefore, the gold operation maintains a range of fluctuations of 3300-3350. In the short term, we also need to pay attention to the emotional impact brought by fundamentals. From the current gold trend analysis structure, the short-term support below continues to focus on the vicinity of 3310-3300, the short-term suppression above focuses on the vicinity of 3340-3350, and the key pressure above focuses on the vicinity of 3380. The overall trend is running around the 3300-3350 range. The operation is mainly to participate in the volatile market with the idea of selling high and buying low, and remain flexible in response. It is recommended to wait and see more and do less in the middle position, chase orders cautiously, and wait patiently for key points to enter the market.
Gold operation strategy: Go long when gold falls back to around 3315-3305, with a target of 3335-3340.

CHECK XAUUSD SIGNAL READ CAPTAINTrade Direction: Short (sell)
Entry Point: Around 3345.000 3342.000
Stop Loss: Around 3355.000
🎯 Target Levels
Take Profit 1:
3332.000
Take Profit 2:
3318.000
Last Target:
3300.000


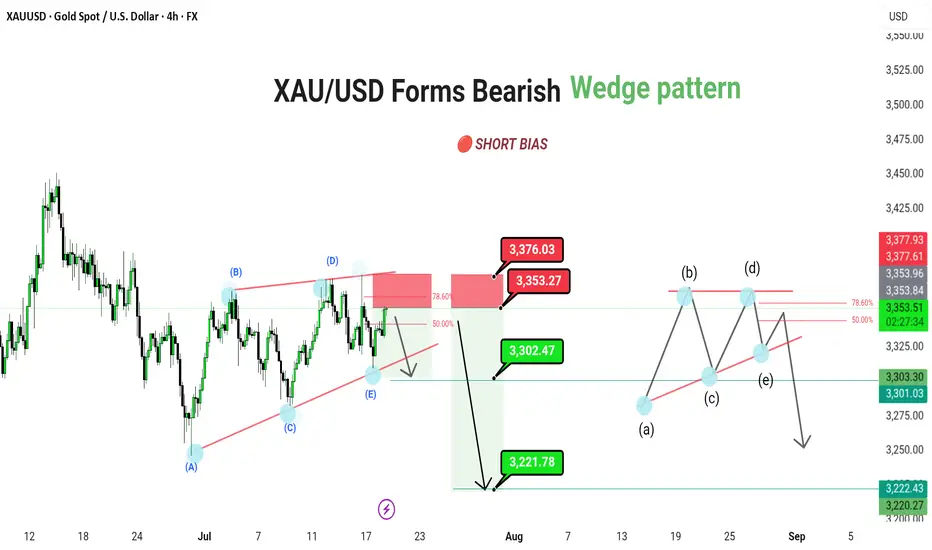
XAU/USD Forms Bearish Continuation Triangle – Future Downside
XAU/USD (4H) | FX | Gold Spot vs US Dollar
🔴 SHORT BIAS
📅 Updated: July 18
---
🔍 Description
Gold is trading within a bearish contracting triangle, suggesting a continuation move to the downside after the recent corrective bounce. Price is currently approaching the key 3,371–3,376 resistance zone, which aligns with the 78.6% Fibonacci retracement and upper triangle boundary.
This resistance confluence could mark the termination of the (E) wave of the triangle, paving the way for a larger downward thrust. A confirmed break below 3,302 would open the door toward 3,221 as the next major target.
The structure also leaves room for a minor internal triangle (a)-(b)-(c)-(d)-(e) pattern within the broader range, reinforcing the bearish setup.
---
📊 Technical Structure (4H)
✅ Bearish contracting triangle: (A)-(B)-(C)-(D)-(E)
✅ 78.6% Fibonacci + supply zone = ideal rejection point
✅ Internal triangle projection aligns with lower support test
📌 Downside Targets
Target 1: 3,302.47
Target 2: 3,221.78
🔻 Invalidation: Above 3,376.03
---
📈 Market Outlook
Macro View: Rising real yields and cooling inflation reduce gold’s appeal
Fed Watch: Hawkish tone supports USD, weighing on XAU
Technical View: Structure favors downside break from triangle formation
---
⚠️ Risks to Bias
Break and daily close above 3,376.03 invalidates triangle structure
Sudden risk-off sentiment or dovish Fed shift could boost gold demand
Sharp reversal in dollar strength
---
🧭 Summary: Bearish Breakout Setup Forming
XAU/USD is completing a bearish triangle structure, with price sitting just below resistance. A rejection from the 3,371–3,376 zone can trigger a breakout lower, first toward 3,302, then extending to 3,221. As always, confirmation and tight risk control are key.
---
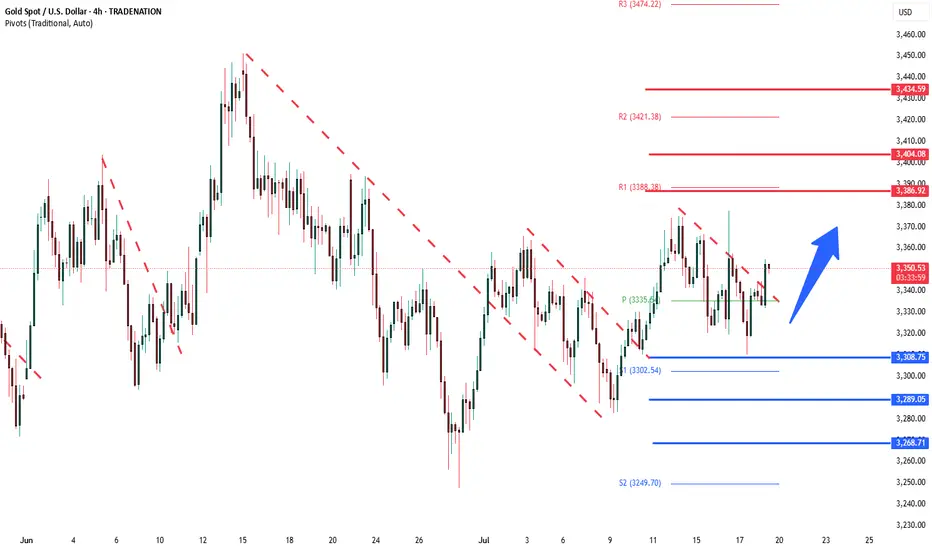
Gold bullish breakout supported at 3308The Gold remains in a bullish trend, with recent price action showing signs of a continuation breakout within the broader uptrend.
Support Zone: 3308 – a key level from previous consolidation. Price is currently testing or approaching this level.
A bullish rebound from 3308 would confirm ongoing upside momentum, with potential targets at:
3387 – initial resistance
3400 – psychological and structural level
3435 – extended resistance on the longer-term chart
Bearish Scenario:
A confirmed break and daily close below 3308 would weaken the bullish outlook and suggest deeper downside risk toward:
3290 – minor support
3268 – stronger support and potential demand zone
Outlook:
Bullish bias remains intact while the Gold holds above 3308. A sustained break below this level could shift momentum to the downside in the short term.
This communication is for informational purposes only and should not be viewed as any form of recommendation as to a particular course of action or as investment advice. It is not intended as an offer or solicitation for the purchase or sale of any financial instrument or as an official confirmation of any transaction. Opinions, estimates and assumptions expressed herein are made as of the date of this communication and are subject to change without notice. This communication has been prepared based upon information, including market prices, data and other information, believed to be reliable; however, Trade Nation does not warrant its completeness or accuracy. All market prices and market data contained in or attached to this communication are indicative and subject to change without notice.