Analysis for next week on GOLDThankyou guys for watching. From now on, I will just be posting ideas only and no longer post in minds, because I think it is a waste of time trying to help people who don't want to be helped. If you have any questions please leave it in the comments instead, thankyou.
My sell entry : 3368.54
SL : 3373.54
TP : 3308
Futures market

Elliott Wave Analysis – XAUUSD | July 15, 2025🟢 Trade Update
The BUY order at the 3342 – 3340 zone was triggered at 3341. As of now, price has moved up by 140 pips, and the market is still following the planned scenario from the previous analysis.
📊 Momentum Analysis
D1 Timeframe: Momentum is in the overbought zone, and indicator lines are showing signs of crossing — a warning signal of a potential reversal on the daily chart.
H4 Timeframe: After a 6-candle decline from 3377 to 3342, H4 momentum has reversed upward. With 2 bullish candles already formed, we expect another 3–5 bullish candles, aiming toward the 3390 zone.
🌀 Elliott Wave Update
Price action is currently moving toward the end of the abcde contracting triangle. We are monitoring two potential scenarios:
Scenario 1 – Ongoing Triangle Correction
If price returns to the lower boundary of the triangle, it is likely forming wave e, which would present a buy opportunity for the final leg of the triangle.
Scenario 2 – 5-Wave Impulse Extension
The current structure shows a 5-wave impulsive move, with wave 4 completed and wave 5 now beginning.
The projected target for wave 5 aligns with the resistance zone at 3398 – 3402.
After completing wave 5, the market could enter a corrective phase, consistent with the idea that wave d ends at this resistance.
🔔 If the price breaks above 3402, it would likely confirm that the abcde correction is complete and that a new impulsive bullish wave has started.
🎯 Trade Plan
📍SELL Zone: 3396 – 3398
⛔️ Stop Loss: 3406
🎯 TP1: 3376
🎯 TP2: 3327
📍BUY Zone: 3295 – 3293
⛔️ Stop Loss: 3285
🎯 TP1: 3327
🎯 TP2: 3365
🎯 TP3: 3402
✅ Note: Prioritize entries only after confirmation from price action and momentum at key levels.

uptrend, heading towards 3400⭐️GOLDEN INFORMATION:
Gold prices (XAU/USD) climb toward $3,350 in early Asian trading on Tuesday, supported by renewed safe-haven demand after US President Donald Trump threatened sweeping 100% tariffs on Russia. Traders now shift focus to the upcoming US Consumer Price Index (CPI) report, which could offer further cues for the Federal Reserve’s policy outlook.
Late Monday, Trump warned that unless Russian President Vladimir Putin agrees to a peace deal to end the Ukraine conflict within 50 days, the US will impose 100% tariffs on Russian goods. The proposed sanctions, described as secondary tariffs, lack detailed clarification but have already fueled market anxiety. Heightened geopolitical tensions are likely to sustain near-term demand for gold as investors seek safety in the yellow metal
⭐️Personal comments NOVA:
Maintaining buying pressure above 3350, gold price in an uptrend, paying attention to CPI results to assess the inflation level of the world's number 1 economy
⭐️SET UP GOLD PRICE:
🔥SELL GOLD zone: 3400- 3402 SL 3407
TP1: $3390
TP2: $3380
TP3: $3370
🔥BUY GOLD zone: $3330-$3328 SL $3323
TP1: $3340
TP2: $3350
TP3: $3360
⭐️Technical analysis:
Based on technical indicators EMA 34, EMA89 and support resistance areas to set up a reasonable BUY order.
⭐️NOTE:
Note: Nova wishes traders to manage their capital well
- take the number of lots that match your capital
- Takeprofit equal to 4-6% of capital account
- Stoplose equal to 2-3% of capital account

XAUUSD Trade Plan | 15 July 2025After observing the recent low breakdown and a clear liquidity grab, we saw a strong direction confirmation breakout. This suggests that the market is likely to continue its upward momentum.
🔄 Breakdown/Seller Trap triggered the reversal
🔹 Last Important Low respected
📈 Breakout confirms bullish direction
✅ Plan:
I’ll be watching for a pullback into the grey demand zone (highlighted area) for a potential long entry.
🕵️♂️ No FOMO — I’ll only enter after price shows clear bullish behavior in this zone.
🎯 Target: 3,365.89 resistance
📍 Entry Zone: Grey box (based on previous structure)
Let me know your thoughts — are you also watching this zone?
#XAUUSD #GoldAnalysis #LiquidityGrab #SmartMoneyConcepts #PriceAction #TradingPlan #TradingView

Xauusd My option about gold Is more bearish so that zone is good and strong restanice if the price comes to that zone it can pullback

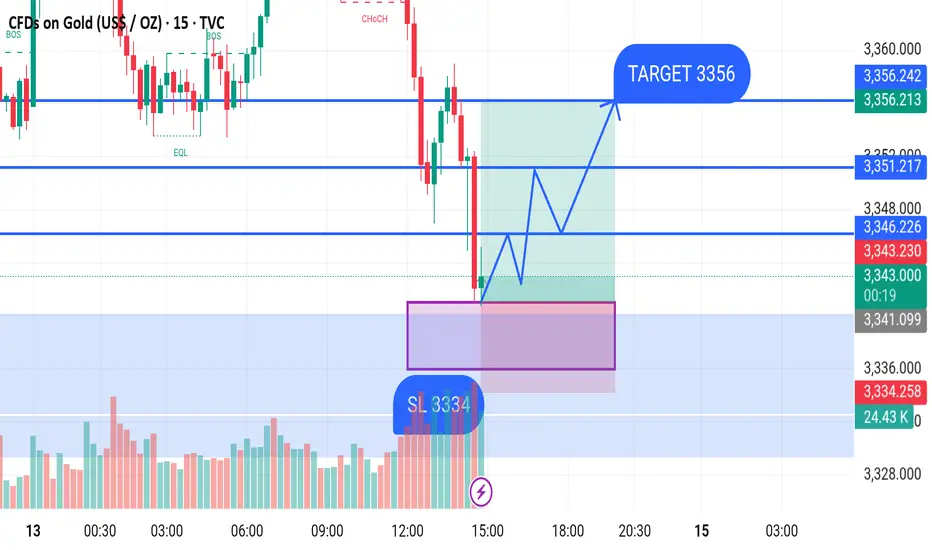
GOLD BUY M15 Gold (XAU/USD) 15-Min Chart Analysis – July 14, 2025
Price is currently reacting from a marked demand zone around 3334, which is acting as a strong support area. A bullish move is expected from this zone, with a potential upside target at 3356.
Key Levels:
Entry Zone (Demand Area): 3334 – 3340
Stop Loss (SL): Below 3334
Target (TP): 3356
Market Structure:
Price has formed Equal Lows (EQL), indicating liquidity grab.
After a sharp decline, price touched the demand zone and is showing bullish signs.
The projected path suggests a series of higher highs and higher lows towards the target.
This setup presents a buying opportunity, with a favorable risk-to-reward ratio aiming for the 3356 resistance zone.
XAUUSD is currently trading at 3347, presenting a potential buyif price fails to hold above 3340, it may indicate a breakdown, invalidating the long setup.
Overall, XAUUSD remains a buy above 3347 with targets at 3360, 3375, and potentially 3400, using 3340 as a strict stop-loss.
XAUUSD is currently trading at 3347, presenting a potential buying opportunity within a short-term bullish bias.
Immediate resistance is noted at 3360, which marks the first test for upward momentum.
A break above 3360 could push prices toward the next resistance at 3375.
Further confirmation of bullish continuation would be seen on a clean break and close above 3400.
Support is firmly placed at 3340, serving as a key stop-loss level to manage downside risk.
The ideal buy zone lies between 3345–3347, close to support but before resistance tightens.
This zone provides a favorable risk-to-reward ratio if price rebounds from this range.
Traders should monitor momentum indicators and price action around 3360 for early signals of a breakout.

XAUUSD Institutional Market Recap & Forward Guidance📊 XAUUSD Institutional Market Recap & Forward Guidance | July 14–15, 2025
🕒 Execution Focus: Cairo Time
🗓 14 July Recap – Liquidity Engineering Phase
Gold executed a precision liquidity trap below VAL 3341 during Asia–London overlap.
Price swept weak long positions, engineered a false breakdown, and rebalanced above VWAP Median / POC (3349).
The buy-side imbalance was confirmed via delta footprint and rising volume into NY close — textbook reaccumulation behavior by market makers.
Key institutional level respected:
VWAP Low: 3341 (support)
POC/VWAP Median: 3349 (magnet zone)
No breakout above VAH (3357–3361) — signals deliberate order absorption.
📈 15 July Outlook – Breakout Imminent
📍 Current Range: 3341–3361
🔺 Directional Bias: Bullish continuation toward 3361–3365 (liquidity pool)
🔻 Risk Zone: Failure to hold above 3349 → sweep back to 3341 / 3337
Institutional Levels in Play (Timeframe-Specific):
Daily VAH: 3361.96
H4 VWAP High: 3357.32
M15 POC: 3349.13
VWAP Bands (1H): 3341.20 – 3357.87
🧠 Execution Playbooks:
Breakout Play: Buy Stop > 3352.50
TP1: 3357
TP2: 3361
SL: 3344
Reversal Play: Sell Limit @ 3361.50
TP: 3349
SL: 3367
🔍 Confirm entries using:
Volume Footprint Delta
VWAP Reaction
RSI/MACD confluence
🛡 Reminder: Do not chase. Let price confirm. Trade only from institutional zones with footprint evidence.
📍Structured precision. MM logic. Risk control. This is not retail.

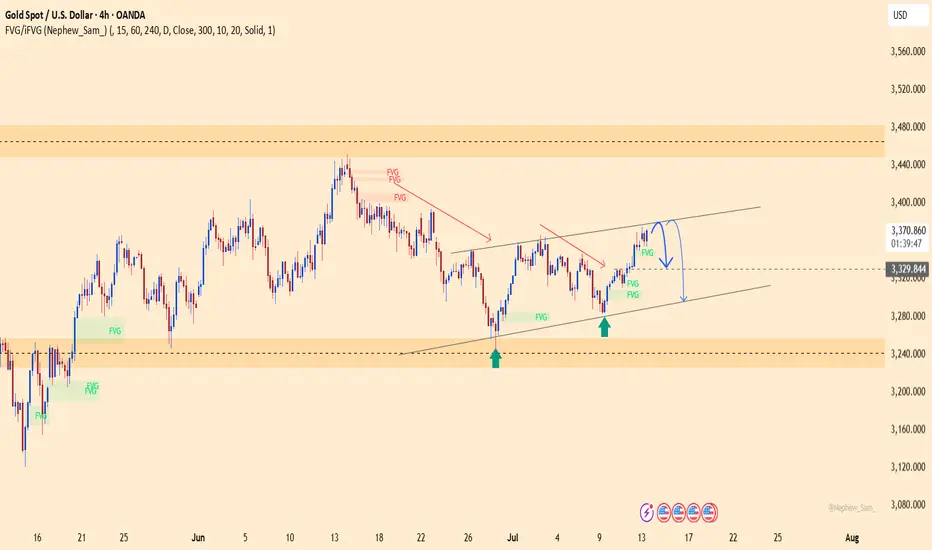
Gold (XAU/USD) 4H: Bullish Continuation Play- 15 July 20244‑Hour Technical Outlook — Bullish Bias Above Key BOS Zone
Gold remains in a strong structural uptrend on the 4‑hour chart, carving out a sequence of higher highs and higher lows. Price is consolidating just below recent swing highs around $3,360, suggesting accumulation after last week’s impulsive rally.
We saw a Break of Structure (BOS) above $3,340, confirming bullish control and establishing that area as a critical flip zone. Unless price closes decisively below that BOS, the directional bias remains bullish.
📐 Key Confluences & Zones on 4‑Hour
🔹 Fibonacci Retracement (Swing: $3,280 → $3,360):
38.2%: ~$3,331 — aligns perfectly with BOS & prior resistance turned support.
61.8%: ~$3,313 — deeper, but still within bullish context.
🔹 Supply & Demand Zones:
Supply (Resistance): $3,355–$3,360 — recent highs, likely containing resting sell‑side liquidity.
Demand (Support): $3,331–$3,335 — a bullish order block and fair value gap (imbalance) reside here.
Deeper Demand: $3,313–$3,315 — secondary buy zone if the market hunts liquidity deeper.
🔹 Liquidity Profile:
Buy‑side stops likely rest above $3,360 — breakout target.
Sell‑side liquidity below $3,331 could trigger a shakeout before higher.
🧠 ICT/SMC Concepts Observed:
✅ BOS confirmed at $3,340, favoring longs.
✅ FVG/imbalance between $3,338–$3,342 suggests price may “fill” before next impulse.
✅ Recent wick above $3,355 hints at minor buy‑side liquidity grab — but no confirmed CHoCH (change of character) yet.
✅ Bullish order block formed at $3,331–$3,333, acting as strong support.
📈 1‑Hour Intraday Playbook — Aligned With Bullish Bias
On the 1‑hour chart, momentum remains constructive above $3,331. Intraday traders can look for these setups:
1️⃣ Buy the Retest
Entry: $3,335 (within 4H OB & FVG)
Stop‑loss: $3,327 (below demand)
Targets:
🔸 T1: $3,355
🔸 T2: $3,380 (next resistance)
2️⃣ Breakout Long
Entry: Break and close above $3,360
Stop‑loss: $3,350
Targets:
🔸 T1: $3,380
🔸 T2: $3,406 (1.272 Fib ext.)
3️⃣ Deeper Pullback Buy
Entry: $3,313–$3,315 (61.8% Fib + deeper demand)
Stop‑loss: $3,305
Targets: back toward $3,355–$3,380
🎯 The Golden Setup:
✅ Long from $3,335, stop‑loss $3,327, targeting $3,355–$3,380.
Why? This setup aligns BOS, bullish OB, FVG, 38.2% Fib, and current trend structure — highest confluence and best risk/reward ratio (~1:3).
🔎 Summary Table — Key Levels for Today
📈 Bullish Continuation Above $3,331
🟢 Strong Buy Zone $3,331–$3,335
🟢 Deeper Demand $3,313–$3,315
🔴 Resistance / Supply $3,355–$3,360
🚨 Bullish Invalidation Below $3,331
Bias remains bullish as long as $3,331 holds. Look for reaction in the $3,331–$3,335 zone to join institutional flows.

XAG/USD Eyes Upside Targets as Wave C MaturesXAG/USD is currently trading in a corrective phase where wave B appears to have completed, and wave C is currently forming. Based on the current price action, it doesn’t seem likely that this entire move will result in a full bullish recovery. The structure suggests that this could be sub-wave C of wave 4, potentially completing around the 26.79944 level. Going forward, if the 5th wave begins to unfold, potential targets could be in the range of 29.74182 to 30.57528.

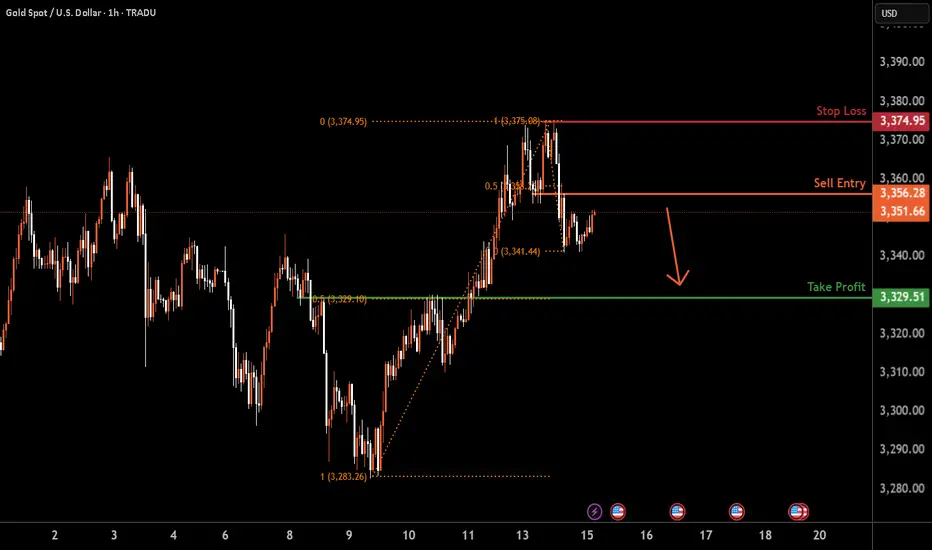
XAUUSD H1 I Bearish Reversal Off Based on the H1 chart analysis, we can see that the price is rising toward our sell entry at 3356.28, which is a pullback resistance that aligns closely with the 50% FIb retracement.
Our take profit will be at 3329.51, a pullback support level that aligns with the 50% Fib retracement.
The stop loss will be placed at 3374.95, a swing-high resistance level.
High Risk Investment Warning
Trading Forex/CFDs on margin carries a high level of risk and may not be suitable for all investors. Leverage can work against you.
Stratos Markets Limited (tradu.com ):
CFDs are complex instruments and come with a high risk of losing money rapidly due to leverage. 63% of retail investor accounts lose money when trading CFDs with this provider. You should consider whether you understand how CFDs work and whether you can afford to take the high risk of losing your money.
Stratos Europe Ltd (tradu.com ):
CFDs are complex instruments and come with a high risk of losing money rapidly due to leverage. 63% of retail investor accounts lose money when trading CFDs with this provider. You should consider whether you understand how CFDs work and whether you can afford to take the high risk of losing your money.
Stratos Global LLC (tradu.com ):
Losses can exceed deposits.
Please be advised that the information presented on TradingView is provided to Tradu (‘Company’, ‘we’) by a third-party provider (‘TFA Global Pte Ltd’). Please be reminded that you are solely responsible for the trading decisions on your account. There is a very high degree of risk involved in trading. Any information and/or content is intended entirely for research, educational and informational purposes only and does not constitute investment or consultation advice or investment strategy. The information is not tailored to the investment needs of any specific person and therefore does not involve a consideration of any of the investment objectives, financial situation or needs of any viewer that may receive it. Kindly also note that past performance is not a reliable indicator of future results. Actual results may differ materially from those anticipated in forward-looking or past performance statements. We assume no liability as to the accuracy or completeness of any of the information and/or content provided herein and the Company cannot be held responsible for any omission, mistake nor for any loss or damage including without limitation to any loss of profit which may arise from reliance on any information supplied by TFA Global Pte Ltd.
The speaker(s) is neither an employee, agent nor representative of Tradu and is therefore acting independently. The opinions given are their own, constitute general market commentary, and do not constitute the opinion or advice of Tradu or any form of personal or investment advice. Tradu neither endorses nor guarantees offerings of third-party speakers, nor is Tradu responsible for the content, veracity or opinions of third-party speakers, presenters or participants.
XAUUSD – Topping Out, Correction Pressure MountsGold prices are stalling after approaching the key resistance at $3,381, precisely at the upper boundary of the short-term ascending channel. The bullish momentum is fading as the USD and U.S. bond yields remain firm, supported by stable jobs data and a lack of clear rate guidance from the Fed.
Additionally, the World Gold Council (WGC) has warned of medium-term correction risks if geopolitical tensions ease or the dollar continues to strengthen — prompting buyers to stay cautious. In the near term, XAUUSD may pull back toward the $3,295 support zone before the market defines its next direction.
GOLD Local Rebound Ahead! Buy!
Hello,Traders!
GOLD made a retest of
The horizontal support
Level of 3343$ and as
We are locally bullish
Biases we will be expecting
A local bullish rebound
Buy!
Comment and subscribe to help us grow!
Check out other forecasts below too!
Disclosure: I am part of Trade Nation's Influencer program and receive a monthly fee for using their TradingView charts in my analysis.

End-of-Session Market ReviewToday was a solid trading day with some interesting moves across the markets:
S&P 500: The market trended upwards from the open, gradually moving into and above the prior day’s value area, closing near the high of that range.
NASDAQ 100: After some initial back-and-forth, it climbed above the prior day’s high and value area, showing strength into the close.
Russell 2000: This market was quite choppy and balanced for a good part of the session, but eventually pushed up to close near the prior value area high.
Gold: It stayed range-bound, moving between the CVA high and the prior day’s value area without breaking out.
Crude Oil: We saw a significant drop right from the start, with prices falling about 1.5 points and ending the day lower, though still within the prior day’s range.
Euro Dollar: It tested the CVA low, dipped below the prior day’s low, and then bounced back to close around that level.
Yen Dollar: It started near the prior value area low, accepted below it by midday, and remained balanced in that lower range.
Aussie Dollar: Initially, it held above the CVA area and tested a higher level before sharply dropping below the prior day’s low and then balancing in that lower area.
In total, I took eight trades today. Two of them were in the Yen, both valid setups that didn’t work out and ended in stop-outs. I also took some long trades in the Aussie Dollar that I probably could have avoided since the market was choppy.
On the positive side, I managed risk well and ended up with two winning trades that put me in the green by about $1,200. Overall, I’d rate today as an A- day. Moving forward, I’ll focus on staying out of choppy markets, paying attention to the developing value area, and possibly using Heikin Ashi bars for better clarity.

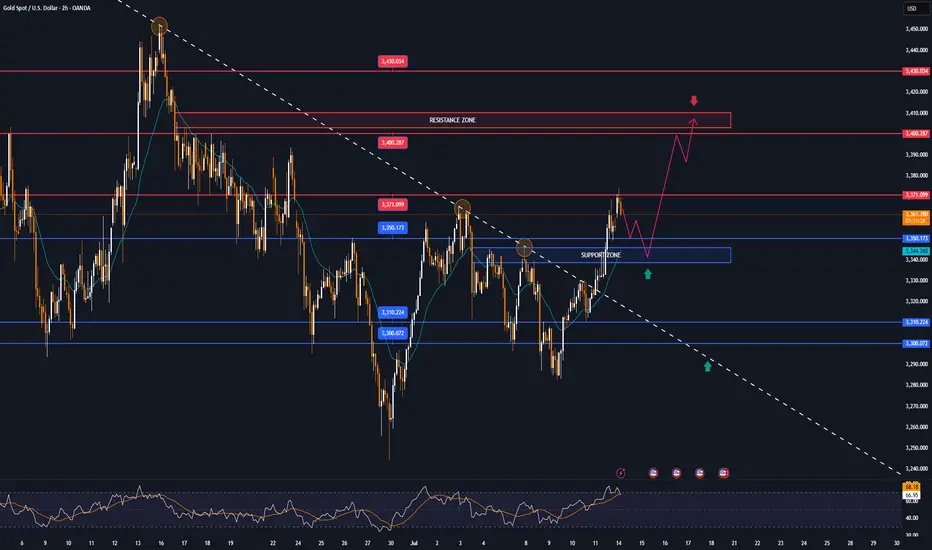
Back above $3,300, GOLD may remain neutral, tax focusOANDA:XAUUSD reclaimed the psychologically important level of $3,300/ounce last week, but while gold is still receiving some support as a safe haven amid economic and geopolitical risks, its upside momentum may be limited as the market shifts its attention to other commodities.
Gold prices ended last week on a generally bullish note, rising back above $3,300 an ounce after US President Trump unexpectedly announced a series of new trade policies. Spot gold prices rose about 0.5% last week on Friday.
Although the market initially doubted Trump’s self-imposed July 9 deadline, the overall market reaction remained steady and the renewed risk appetite helped the S&P 500 hit a new record high, somewhat undermining gold’s safe-haven appeal. The July deadline has been pushed back to August 1, but the global trade conflict is far from over. Gold has regained support after initial pressure after Trump announced a new trade policy on copper imports, along with a series of news stories about the relationship between Trump and the FED sent to readers throughout the past week.
A sharp rise in copper prices will also add to inflationary pressures, exacerbate economic uncertainty and raise concerns about recession and stagflation. In this context, gold is expected to continue to receive support from potential risks.
In addition to fierce competition in the commodity market, gold may remain fundamentally neutral in the short term, as economic data will support the Fed's neutral monetary policy. The key market focus next week will be the June Consumer Price Index (CPI). The Fed has made it clear that it is in no rush to raise interest rates while inflation risks remain high.
However, traders still need to be cautious and closely monitor the situation surrounding the tariff war initiated by Trump, which will directly affect the price of gold. In case of negative news, the gold price will receive support and vice versa if positive news appears in the market.
Over the weekend, US President Trump once again used the tariff tactic, announcing that he would impose a 30% tax on imports from the EU and Mexico, causing a strong reaction from the international community. This move not only casts a shadow over the relationship between Europe and the United States, as well as between the United States and Mexico, but also adds further uncertainty to the global trade model. EU politicians, businesses and academics were quick to respond, calling for unity to protect their interests, while Mexico stressed the need to maintain national sovereignty and pledged to respond calmly.
Technical Outlook Analysis OANDA:XAUUSD
On the daily chart, gold has a 3-day rally, and the upside momentum has reached the important target resistance at the 0.236% Fibonacci retracement level. Gold's upside momentum is also limited by this Fibonacci retracement level, specifically it has slightly dropped to $3,355/oz.
But overall, gold is still not in a position to form a specific trend, and the indicators and positions are mainly showing the possibility of continuing to accumulate sideways.
For gold to have the conditions for a new bullish cycle, it needs to bring price activity above the 0.236% Fibonacci retracement level, then the target will be around $3,400 in the short term, more than $3,430.
Meanwhile, a pullback, which sees gold sell below the 0.382% Fibonacci retracement, would open the door to a bearish cycle, with a target of around $3,246 in the short term, rather than the 0.50% Fibonacci retracement.
RSI hovering around 50 also suggests a hesitant market sentiment, so the short-term bias for gold is neutral.
Along with that, notable positions will also be listed as follows.
Support: $3,350 – $3,310 – $3,300
Resistance: $3,371 – $3,400 – $3,430
SELL XAUUSD PRICE 3406 - 3404⚡️
↠↠ Stop Loss 3410
→Take Profit 1 3398
↨
→Take Profit 2 3392
BUY XAUUSD PRICE 3340 - 3342⚡️
↠↠ Stop Loss 3336
→Take Profit 1 3348
↨
→Take Profit 2 3354
bullish on GOLDTrading Idea Setup:
XAUUSD has given me enough confirmation indicators to forecast a bullish run from this price point. ↗️🟢
✅Favorable TP level(s):
⦁ 3414.022
⦁ 3445.179
🛑Stop Loss:
⦁ 3277.205
Indications used:
Trend confirmation indicator
Elliot wave assistance
Momentum indicators
______________________________
Trading Involves Risk: Decisions to buy, sell, hold, or trade in securities, commodities, and other investments carry inherent risk, including the possibility of substantial losses. Please ensure every trade placed is supported by your own thorough analysis and/or fundamental research.
Ps: All the trades that I place, I do hold indefinitely unless noted otherwise but TP points will always be provided. Happy Trading 🖤

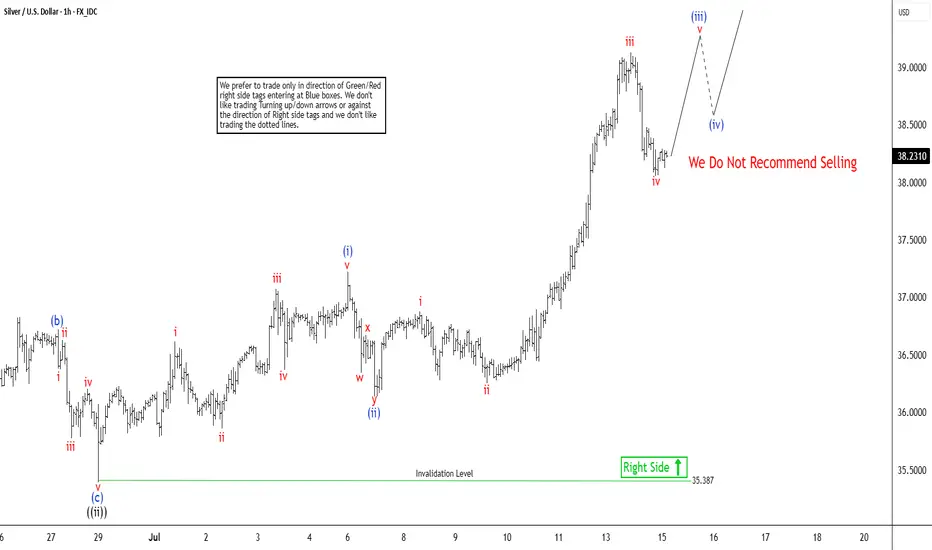
Elliott Wave Analysis: XAGUSD (Silver) Poised to Extend Higher iThe cycle from the June 24, 2025 low in Silver (XAGUSD) is unfolding as a five-wave rally with an extended nested impulse structure. From the June 24 low, wave ((i)) peaked at $36.83. Wave ((ii)) pullback then followed o $35.39, as shown on the 1-hour chart. The metal then extended higher in wave ((iii)), subdivided as an impulse. From wave ((ii)), wave i ended at $36.61, with a wave ii pullback to $35.86. Wave iii reached $37.07 and wave iv corrected to $36.37. The final wave v concluded at $37.22, completing wave (i) in a higher degree.
The subsequent wave (ii) pullback ended at $36.14, structured as a double-three pattern. From wave (i), wave w declined to $36.34 and wave x recovered to $36.67. Wave y fell to $36.14, finalizing wave (ii). Silver then resumed its ascent in wave (iii). From wave (ii), wave i peaked at $36.87, wave ii corrected to $36.25, wave iii surged to $39.12, and wave iv pulled back to $38.05. The metal is expected to complete one more leg higher in wave v, concluding wave (iii) in a higher degree. A wave (iv) pullback should follow before the rally resumes.In the near term, as long as the pivot low at $35.38 holds, pullbacks are expected to find buyers in a 3, 7, or 11-swing sequence, supporting further upside in Silver.
XAU / USD 1 Hour ChartHello traders. Taking a look at the hourly chart, I have marked my no trade zone / area of interest for the upcoming sessions. I also marked where I would look for a long position if we dipped down to said area. Let's see how the overnight sessions play out. Big G get all my thanks. Be well and trade the trend. Thank you for checking out my analysis.

Bullish Reversal Builds in Copper: Eyes on $5.20 Resistance
The current price has closed above the Bollinger Band middle line (20-day SMA), indicating short-term upward momentum.
A sustained close above 4.90–4.95 could open the way to challenge the psychological level of 5.00 and possibly 5.20.
Immediate resistance: 4.95 → 5.00 → 5.20
Support zones: 4.75 (middle band) → 4.60 (recent low) → 4.45 (lower band)

XAUUSD Buy ForecastXAUUSD New Forecast👨💻👨💻
This is my personal trade and not in anyway a mandatory setup.
Note:
Follow proper risk management rules. Never risk more then 2% of your total capital. Money management is the key of success in this business...... Set your own SL & TP.
Please support this idea with a Like and COMMENT if you find it useful click "follow" on our profile if you will like these type of trading ideas delivered straight to your email in the future.
Thanks for your continued support!! lemme know your thoughts in the comment sec..

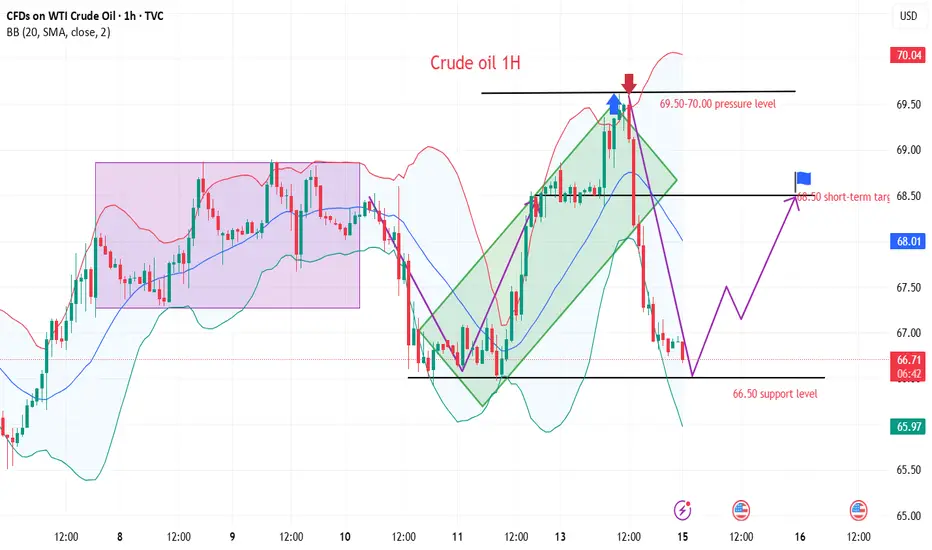
Crude oil rises slowly but falls quickly?
💡Message Strategy
International oil prices continued to climb on Monday, but the gains were limited. Brent crude futures rose 8 cents to $70.44 a barrel, continuing Friday's 2.51% rise. U.S. WTI crude rose 5 cents to $68.50, having surged 2.82% the previous trading day.
The main driving force behind this round of gains came from the market's expectation that the United States would further increase sanctions on Russia. U.S. President Trump said on Sunday that he would provide Ukraine with the Patriot air defense missile system and would make a "major statement" on the Russian issue on Monday.
The contradiction between supply and demand is also intensifying. According to market surveys, Brent crude oil rose by 3% last week and WTI rose by 2.2%. The International Energy Agency (IEA) pointed out that although the market supply and demand appear to be balanced on the surface, the actual global oil supply may be tighter than expected due to the summer refining peak and rising electricity demand.
📊Technical aspects
WTI crude oil continued its rebound from last week's low on the daily chart, and the current price is running at the downward support of $66.70, indicating that the short-term bullish power has increased. The MACD indicator shows a golden cross and initial volume, and the momentum column begins to turn positive, indicating that the price is expected to challenge the previous high area (69.50-70.20 US dollars).
The short-term (1H) trend of crude oil is highly repetitive, and the oil price is supported at the lower edge of the wide range and rises again. The short-term objective trend direction is upward within the range. The bullish momentum is sufficient.
💰Strategy Package
Long Position:65.50-66.50,SL:64.00,Target:69.00-70.00
WTI(20250715)Today's AnalysisMarket news:
Sources said that after Trump's latest trade tax threat, the European Central Bank will discuss a more negative scenario next week than expected in June. The ECB is still expected to keep interest rates unchanged at its meeting on July 24. Discussions on rate cuts are still postponed to September.
Technical analysis:
Today's buying and selling boundaries:
66.63
Support and resistance levels:
69.20
68.24
67.62
65.65
65.02
64.06
Trading strategy:
If it breaks through 66.63, consider buying in, the first target price is 67.62
If it breaks through 65.65, consider selling in, the first target price is 65.02

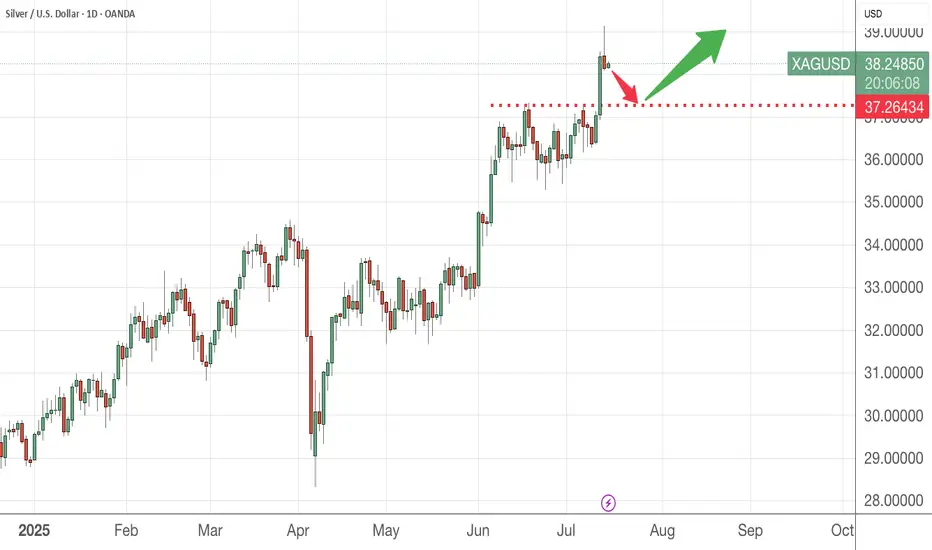
Time to accumulate some Silver We have a bearish pin bar yesterday and it is likely the price will retrace to 37.26 price level. There, I would be happy to accumulate more.
Please DYODD