Idea AITitle: XAU/USD – 4H: Bullish Demand Bounce Setup
Description:
- 📍 Daily Supply Zone (Resistance): **3,380–3,390**
- 📍 Daily Demand Zone (Support): **3,330–3,320**
- 🔍 Trendline (4H Higher Lows): Connect swing low ~3,290 to ~3,330
- 🎯 Fibonacci (for confluence): Low ~3,280 → High ~3,370
- ✅ Entry: Look for bullish confirmation (wicks, engulfing candle) in **3,330–3,320** zone
- 📈 Target 1: 3,435 (mid-swing), Target 2: 3,480 (swing high retest near 3,500)
- 🚫 Invalidation: Close below 3,315
#XAUUSD #Gold #TradingView #Structure #DemandSupply #4H
Futures market

XAUUSD 1440M forecast Based on the latest available information for July 15, 2025, the overall sentiment for XAUUSD (Gold) in the next 24 hours leans towards a bullish outlook, though with potential for short-term fluctuations and pullbacks.
Key Drivers for Bullish Outlook:
Escalating Trade Tensions: US President Donald Trump's ongoing tariff and trade policies are a significant factor. New tariffs and threats against various countries (EU, Mexico, Japan, South Korea, Brazil, Canada) are creating global economic uncertainty, which typically boosts gold's appeal as a safe-haven asset.
Geopolitical Uncertainty: Broader geopolitical risks, including those related to Russia and Ukraine, also contribute to safe-haven demand for gold.
Inflation Concerns: Tariffs are linked to inflation concerns. Gold performs strongly in a high-inflation environment, and market expectations are shifting towards a more gradual easing of interest rates by the Fed, allowing for inflation to be a potential driver.
Central Bank Demand: Central banks globally, particularly the US and China, continue to be strong buyers of gold, indicating a sustained structural trend of higher gold purchases.
Technical Support: Several analyses point to gold finding support at key levels (e.g., around $3340-3345, 200 EMA), suggesting potential for bounces and continuation of an upward trend.
"Buy on Dip" Strategy: Many analysts are recommending a "buy on dip" strategy, indicating an underlying bullish bias and viewing any short-term declines as buying opportunities.
Factors to Watch (Potential for Pullbacks/Volatility):
Short-Term Weakness/Consolidation: Some technical indicators suggest short-term weakness or consolidation, with gold testing resistance levels (e.g., $3375-3380, $3400).
US Dollar Strength: While trade tensions can weaken the dollar, there are mixed signals. A stronger US dollar can put downward pressure on gold prices as it makes gold more expensive for holders of other currencies.
Inflation Data and Fed Signals: Investors are closely watching US inflation data (CPI) and signals from Federal Reserve officials regarding interest rate cuts. While some expect cuts later in the year, any hawkish surprises could temper gold's rise.
Trade Deal Hopes: Any signs of de-escalation in trade tensions or progress towards agreements could temporarily reduce safe-haven demand for gold.
Specific Price Levels Mentioned:
Resistance: $3375-3380, $3400, $3432, $3450-3470, $3500 (all-time high).
Support: $3340-3345, $3325-3330, $3289-3303, $3240-3246.
In summary, the prevailing sentiment for XAUUSD over the next 24 hours appears to be bullish, driven by ongoing global trade tensions and safe-haven demand. However, be prepared for potential short-term pullbacks or consolidation as the market digests new information and tests key resistance levels.
For those interested in further developing their trading skills based on these types of analyses, consider exploring the mentoring program offered by Shunya Trade.
I welcome your feedback on this analysis, as it will inform and enhance my future work.
Regards,
Shunya Trade
⚠️ Disclaimer: This post is educational content and does not constitute investment advice, financial advice, or trading recommendations. The views expressed here are based on technical analysis and are shared solely for informational purposes. The stock market is subject to risks, including capital loss, and readers should exercise due diligence before investing. We do not take responsibility for decisions made based on this content. Consult a certified financial advisor for personalized guidance.
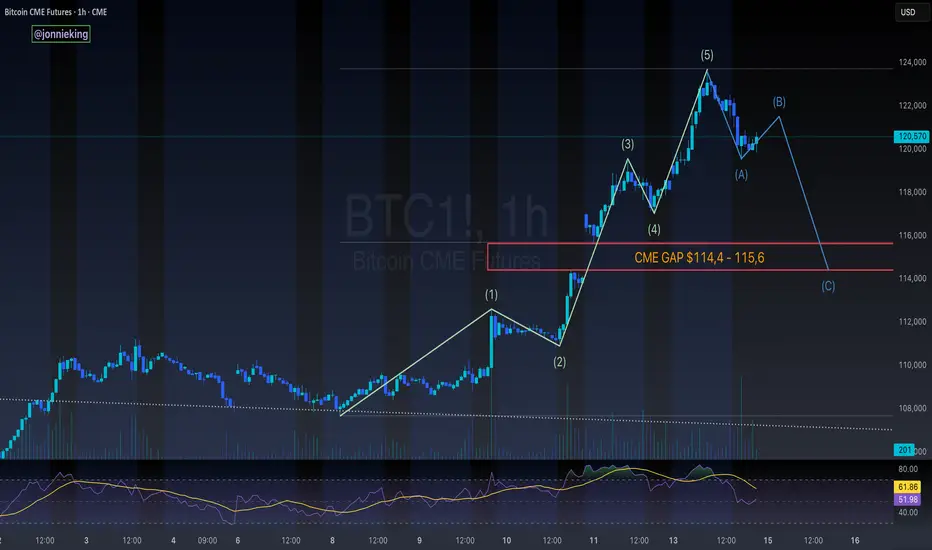
$BTC 5-Wave Impulse > ABC Correction > CME GapCRYPTOCAP:BTC appears to be headed towards an ABC correction after this impulsive 5-wave move to the upside
Would be a great opportunity to fill the CME gap ~$114k
Lines up perfectly with the 50% gann level retracement to confirm the next leg
don't shoot the messenger..
just sharing what i'm seeing 🥸
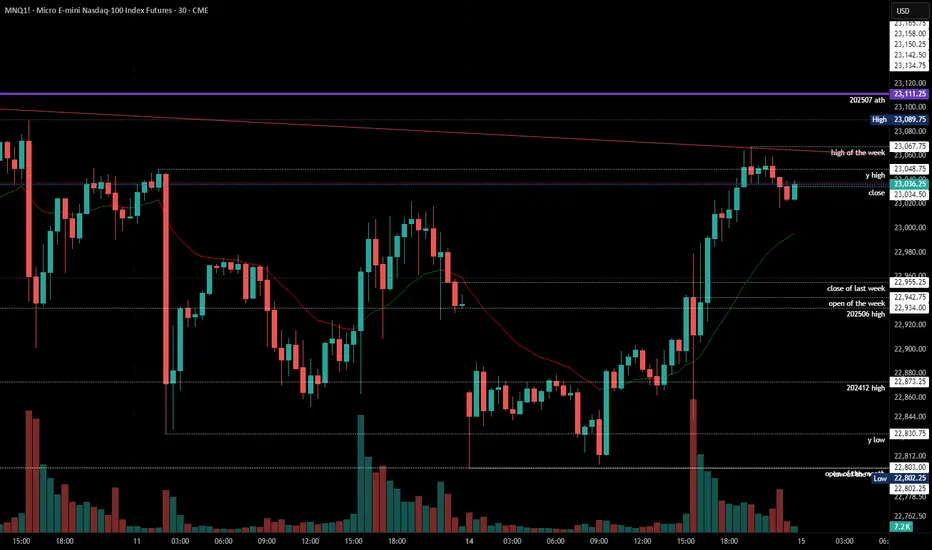
MNQ at the Supply Buffet. Will It Eat or SpitMNQ is hovering just under local highs after a textbook rally into a potential supply shelf. Price is compressing into a wedge between short-term resistance and dynamic trend line support. This is where the market reveals its hand either we break clean and run, or we roll over and unwind the entire move.
Here’s my full breakdown including swing entries, scalp options, confluence layers, and what I’m watching through the Tokyo, London, and NY sessions.
Primary trend: Bullish
Current condition: Compression under resistance (23,100 zone)
Market posture: Still within the ascending channel, but showing signs of indecision
We’re stacked on top of well-respected demand levels and riding a well-tested trend line. But price has now spent 5 sessions ranging just under short-term supply, and that opens up both breakout and breakdown scenarios depending on how it reacts in this key zone.
BULLISH SCENARIO — Trend Continuation
This play assumes the channel holds and buyers defend the 22,700 breaker block.
Primary Entry: 22,700 (Key reclaim level / breaker block)
Aggressive Entry: 22,950 (early reaction from structure front-run)
TP1: 23,500 (equal highs and channel extension)
TP2: 24,000 (clean trend extension target)
SL: 22,000 (below trend line and deep value failure)
Confluences:
Breaker block support from July 3 demand leg
Anchored VWAP from July 7 sits just above entry zone
Perfect alignment with channel midpoint and dynamic support
Buyers defended 22,700 multiple times during NY and London sessions
Macro still favouring tech risk-on
This is the continuation play. If 22,700 holds, I expect a swift push through supply with high reward potential.
BEARISH SCENARIO — Structural Breakdown
This play assumes the trend line and 22,700 level give way, confirming a change in structure.
Trigger: Clean 15m or 30m close below 22,700 and no buyer reclaim
Entry on Retest: 22,680–22,700 zone after breakdown
TP1: 22,200 (mid-trend demand base)
TP2: 21,900 (deep value demand zone)
SL: Above 22,800 (back inside structure = idea invalid)
Confluences:
Overhead supply has held 4+ sessions
Multiple liquidity sweeps above 23,100 with no follow-through
Momentum divergence + distribution signs on 5m-15m
London session often traps longs just before breakdowns
This isn’t about calling tops it’s about recognising when support fails. If 22,700 goes, the dominoes start falling.
Scalper Setup (Tokyo/London Focus)
For intraday traders hunting reactive entries with tight stops.
Short Idea:
Setup: Price sweeps into 23,090–23,130 zone during low liquidity (Tokyo/London premarket)
Trigger: Rejection wick or bearish engulfing on 5m–15m
TP: 22,950 or 22,700
SL: 23,150
Long Idea:
Setup: Quick drop into 22,950–22,900 front-run zone (pre-NY)
Trigger: Bullish engulfing or delta flip
TP: 23,100–23,200
SL: 22,850
Chart Structure Summary:
23,090–23,130 Short-Term Supply, Resistance shelf, range ceiling
22,700–22,750 Breaker Block Key structure to hold for bulls
22,200–22,400 Mid Demand Base, Trend structure, good R/R long
21,900–22,050 Deep Value Demand, Swing long zone, last line for bulls
Strategy Notes:
Use 15m for structure, 5m for entry, and 1H to confirm trend
Volume delta and order flow helps confirm traps/sweeps
Watch VWAP if price holds above, bias remains up
Don’t trade blindly into supply without confirmation let it reject or break
This isn’t just a supply test it’s a decision point for the next 300+ ticks.
The market is either:
Absorbing above demand and about to explode, or slowly distributing before a trend break.
As always don’t marry a bias. Let the levels do the talking. React, don’t predict. Let me know in the comments how you’re planning to play this.

DIYWallSt Trade Journal:The Importance of Your First Trade **07/14/25 Trade Journal, and ES_F Stock Market analysis **
EOD accountability report: +158.75
Sleep: 7 hours
Overall health: Good
** VX Algo System Signals from (9:30am to 2pm) **
— 8:00 AM Market Structure flipped bullish on VX Algo X3!
— 10:30 AM VXAlgo NQ X1DD Buy Signal
— 11:50 AM VXAlgo ES X1 Sell Signal
— 1:00 PM VXAlgo NQ X1DD Buy Signal
**What’s are some news or takeaway from today? and What major news or event impacted the market today? **
I need to really be careful with my first trade and making sure it is a high probability trade, otherwise a bad early start is likely to ruin my whole day.
News
— 1:42 PM *TRUMP TO UNVEIL $70 BILLION IN AI AND ENERGY INVESTMENTS
— 4:08 PM *S&P 500 ENDS HIGHER AS STOCKS RISE AFTER TRUMP SAYS OPEN TO DEALS ON TARIFFS
**What are the critical support levels to watch?**
--> Above 6295= Bullish, Under 6285= Bearish
Video Recaps -->https://www.tradingview.com/u/WallSt007/#published-charts

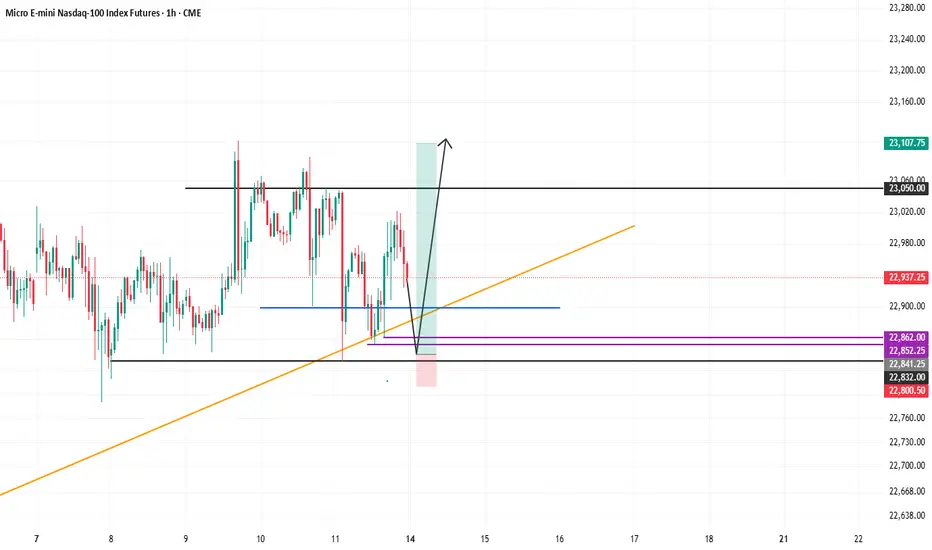
MNQ LONGHere we go again with confusing charts.
So to begin with, iam bullish until the orange trendline is broken, if its not broken and the price is still reacting positively to it as its doing so far, then iam very much bullish.
Also you should be aware that there is divergence started to show up on the daily and it looks massive on the 4h tf, also price swept last high and moved lower, even though the trend is still intact, it still shows some weakness.
my confidence in this setup is 7 out of 10
Since the price action is bearish for now, then if you want you can take some short until 22840, then go long from here.
Silver Wave Analysis – 14 July 2025
- Silver reversed from resistance zone
- Likely to fall to support level 37.00
Silver recently reversed down from the resistance zone lying at the intersection of the resistance level 39.00, upper weekly Bollinger Band and the resistance trendline of the weekly up channel from 2023.
The downward reversal from resistance zone created the daily Japanese candlesticks reversal pattern Shooting Star.
Given the strength of the nearby resistance zone and the overbought weekly Stochastic, Silver can be expected to fall to the next support level 37.00.

Gold Trading Strategy | July 14-15✅ From the 4-hour chart structure, the short-term support to watch lies in the 3340–3345 zone, which corresponds to the neckline level on last Friday's hourly chart. This is a key support area. If a pullback holds above this level, it may serve as a new launching point for the bulls.
✅ A deeper support zone is located around 3325–3330, which serves as the dividing line between a strong and weak bullish structure in the short term. If this level is broken, the bullish continuation will need to be re-evaluated.
✅ From the daily chart perspective, as long as gold prices remain stable above 3325, the overall bullish trend remains intact. The strategy of "buying on dips" remains valid. As long as there is no confirmed breakdown below this level, the outlook remains bullish.
✅ Trading Strategy Suggestions:
🔰 Initial Buy Zone: Consider light long positions on a pullback to the 3340–3345 area.
🔰 Add-on Zone: If the price dips further to the 3330–3335 area, consider adding to long positions.
🔰 Target Zone: Look for an upside move toward the 3365–3370 area, paying attention to the strength of the rebound.
🔥Trading Reminder: Trading strategies are time-sensitive, and market conditions can change rapidly. Please adjust your trading plan based on real-time market conditions. If you have any questions or need one-on-one guidance, feel free to contact me.

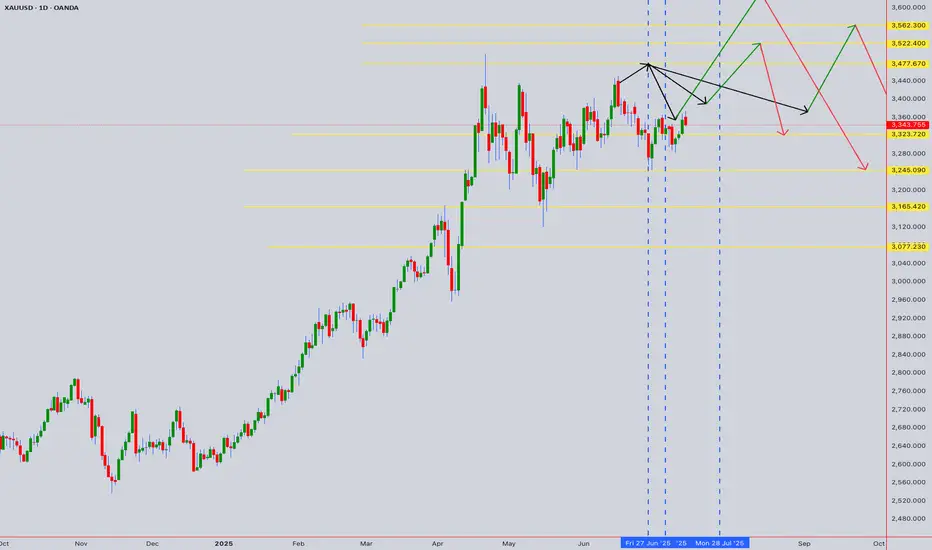
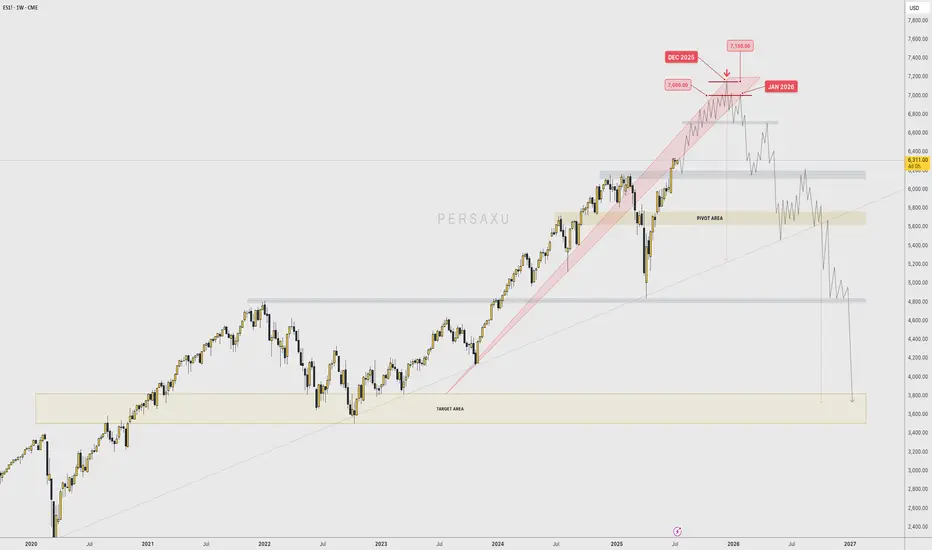
BEAR WITH ME... First of all, I'm getting into the field of other players and trying to call their type of shots.
I don't intend to come across as ignorant when it comes to this market, since I only trade gold and I have seen FOREX traders try to predict gold and get it completely wrong.
I have NO ARGUMENTS WHATSOEVER with which I could back this PREDICTION up; NOT PROJECTION...
As a matter of fact, Technically speaking , the " PROJECTION " would actually be BULLISH , because price is entering a "discovery" phase, In which there is no previous high to "top" a potential impulse with.
When price is making ATH, YOU CAN'T CALL THE TOP UNTIL THE TOP IS FORMED.
That being said, I only want to have this on my profile for personal use and see if my "prediction" comes a reality between December 2025 and February 2026.
--
2025-07-14 - priceactiontds - daily update - nasdaqGood Evening and I hope you are well.
nasdaq e-mini futures
comment:
The biggest surprise for next week would be a huge gap down Sunday futures open and having that gap stay open. If bears could actually do something like that and trap all bulls who bought above 22600, that would be amazing.
Spoiler: Bears could not. Another gap down and bear trap. It’s sad but the reality. Don’t expect strong bears all of the sudden.
current market cycle: bull trend
key levels: 22000 - 23100
bull case: Bulls defended 22800 which is still as bullish as it gets. Don’t make it more complicated than it is. We are going sideways under the ath, can print a new one any given day. Since I don’t have any targets above 23100ish, I won’t make stuff up here. I only wait for the profit taking to begin to look for shorts.
Invalidation is below 22700.
bear case: Bears are sad. Need a daily close below 22700. If they prevent bulls from printing a new ath above 23111, I would be surprised. No need to write more here until we see much much bigger selling pressure.
Invalidation is above 23500.
short term: Neutral. Bears not doing enough and bulls going sideways under ath. No interest in buying, so I am neutral until big bears come around.
medium-long term - Update from 2024-06-29: No change in plans. I expect 20000 to get hit over the next 3 months and maybe 19000 again.
trade of the day: Long the double bottom above 22800 or the retest on US open around 22830. Bears failed to print consecutive good looking 30m/1h bear bars, so a reversal was the most likely outcome after the double bottom.
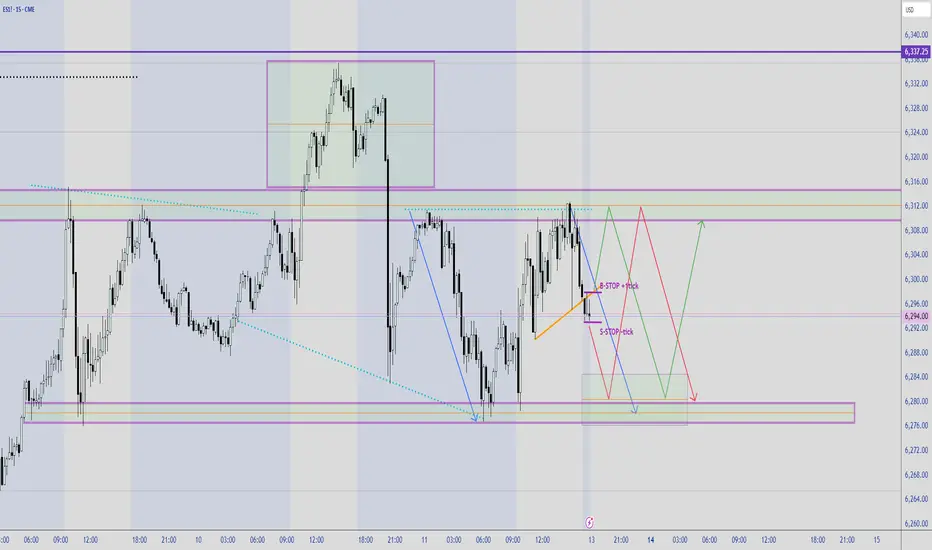
TRADING RANGE - ES!DT on the daily, ES! may pullback a little bit lower before moving up and breakout to a establish a new high. Last Friday was a High2 pullback, close lower than the previous bar. Looks like a consolidation or a trading range between 6336 to 6246. On the 15min paints 2 potential move either up or down, and bias seems to be bearish to complete the symmetry of the previous down leg then reverse back up. Rule of thumb buy or sell stop 1 tick above or below the marked lines.
XAUUSD Swing Trade Idea 14-07-2025Hello Traders!
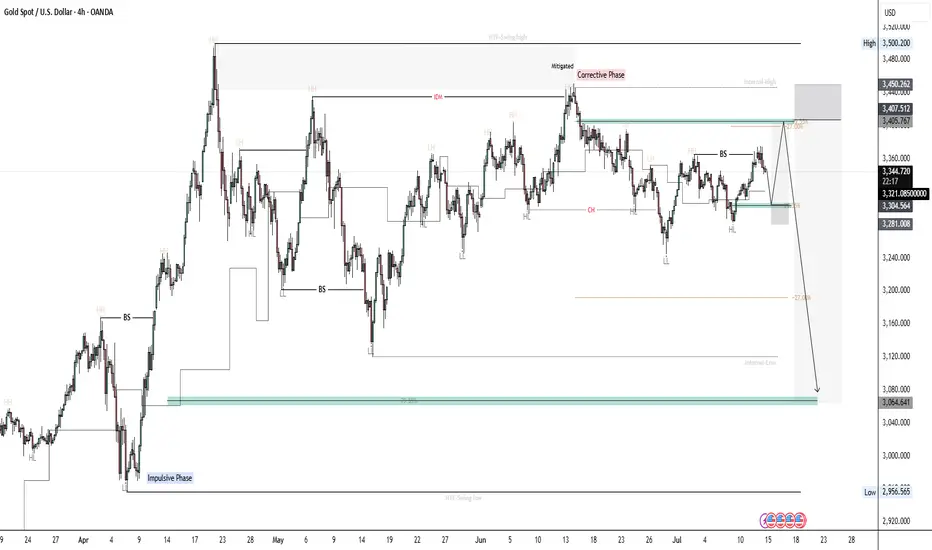
Here's a breakdown on XAUUSD: H4 Timeframe
1. Overall trend is Bullish; Price has been forming HH and respecting HL.
2. By using the identified swing points, we can highlight discounted levels where we expect price to resume the bullish trend. (Impulsive phase)
3. Gold in currently in a (Corrective Phase), and within that corrective structure we can identify impulsive phase and corrective phase. Like they say a structure within a structure
4. Breaking down the current structure we can clearly see that price grabbed liquidity above the last LH and mitigated the supply area which then led to MSS/CHOCH in the market.
5. We can then identify those internal points as internal high and internal low. I am currently expecting price to pull back into premium levels where I will be looking for selling opportunities targeting the discounted level.
6. Current price is playing around EQL, and if we are to zoom in on that structure, we will see that price is respecting a bullish trend structure by forming HH and respecting HL, currently expecting price to pull back into discounted levels then push higher to our premium level, as illustrated.
XAUUSD DOUBLE TOP AND HL REACTION ZONE 📉 XAUUSD – Double Top & HL Reaction Zone
Gold formed a potential double top pattern near the 3375 resistance zone, followed by a strong BMS and consecutive CHoCHs, signaling bearish pressure. However, price has respected the higher low (HL) structure near the 200 EMA, keeping the bullish structure intact for now.
We are currently in a key reaction zone.
If this HL holds and bullish intent appears, price may attempt another move toward the previous high.
If the HL breaks, a deeper correction could be in play toward 3327 or lower.
📌 Watch for:
Confirmation around 3350 zone
AND TP ZONE 3330 AROUND
HL reaction or breakdown

XAUUSD _ DOUBLE TOP AND HL REACTION ZONE 📉 XAUUSD – Double Top & HL Reaction Zone
Gold formed a potential double top pattern near the 3375 resistance zone, followed by a strong BMS and consecutive CHoCHs, signaling bearish pressure. However, price has respected the higher low (HL) structure near the 200 EMA, keeping the bullish structure intact for now.
We are currently in a key reaction zone.
If this HL holds and bullish intent appears, price may attempt another move toward the previous high.
If the HL breaks, a deeper correction could be in play toward 3327 or lower.
📌 Watch for:
Confirmation around 3350 zone
And tp 3330 around this zone
HL reaction or breakdown

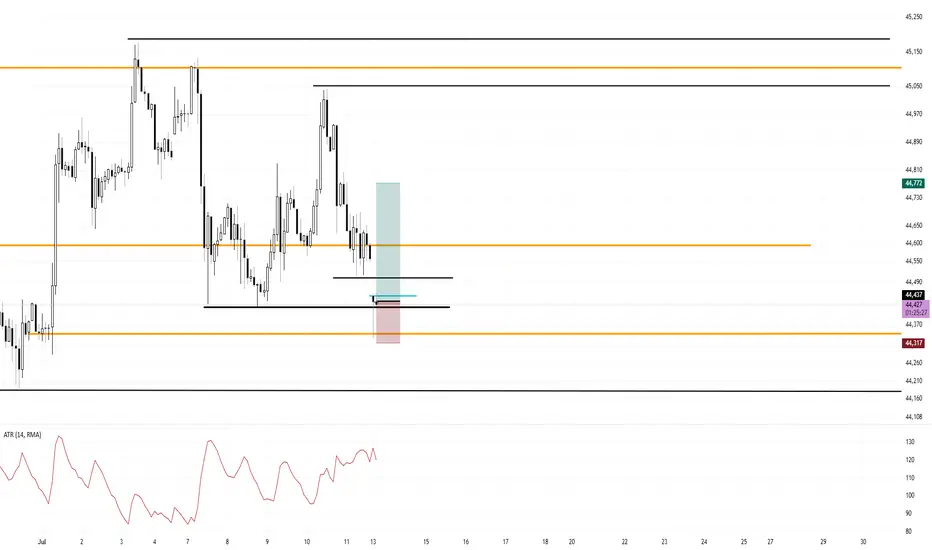
Range Bound Trade Trigger Long Dow FuturesI am Long now at 44,437
120 tick stop
335 tick target
Market gapped down, flushed the lows, tapped the monthly open by a hair and closed back inside. My stop is under the low and under the monthly open. My idea is that is will continue bullish back into the range.
Price is forming a range and mean reverting around March's Monthly Open.
February's Monthly Open was used as Resistance
I am giving this trade idea a go and if it doesn't work out, who cares. I don't know the order of my wins and losses and I must take every trade in my system.
CL down sub $60 before moving up above $73Expected support or reversal zone based on last swing high for CL is at $60. This matches with 0.786 fib level of last move up, suggesting a standard SBS structure forming. Expecting a move up to at least $73 (fib 0.236), possibly also well beyond this.
Based on time fib of last swing high I expect the bottom to occur before July 20th.
