Futures market

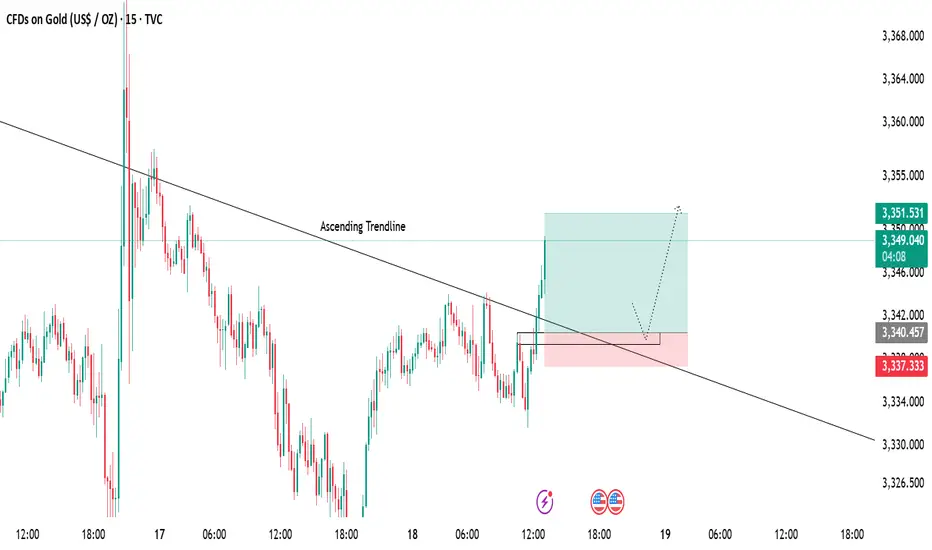
Gold 15-Min Chart Analysis Alert!Gold has successfully broken above the descending trendline, showing early signs of bullish momentum. Price has reclaimed structure and is now trading above the breakout level.
📌 Retest Zone:
We can expect a possible pullback towards the marked zone for a healthy retest before continuing the upward move.
🎯 Bullish Target:
As long as price holds above the support area, the bullish bias remains intact with targets around 3351+.

XAUUSD SIGNIFICANT CORRECTION ABOUT TO HAPPEN!!!Price is warming up to make a massive drop (correction) in higher Timeframe. We can spot a Wedge pattern that’s currently forming on the H4 timeframe which signals a bearish continuation. This would be the first significant correction since price broke out of the $2000 psychological level. A sell opportunity is what we await to capitalize on this market.

SILVER: Strong Bullish Sentiment! Long!
My dear friends,
Today we will analyse SILVER together☺️
The in-trend continuation seems likely as the current long-term trend appears to be strong, and price is holding above a key level of 38.281 So a bullish continuation seems plausible, targeting the next high. We should enter on confirmation, and place a stop-loss beyond the recent swing level.
❤️Sending you lots of Love and Hugs❤️

Xauusd and Gold moves down Market Bias: Structured Bullish (with Liquidity Grab)
Chart Date: July 18, 2025
---
🔎 1. Market Structure Analysis:
✅ CHoCH: Trend reversal confirmed near July 3, where lower highs broke and bulls gained control.
✅ BMS: Break of market structure confirms bullish control after price broke multiple internal lower highs.
🔁 Internal Liquidity Sweep: Price swept recent lows near 3330 to collect liquidity before moving up — classic smart money move.
🔼 Higher Lows (HL) forming after FVG fills, indicating strength.
---
🧱 2. Key Zones & Confluence:
🔹 Fair Value Gaps (FVGs):
✅ Bullish FVG at 3340–3345: recently tapped and respected → confirms institutional interest.
🔼 Unfilled FVG above 3360 → potential magnet for price.
🔹 EMAs:
2 dynamic EMAs (approx. 50 & 34): price cleanly broke above both and retested → bullish signal.
🔹 Support/Order Blocks:
Strong demand zone: 3322–3332 (where liquidity sweep occurred).
Hidden bullish OB under FVG, giving triple confluence (Structure + FVG + OB).
🔹 Resistance/Supply Zone:
Clean rejection zone around 3365–3368. Final TP or area to watch for reversal.
---
📊 3. Trade Setup: (Swing Trade – Smart Money Based)
🟢 Entry:
Ideal Entry Zone: 3342–3348
(Pullback into FVG + OB + EMA + bullish candle confirmation)
🔴 Stop Loss:
Below liquidity grab low: 3320 (well-protected SL below breaker block)
🎯 Take Profits:
TP1: 3360 (next minor resistance + FVG top)
TP2: 3368 (major supply zone)
TP3 (Optional Swing): 3382–3390 (if breakout confirms)
📈 Risk-Reward Ratio:
Minimum 1:3 — Excellent swing setup for pro traders
---
⚠️ 4. Risk Management & Notes:
Avoid trading during red folder news (USD-related events shown below).
If price closes below 3320 on 4H, re-evaluate bias.
Monitor 1H for confirmation entry: bullish engulfing or BOS + OB.
---
🧠 5. Pro Tips (TradingView Discipline):
Use alerts at 3345 and 3360.
Never revenge trade if SL hits. Reassess bias with structure shift.
Journaling this trade is important: track how FVG/CHOCH/BMS interact.

Xauusd and gold chart move bullish 📈 GOLD (XAUUSD) – 4H Technical Professional Idea Description
⚡️ Market Bias: Bullish Until Proven Otherwise
🧠 Idea Overview:
The current 4H structure on XAUUSD shows multiple Bullish CHoCH and BMS (Break of Market Structure) confirmations after price rejected from the previous supply zone. We are now trading above the 4H FVG zone and just reclaimed the mid-supply area with strength. This suggests a bullish continuation is likely as long as price holds above the current fair value gap and EMA confluence.
---
🔍 Key Observations:
1. Strong Bullish CHoCH + BMS Confirmations:
Multiple bullish CHoCHs confirm a shift in market structure from bearish to bullish.
A recent BMS shows higher highs being formed – clear bullish intent.
2. FVG Reclaim + Reaction:
Price aggressively filled and bounced from multiple bullish Fair Value Gaps (FVG).
Most recent FVG has held and price is pushing upward with momentum.
3. EMA Support Confluence:
EMA 20 and EMA 50 are providing dynamic support (Blue & Pink lines).
Price bounced directly off EMA and resumed upward momentum.
4. Liquidity Above Still Untapped:
Liquidity exists above 3362, 3369, and 3371 zones.
These are likely targets if bullish continuation persists.
5. Demand Zone Below Is Respected:
Strong reaction from the demand block around 3311–3322, validating buyer interest.
Until this zone breaks with high volume, bias remains bullish.
---
🎯 Trade Setup Idea (Hypothetical Example)
Entry Zone: Around 3345–3352 (pullback/retest to reclaimed FVG zone)
Stop Loss: Below 3332 (beneath last demand + structure invalidation)
Target 1: 3362
Target 2: 3369–3372 (liquidity sweep zone)
Target 3 (extended): 3395+ if momentum and macro fundamentals support continuation.
---
🔐 Risk Management Notes:
No entry if FVG fails and price closes below 3330 (Invalidation of bullish structure).
Watch for macro events (USD news marked on chart) before entry — High impact events can cause whipsaws.

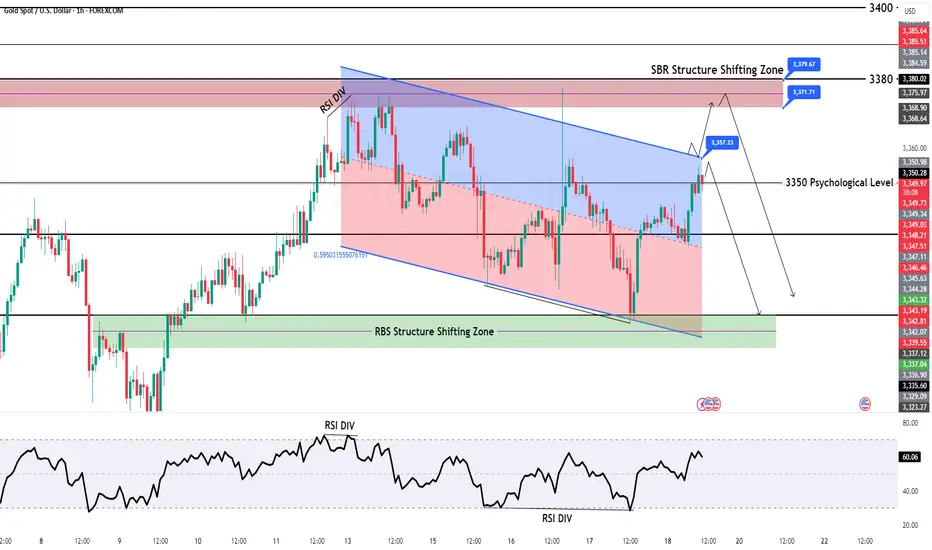
GOLD Intraday H1 Chart Update For 18 July 25Hello Trader, Today we have closing day
For now market is still in Bearish Channel range and try to sustains below 3350 Psychological Level
Further only market clear breakout of 3385 level then we will be on Bullish side other we are remains bearish for now
All eyes on Todays Closing
Disclaimer: Forex is Risky
XAUUSD Analysis todayHello traders, this is a complete multiple timeframe analysis of this pair. We see could find significant trading opportunities as per analysis upon price action confirmation we may take this trade. Smash the like button if you find value in this analysis and drop a comment if you have any questions or let me know which pair to cover in my next analysis.

SILVER - NEW BREAKOUT !Hello Traders !
The Silver price formed a bullish descending triangle!
Currently, the resistance level (37.50 - 36.50) is broken!
This key level becomes new support level!
So, I expect a new bullish move🚀
______________
TARGET: 41.50🎯

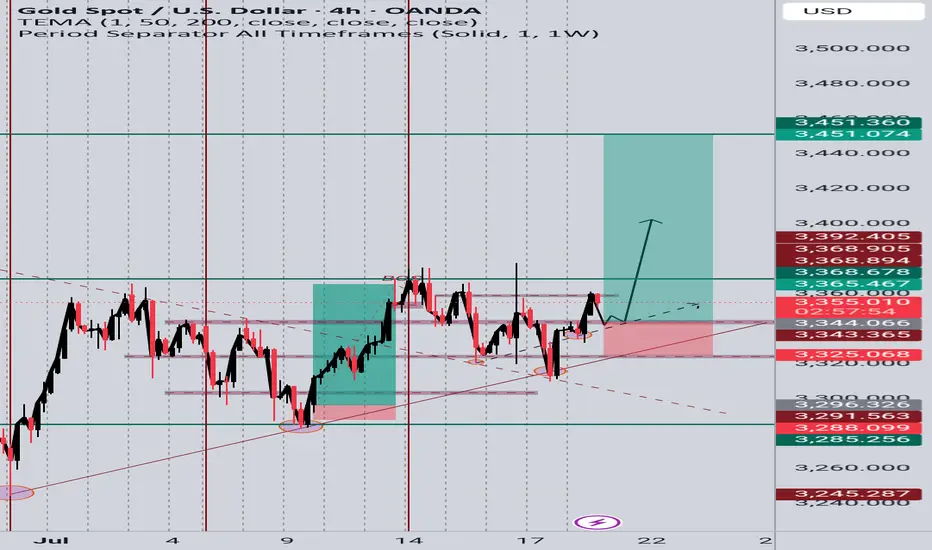
GOLD (XAUUSD) Long Idea – Breakout Confirmation📆 Timeframe: 4H
📈 Type: Long (Buy)
🎯 Entry: Around 3348-3355
🎯 Target: 3451
NOTE: Price has respected the ascending trendline from early July.
Clean breakout from a consolidation range after several rejections near 3365 resistance.
Bullish structure confirmed with higher lows and higher highs.
Fibonacci levels and support zone at ~3344 are holding strong.
Targets set at prior resistance zone (~3451), aligning with liquidity zone.
XAUUSD Sell Setup "XAUUSD Sell Setup 📉
Price rejected strongly from the descending trendline resistance.
Bearish momentum still active below 3345 zone.
Selling from this level targeting 3311 with tight SL above 3358.
Trade safe & stick to your plan! 💪✨

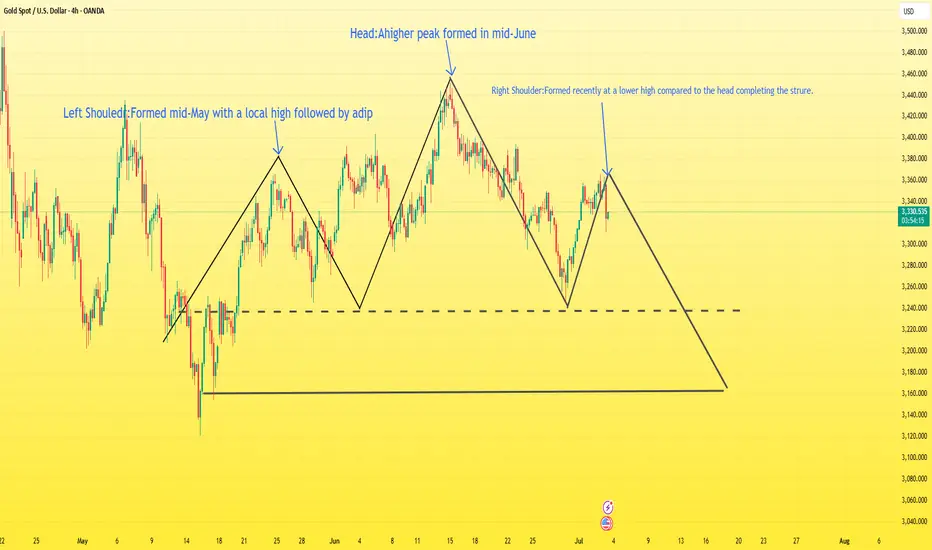
Will gold return to 3500?XAU/USD Head and Shoulders Breakdown Analysis
The chart shows a classic Head and Shoulders pattern forming on the 4H timeframe, indicating a potential bearish reversal setup.
Left Shoulder: Formed mid-May with a local high followed by a dip.
Head: A higher peak formed in mid-June.
Right Shoulder: Formed recently at a lower high compared to the head, completing the structure.
The neckline has been clearly defined, and price is currently hovering just above it. If the price breaks and closes below the neckline with strong bearish momentum, it would confirm the pattern.
Target: The projected target from the breakdown is around 3163, calculated by measuring the height from the head to the neckline and projecting it downward.
Outlook:
A confirmed break below the neckline would open the door for further downside toward the target zone.
Bears will be in control if price sustains below the neckline with increasing volume.
Wait for confirmation on the neckline break before considering short entries.
If you are a newbie or your account is burning, don't trust any advice easily. Contact me. I will give you free advice.
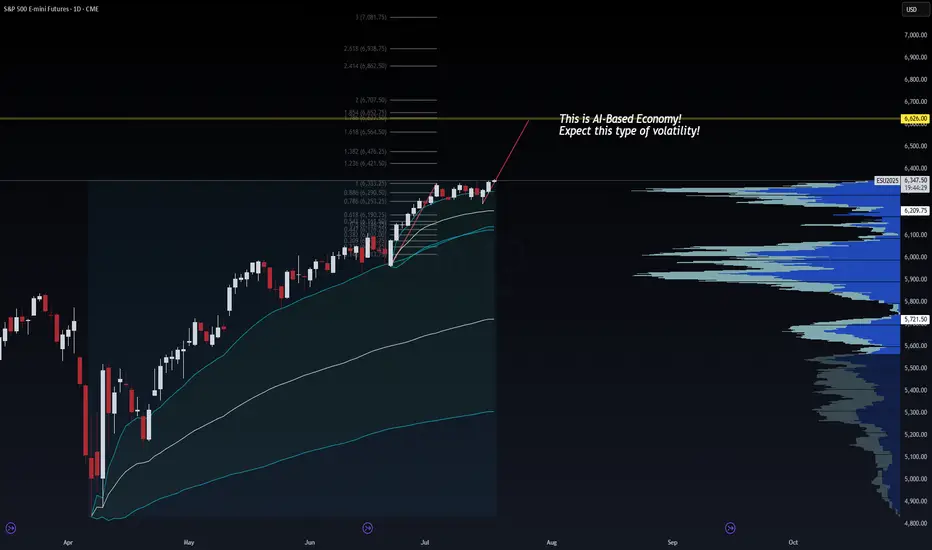
AI Economy Surge: ES Heading to 6626? | VolanX Protocol in Actio🧠 AI Economy Surge: ES Heading to 6626? | VolanX Protocol in Action
📅 Date: July 17, 2025
📈 Instrument: ESU2025 – S&P 500 E-mini Futures
🔍 Timeframe: Daily
🔗 Powered by: WaverVanir DSS | VolanX Protocol
🌐 Macro Backdrop:
📉 Fed on Pause: Market pricing implies a 70% probability of a rate cut in September 2025, driven by disinflation, labor softness, and rising default rates in CRE and consumer credit.
🤖 AI Productivity Shock: Mega-cap tech is driving EPS beats, but real productivity gains are lumpy. We're witnessing a volatile transition to an AI-dominated economy.
💼 Liquidity Conditions: Treasury issuance rising but absorbed for now. Reverse repo drains slowing. This creates windows of upward momentum, though fragile.
📊 Technical Outlook (VolanX DSS):
Price rejected 0.786–0.886 retracement zone, confirming institutional defense near 6,300.
Momentum has shifted back to bulls with a clean reclaim of short-term VWAP bands.
Fibonacci extension targets:
🎯 1.236 = 6,421.50
🎯 1.618 = 6,654.50
🟡 High-probability magnet = 6,626 (aligned with 1.5 std dev extension + volume node gap fill)
📌 Key Levels:
Support: 6,290 • 6,209 (HVN) • 5,721 (Macro POC)
Resistance: 6,421.5 • 6,626 • 6,938
🎯 Trade Setup (Options Strategy):
🛠️ High Conviction Trade – Bull Call Spread
Buy ESU25 6350 Call
Sell ESU25 6625 Call
DTE: 30–45 days
Max Risk: Defined
Max Reward: Captures full extension to 6625 zone
✅ This spread is risk-defined, benefits from moderate upside, and avoids IV crush vs outright long call.
🎯 Use if you expect a grind higher with spikes, not a straight melt-up.
Gold will crash1. What happened yesterday
As expected, Gold started to rise after finding support at 3250. The move up played out perfectly, reaching the resistance area highlighted in yesterday’s analysis — around 3320–3340.
________________________________________
2. The key question today
Is this just a correction in a bearish trend, or the start of reversal?
________________________________________
3. Why I remain bearish
• On the weekly chart, structure still leans bearish
• On lower time frames, the bounce looks corrective — not impulsive
• No breakout above 3360 yet, which would be needed to shift the bias
• A move back below 3320 would likely trigger renewed selling
• If that happens, 3250 could be tested again quickly
We need to respect the bounce — but not overreact to it.
________________________________________
4. Trading plan
My bias remains bearish as long as price stays under 3360.
However, if we get a daily close above 3360, I’ll pause and re-evaluate the short bias. The market would then be signaling a potential trend shift.
________________________________________
5. Final thoughts 🚀
This is a key moment for gold. We’re at resistance zone but not broken above yet.
Until proven otherwise, the trend remains down — and rallies into 3340 zone should be considered selling opportunities.
Comments If you are new here, or your account is getting burned, please contact me. I will help you.
Daily live trade with XAUUSD in 15m/30m/1h 20250718Daily live trade with XAUUSD in 15m/30m/1h 20250718

How to find solid trading opportunities amid gold volatility?Gold opened at around 3338, and then fluctuated and fell after reaching the highest point of 3344. The 3313 long orders that were publicly deployed yesterday reached the target range of 3327-3330 as expected and stopped profit smoothly. Although the overall trend is weak, it has never effectively left the range, and the typical bottoming rebound structure is still an important basis for the low-multiple thinking. The market rose to around 3340 in the short term and then fell again. The overall operation fluctuated and consolidated below 3340, and failed to reach the expected short order entry position, and maintained fluctuations until the close.
At present, gold is still in the range of fluctuations. Although the hourly line has some fluctuations, there is no obvious directional breakthrough, and it is more of a consolidation and accumulation state. The upper short-term suppression focuses on the 3345-3355 line, which is the current primary resistance area; the lower support focuses on the 3325-3315 area, and the judgment of the long and short key nodes is maintained. The daily structure shows a yin-yang staggered pattern. The market sentiment is cautious and the long and short forces are relatively balanced. Before an effective breakthrough is formed, the operation should be based on support and pressure points to avoid chasing ups and downs and do a good job of risk control.
Operation suggestions are as follows:
1. Go long near 3325-3315, with a target of 3340-3345.
2. Go short near 3345-3355, with a target of 3325-3320.
Today is Friday, and it is recommended to respond steadily, focusing on the competition for key support and resistance areas. I will prompt more real-time strategies and entry points at the bottom, remember to pay attention to it as soon as possible.

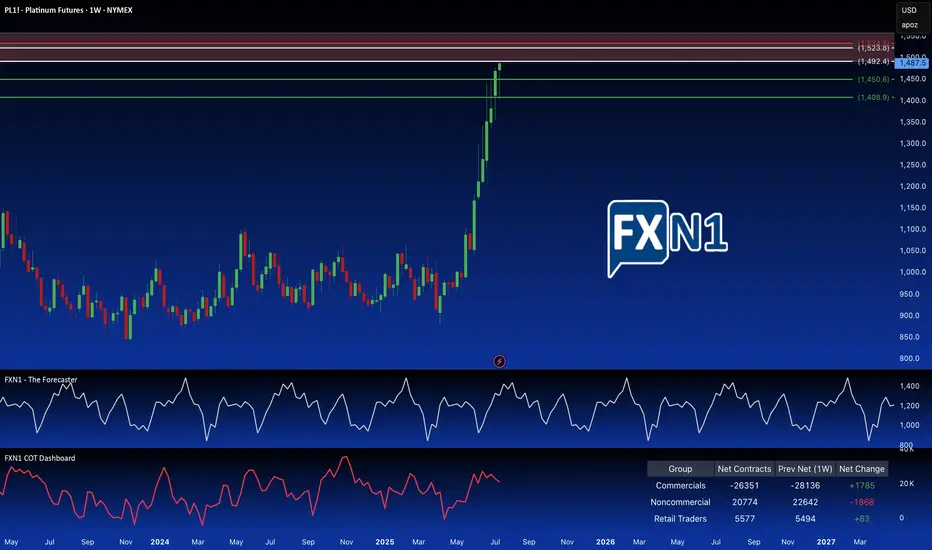
Platinum: Breaking the Supply Barrier?I'm adding a second Platinum position. Price has hit a strong weekly supply area, also a significant monthly supply zone. I'm anticipating a reversal here, as non-commercial holdings are decreasing, and seasonal patterns suggest a potential trend change. To further capitalize on potential upside, I've placed a pending order above the primary supply zone, at a slightly higher, but still relevant. These are older, established and fresh supply zones.
(Note: Reducing the chart size may help to better visualize the long-term significance of these overlapping areas.)
✅ Please share your thoughts about PL1! in the comments section below and HIT LIKE if you appreciate my analysis. Don't forget to FOLLOW ME; you will help us a lot with this small contribution.
XAUUSD – Summer Triangle ConsolidationGold (XAUUSD) is unfolding a textbook contracting triangle on the 4H chart, currently developing leg D of the pattern. This structure has been forming over the past few months and reflects classic market behavior during the summer — slow, sideways consolidation as many participants are away for the season.
Given the current structure, I expect one more leg down to form wave E, completing the triangle. Once this leg is in place and the support trendline holds, we could see a significant breakout to the upside in line with the broader bullish outlook on higher timeframes.
This setup remains valid as long as price continues respecting the triangle boundaries. I’m watching for a clean rejection at the lower trendline near point E to validate the bullish breakout scenario.
📌 Seasonality, structure, and market tempo suggest patience as the consolidation plays out. The breakout opportunity may follow shortly after leg E concludes.

GOLD 18.7.2025 FRIDAYHow to see on chart. waiting for clearly breakout of 4h channel then buying gold with SL . I see potencial taking Liquidity of 3390-3400. Enjoy!

Gold Price Analysis July 18XAUUSD Analysis
Gold has just had a deep sweep to 3310 before bouncing back within the trading range. Currently, the price is reacting at the Trendline area around 3344. This is an important level - if broken, gold can return to the uptrend, with the nearest target at 3373.
🔹 Key Levels
Support: 3332 - 3312
Resistance: 3344 - 3357 - 3373 - 3389
🔹 Trading Strategy
BUY trigger: when price breaks 3344
BUY DCA: when price surpasses 3353
SL: below 3332
Target: 3373
💡 Note:
The 3332 area plays an important role in the bullish wave structure, suitable for placing Stop Loss for BUY orders.

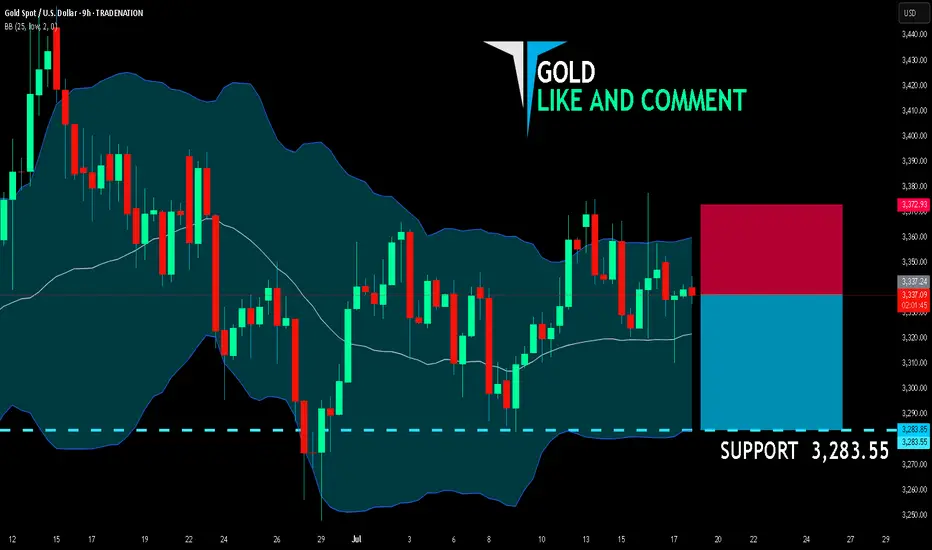
GOLD SELLERS WILL DOMINATE THE MARKET|SHORT
GOLD SIGNAL
Trade Direction: short
Entry Level: 3,337.24
Target Level: 3,283.55
Stop Loss: 3,372.93
RISK PROFILE
Risk level: medium
Suggested risk: 1%
Timeframe: 9h
Disclosure: I am part of Trade Nation's Influencer program and receive a monthly fee for using their TradingView charts in my analysis.
✅LIKE AND COMMENT MY IDEAS✅
#XAUUSD Buy 3342.06#XAUUSD Buy 3342.06
Stoploss 3333.06
Breakeven 3343.06
TakeProfit 1: 3352.06
TakeProfit 2: 3362.06
TakeProfit 3: 3372.06
TakeProfit 4: 3382.06
TakeProfit 5: 3392.06
Trade at your own risk
Protect your capital
The Wizard 🧙♂️ FDT
Fri 18 Jul ‘25 08:00 AM NGN
