Leqidity huntHTF OB in a 1H OB , 3 circles of rejection and IMB/FVG below that boost the direction,
OB is the game,. FVG is confirmation and Liquidity is Love, so sell on any FVG down becauE that is rhe confirmation we need
Futures market

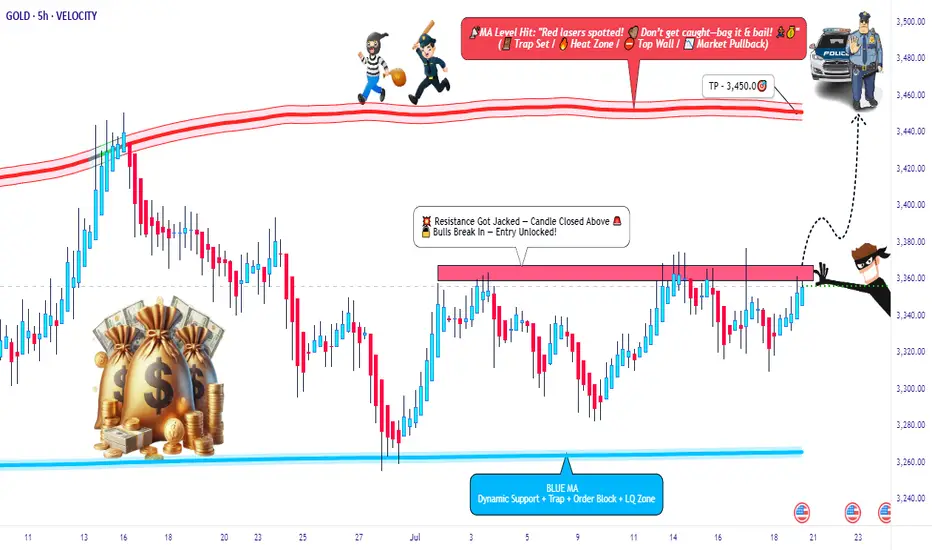
XAU/USD Breakout Playbook – Rob the Market!🚨💰 GOLD HEIST IN MOTION! | XAU/USD Thief Trading Strategy (Breakout Edition) 🏴☠️
🧠 Strategic Mindset | Not Your Average Chart Talk
Yo Market Bandits & Pip Hunters – welcome to the underground playbook!
This isn't your grandma’s chart breakdown – it’s a Thief Trading Takedown on XAU/USD (Gold), where we’re not chasing the market… we’re outsmarting it.
THE MASTER PLAN: Enter Like a Ghost, Exit Like a King 👑
📍 ENTRY POINT – The Break-In Begins!
💥 Breakout Level: Watch for 3370.00 resistance to crack – this is our green light.
🕵️♂️ Entry Style:
• Buy Stop above MA resistance zone (fast & clean)
• OR Buy Limit near swing low zones after confirmation pullback (sniper entry)
🧠 Thief Tip: Wait for the breakout to happen. No orders, no SL before it. Patience is profit.
🔄 Layer the Entry:
• Deploy DCA (Dollar Cost Averaging) or scaling entries with precision
• Build positions like stacking cash bags — smart, silent, and calculated
🛡️ PROTECT THE LOOT – Stop Loss Logic 💣
📍 SL Guide: 3310.00 (4H swing low – update as price structure evolves)
🔥 SL ONLY comes after breakout. Set it too early? That’s how you get caught.
⛔ No pre-breakout orders. No early SL. Stay invisible till it's go time.
🎯 THE ESCAPE – Profit Like a Phantom 🚀
💸 Take Profit: 3450.00
📉 Scalpers: Trail SL as price pushes – never give back stolen pips
🌀 Swing Traders: Monitor resistance layers – don’t let the bulls turn on you
🧭 CONTEXT – Why This Setup?
🔍 Macro Snapshot:
• Trend: Neutral/Bullish Lean
• Influencers: COT reports, geopolitical tension, dollar flows
• Sentiment Shifting – watch the herd, but don’t run with it
🗞️ News Risk: Don’t get wrecked by events! Avoid entries during high-impact news.
🚨 Trailing SL is your best weapon during volatility.
⚡ POWER UP THE CREW – Support the Movement
💬 Drop a comment, hit the 🔥 like button, and share with your trading gang
More Thief Trading blueprints coming soon – bigger breakouts, cleaner setups
⚠️ STAY SHARP, THIEVES!
This ain't financial advice – it’s an outlaw’s edge on the market.
Trade smart. Risk well. Protect the bag.
🏴☠️ XAU/USD GOLD HEIST IN PROGRESS... Join the Movement. Let’s Rob the Market.
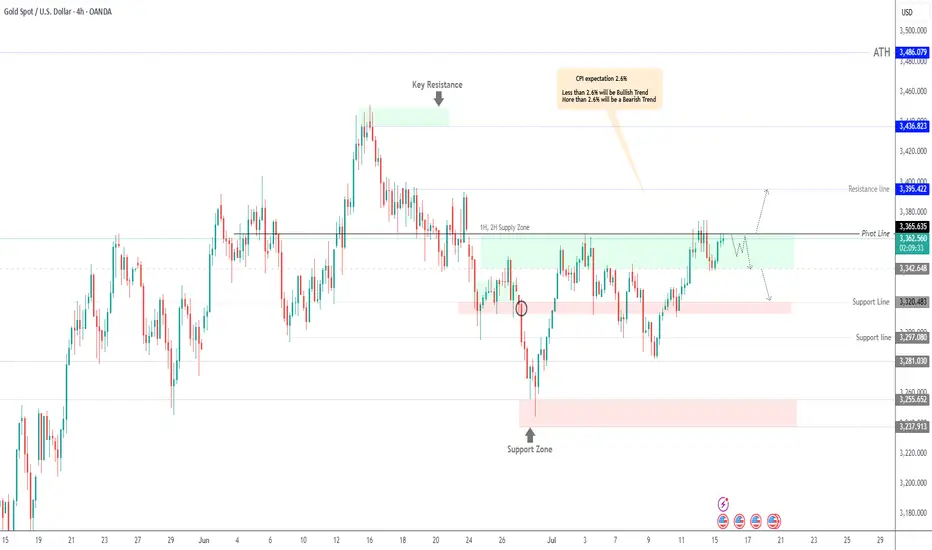
GOLD Under Pressure – CPI to Drive the Next MoveGOLD Outlook – Bearish Below 3365, CPI in Focus
Gold is showing bearish momentum while trading below 3365, with a likely move toward 3342.
However, if the price closes a 1H or 4H candle above 3365, it may shift to a bullish trend targeting 3395.
CPI data will be the key factor in determining the next move.
The market expects a print of 2.6%, which would signal no Fed rate cuts this year due to rising tariff pressures.
That said, we expect a 2.7% release, which would likely support a bearish trend for gold.
But if the release is less than 2.6% that will support the bullish trend.
Pivot Line: 3365
Support: 3342 – 3320
Resistance: 3375 – 3395
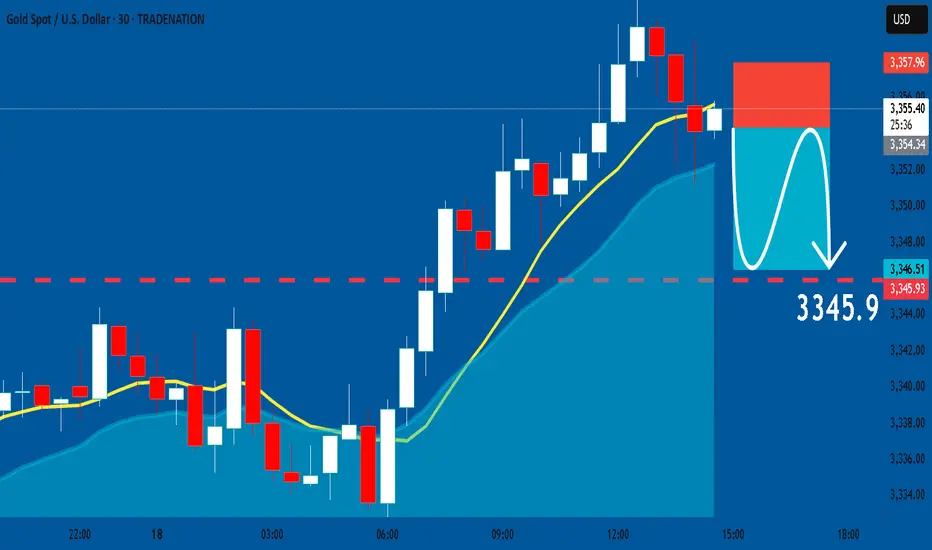
GOLD: Short Trade Explained
GOLD
- Classic bearish pattern
- Our team expects retracement
SUGGESTED TRADE:
Swing Trade
Sell GOLD
Entry - 3354.53
Stop - 3357.9
Take - 3345.9
Our Risk - 1%
Start protection of your profits from lower levels
Disclosure: I am part of Trade Nation's Influencer program and receive a monthly fee for using their TradingView charts in my analysis.
❤️ Please, support our work with like & comment! ❤️
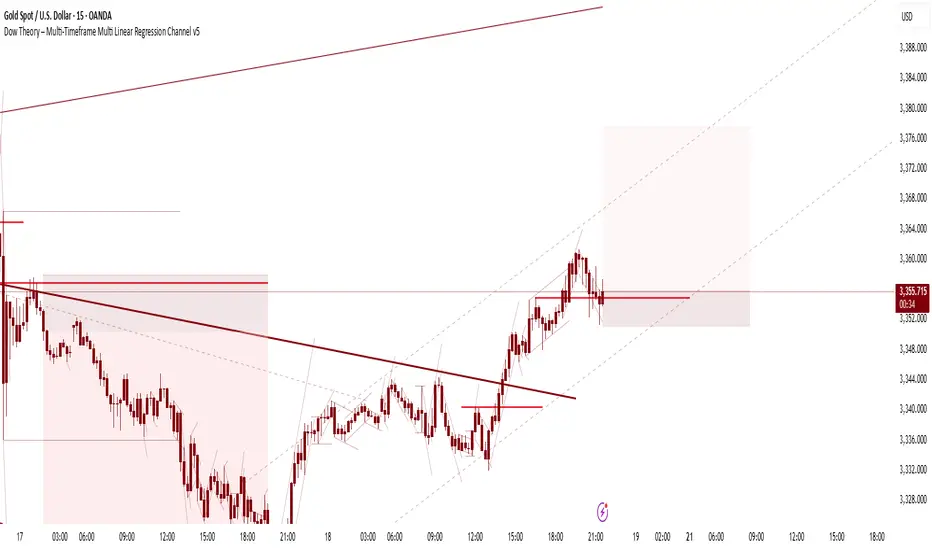
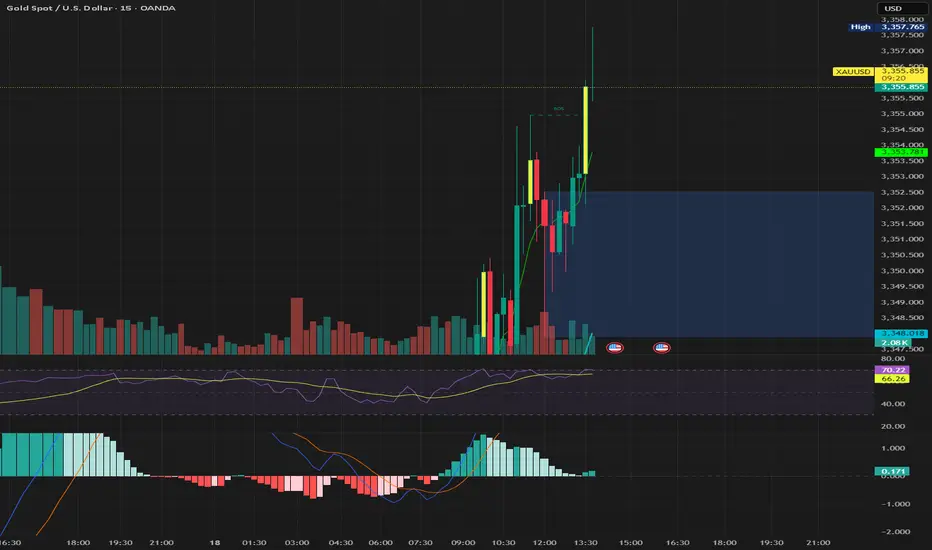
The short-selling idea remains unchanged, defend 3355📰 News information:
1. Powell responds to White House issues
2. Will other countries impose reciprocal sanctions on tariffs?
📈 Technical Analysis:
Gold closed with a long lower shadow on the daily line yesterday and closed with a doji on the hourly line. In the short term, gold may continue to rise and is expected to touch the 3355 line. If gold cannot break through and stabilize above 3355, then gold may fall back. We can still consider shorting, and the target can be 3330. If the trend is as expected, it may form the embryonic form of a head and shoulders bottom. On the contrary, if the gold price breaks through 3355, stop loss on short positions and pay attention to the high resistance of 3375-3385.
🎯 Trading Points:
SELL 3340-3355
TP 3330-3320
In addition to investment, life also includes poetry, distant places, and Allen. Facing the market is actually facing yourself, correcting your shortcomings, facing your mistakes, and exercising strict self-discipline. I share free trading strategies and analysis ideas every day for reference by brothers. I hope my analysis can help you.
TVC:GOLD PEPPERSTONE:XAUUSD FOREXCOM:XAUUSD FX:XAUUSD OANDA:XAUUSD FXOPEN:XAUUSD

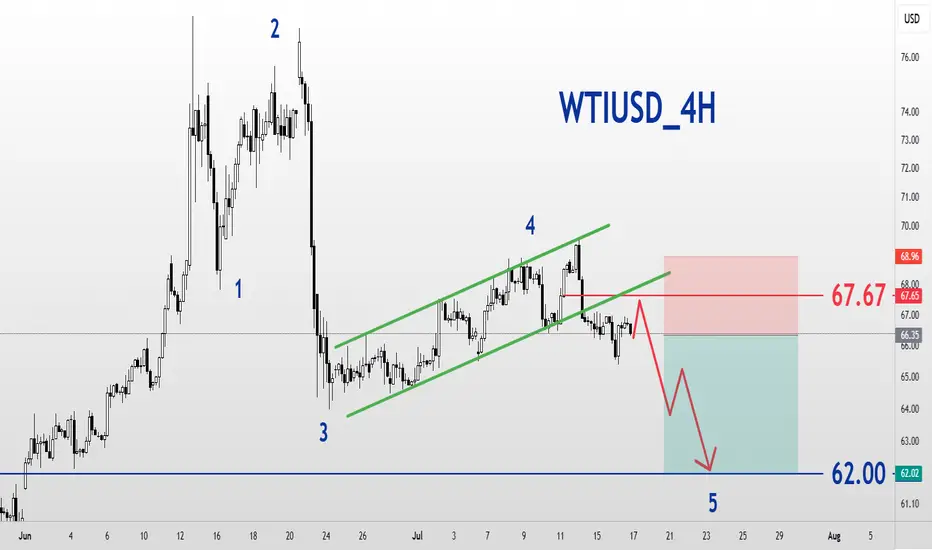
WTIUSD_4H_SellWest Texas Intermediate Oil Analysis
Short-term Time Frame
Elliott Wave Analysis Style
The market can only continue to decline by holding the resistance at 67.67 and moving towards the target of wave 5 at $62.
Xausd techinical analysis.Xausd techinical analysis next move posibale at h1 time frame.not finchinal advice.

USOILBullish senaorio
"BUY Call / Long – Strong upside trend across most timeframes, supported by disrupted supply, elevated oil prices due to real production losses, and renewed geopolitical risk."

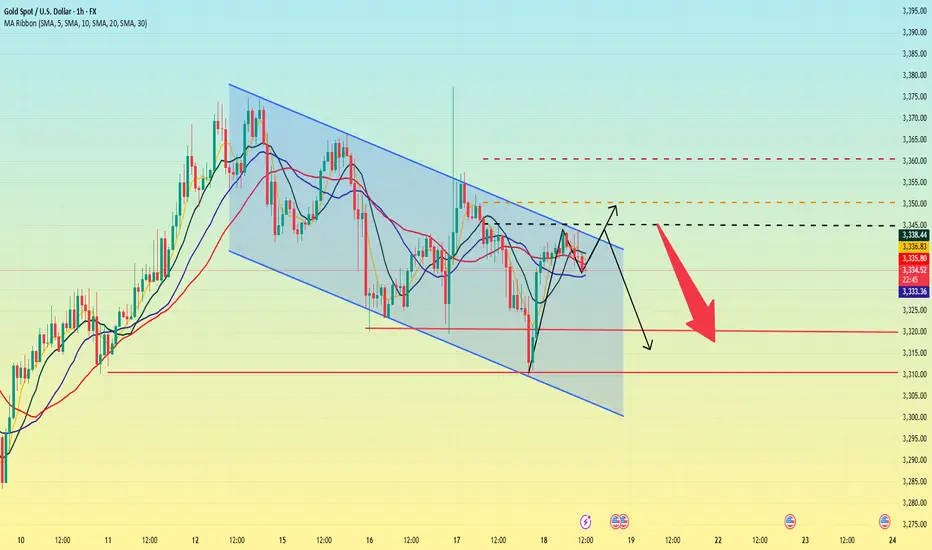
Gold is in danger. Could it fall?Gold started to fall slowly after the Asian market opened on Thursday, and continued to fluctuate and fall in the European market. The impact of the initial data in the US market fell sharply to around 3310, then stabilized and rose. It reached a high of around 3341 and then maintained a high sideways fluctuation, and the daily line closed with a negative line.
The price trend of gold this week was erratic. On Wednesday, it rose and fell, closing with a positive line, indicating that there was strong resistance above; on Thursday, it fell and rebounded, closing with a negative line, indicating that there was some support below. The current moving average system is chaotic, which further confirms that the overall situation is in a wide range of fluctuations.
Connecting the highs and lows of this week can form a fluctuating downward channel, which still has an important guiding role in the market. The current channel resistance is at 3345. If the gold price can break through this resistance level, it is expected to open up further upward space; and the channel support is around 3320. Once it falls below, it may trigger a new round of decline.
Overall, the upward resistance levels of gold are 3345, 3350, and 3360; the downward support levels are around 3320 and 3310. Operation strategy:
Short around 3350, stop loss at 3360, profit range 3330-3310.
Long near 3315, stop loss 3305, profit range 3330-3350.
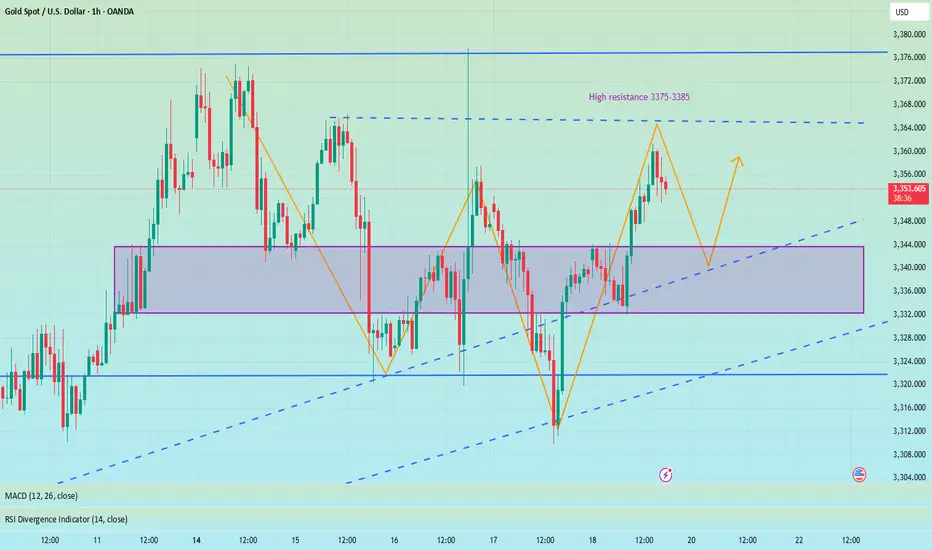
Long and short fluctuations, the market is waiting for a break📰 News information:
1. Powell responds to White House issues
2. Will other countries impose reciprocal sanctions on tariffs?
📈 Technical Analysis:
Although the MACD indicator of the gold hourly line formed a golden cross, the market reached a high of around 3361, and the RSI indicator was close to the overbought area, so we need to be cautious about corrections. From the 4H chart, the MACD second golden cross is on the zero axis. Currently, we are paying attention to the moving average SMA5 near 3343, and the SMA60 support line 3332. If the 4H upward trend falls back, we need to go long. At present, gold is still running above, and there is no good participation point in the short term, but on the whole, we should pay attention to the support of 3345-3332 below, and we can consider going long if it retreats and stabilizes. We continue to pay attention to the resistance pressure of 3375-3385 above, and we can try to go short if it does not break.
🎯 Trading Points:
SELL 3375-3385
TP 3365-3355
BUY 3345-3332
TP 3365-3375-3385
In addition to investment, life also includes poetry, distant places, and Allen. Facing the market is actually facing yourself, correcting your shortcomings, facing your mistakes, and exercising strict self-discipline. I share free trading strategies and analysis ideas every day for reference by brothers. I hope my analysis can help you.
FXOPEN:XAUUSD OANDA:XAUUSD FX:XAUUSD FOREXCOM:XAUUSD PEPPERSTONE:XAUUSD TVC:GOLD
Long XAUUSDPrice retest the fomo zone
Uptrend in H4, M15
Stoploss at the swing low
TP at the previous highest high peak
Lfg
Buy Opp!Hello all. after missing my last idea (I explain the reason on that idea), price is ready to makes a new Higher High. be happy and have a great day. be aware about 16 UTC or times around that. (wink)

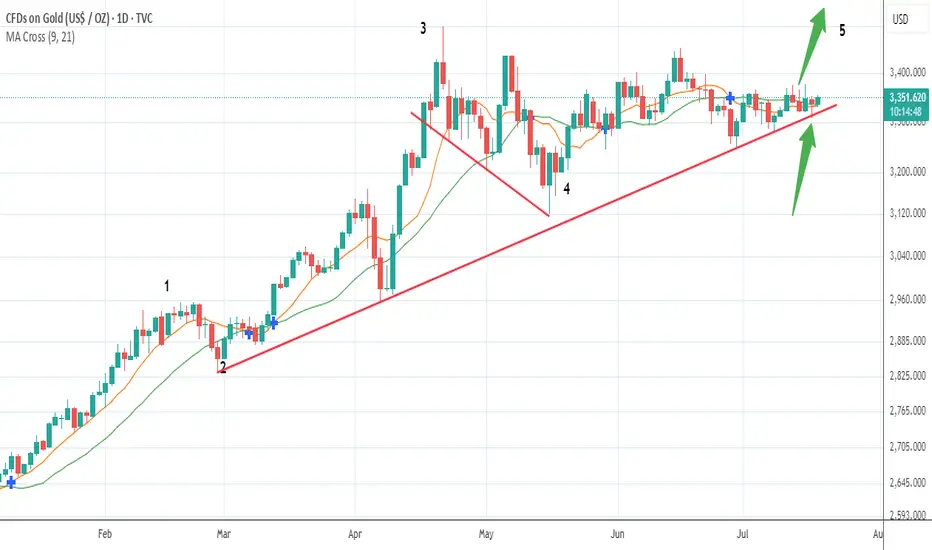
Bet The Farm!Gold's consolidation period in a wave 4 sideways pattern is about to conclude.
Anybody short this asset is about to get burned, a more than 90% probability of an upward surge is imminent.
There are multiple support touch points on this upward trend line...does it get any clearer?
Appreciate a thumbs up...God Bless you all!
Excellent profits booked As I mentioned in yesterday’s commentry session:
My strategy is still the same – buying every dip in Gold around my key level yesterday at 3312, which the market respects well and as our first target was 3345
I'm aiming for a breakout to the upside.
Very happy with the profits so far.
My medium-term targets remain 3380 &3,400 and I’ll keep buying every local low until then.
Also I mentioned if 3310 turns flips on down side then buy at 3290 will be the perfect buy.

BRENT CRUDE OIL FORMED A BEARISH WEDGE. ANOTHER POSSIBLE DECLINEBRENT CRUDE OIL FORMED A BEARISH WEDGE. ANOTHER POSSIBLE DECLINE?📉
USOIL has been trading bullish within the last couple of days, supported by prospects of tighter supply and an improved demand outlook. US crude inventories dropped last week, which indicates firm demand despite the rising output.
Still, technically, oil looks bearish. It has formed a bearish wedge and is currently testing the former trendline from below. The most probable scenario is that wee see the bearish impulse towards 6,500.00 with further decline. Another option is that the rise will continue towards 6,900.00 level.

Xauusd and gold wasn next move police📈 TradingView Professional Bullish Idea – XAUUSD (Gold/USD)
Timeframe: 1H
Bias: Bullish, with confirmation from FVG & CHoCH
Structure:
Strong Break of Market Structure (BMS)
CHoCH (Change of Character) confirming bullish shift
Fair Value Gap (FVG) filled and respected
Price above EMA 50 & 100, showing momentum alignment
---
📌 Trade Plan (Professional Format)
> ENTRY ZONE:
Watch for bullish continuation above 3,339–3,343 FVG zone
Confirmation: Strong candle close above FVG with volume support
> TP Targets:
🎯 TP1: 3,350.00 (previous minor high – already hit)
🎯 TP2: 3,361.00 (liquidity target)
🎯 TP3: 3,375.00 (upper imbalance target)
> STOP LOSS:
🛑 Below 3,324.00 (below previous BMS & demand block)
> Invalidation:
Price closes below 3,322 with volume → invalidates bullish thesis
---
🔍 Idea Summary
> Price has respected demand zone with strong BMS & CHoCH.
FVG filled with bullish reaction suggests possible continuation.
As long as price stays above the EMA cluster and demand, bulls are in control.

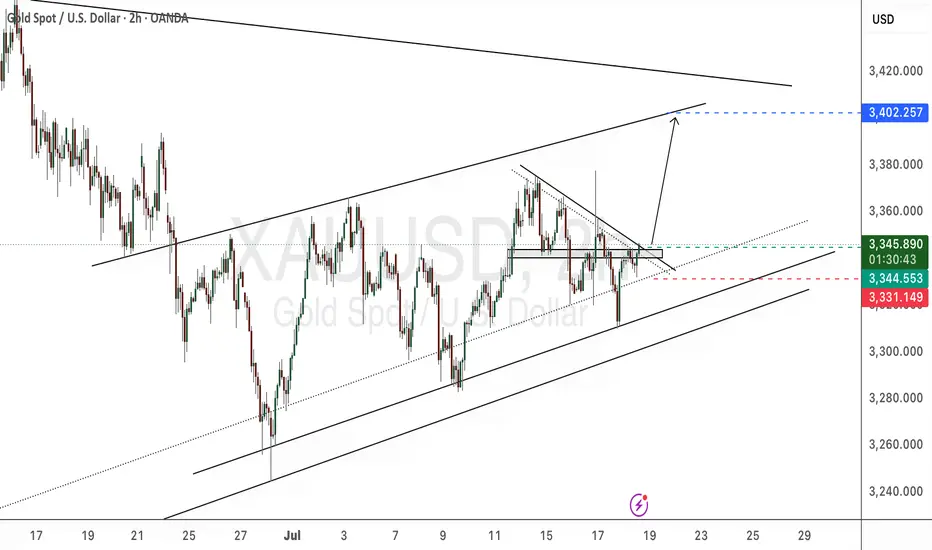
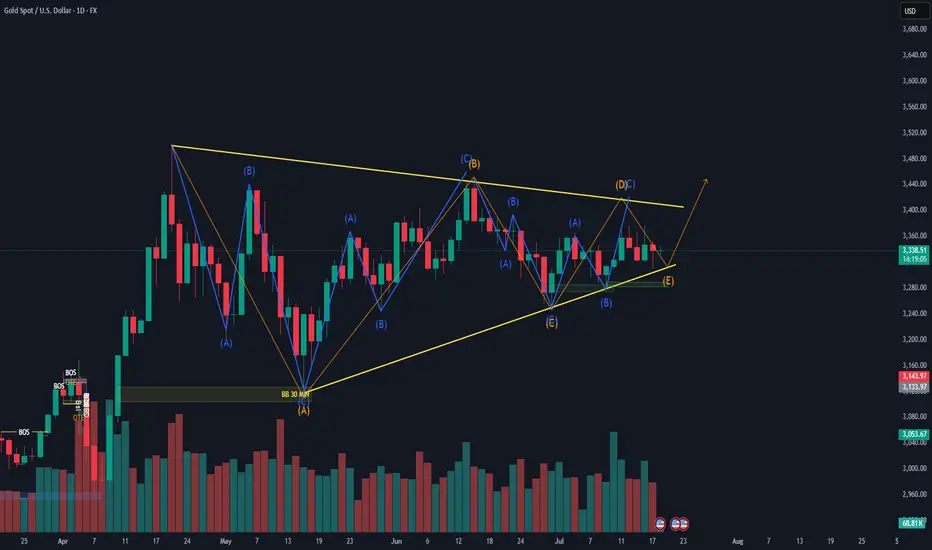
Symmetrical Triangle Correction – Elliott Wave PerspectiveSymmetrical Triangle Correction – Elliott Wave Perspective
The image depicts a Symmetrical Triangle Correction, a common corrective pattern in Elliott Wave Theory. This formation is typically observed during wave 4 or within a complex correction, and it signals consolidation before the next impulsive move.
Structure:
A symmetrical triangle is composed of five corrective waves, labeled A-B-C-D-E.
Each wave itself is subdivided into a-b-c zigzag patterns, indicating a 3-3-3-3-3 structure.
The triangle is bounded by two converging trendlines—one sloping downwards and the other upwards—forming a symmetrical shape.
Key Characteristics:
Occurs after a strong impulse, representing a period of indecision or balance between bulls and bears.
Volume typically contracts during the triangle formation.
The triangle resolves in the direction of the prior trend, meaning this is usually a continuation pattern.
Each leg (A to E) gets progressively smaller, reflecting decreasing volatility.
Market Psychology:
Wave A: Initial reaction to overextension in the previous move.
Wave B: Market attempts to resume the trend but fails.
Wave C: Bears regain strength but with less momentum.
Wave D: Bulls push again, but still no breakout.
Wave E: Final shakeout before breakout.
Trading Implication:
A breakout often occurs after wave E, confirming the end of the correction.
Traders may enter positions in the direction of the prior trend with a stop below/above wave E, targeting a move equal to the widest part of the triangle.
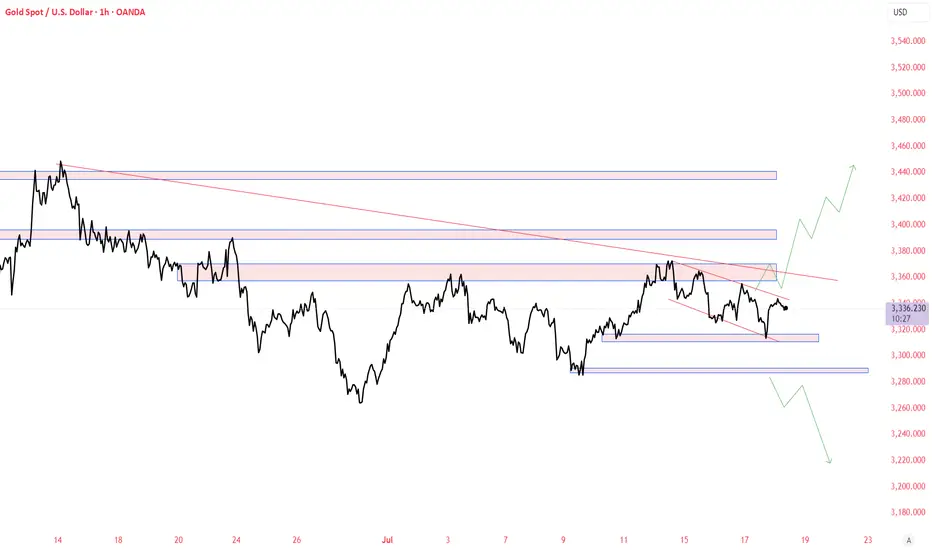
XAUUSD - Falling Wedge Parallel ChannelGold Volatility being more. Banks increasing the gold inventories, may surge to new highs. Sharing Some idea it may go either way some big rally or big correction.
This chart is only for educational purpose, Do your own study before taking any trades
July 18, 2025 - XAUUSD GOLD Analysis and Potential Opportunity🔍 Key Levels to Watch:
• 3375 – Top of range
• 3366 – Resistance
• 3358 – Resistance
• 3350 – Midpoint
• 3345 – Resistance
• 3336 – Support
• 3330–3332 – Support zone
• 3320 – Intraday key support
• 3310 – Key support
• 3300 – Psychological level
📈 Intraday Strategy:
• SELL if price breaks below 3336 → target 3332, then 3330, 3325, 3320
• BUY if price holds above 3345 → target 3348, then 3352, 3358, 3366
👉 If you find this helpful or traded using this plan, a like would mean a lot and keep me motivated. Thanks for the support!
Disclaimer: This is my personal opinion, not financial advice. Always trade with proper risk management.

XAU/USD H8 AnalysisAfter breaking the bullish trend last month, we saw an impulse of selling and a low price of $3245 per troy ounce.
Since then, a corrective pattern has been forming.
Will we see another impulse of selling after the correction is over?
If you agree with this analysis, look for a trade that meets your strategy rules.

Gold Elliott Wave Bearish SetupGold 8H Analysis:
The chart shows a potential Elliott Wave pattern completing its 5th wave. After hitting resistance near 3383, price reversed at point (4) and is projected to drop toward the support zone near 3281. Bearish momentum expected.
