Gold Analysis 7/14/25This week's analysis so far. Keep in mind the Sunday open as price tends to come back to this point sometimes.
Futures market

GOLD: Local Bearish Bias! Short!
My dear friends,
Today we will analyse GOLD together☺️
The recent price action suggests a shift in mid-term momentum. A break below the current local range around 3,358.13 will confirm the new direction downwards with the target being the next key level of 3,349.76.and a reconvened placement of a stop-loss beyond the range.
❤️Sending you lots of Love and Hugs❤️

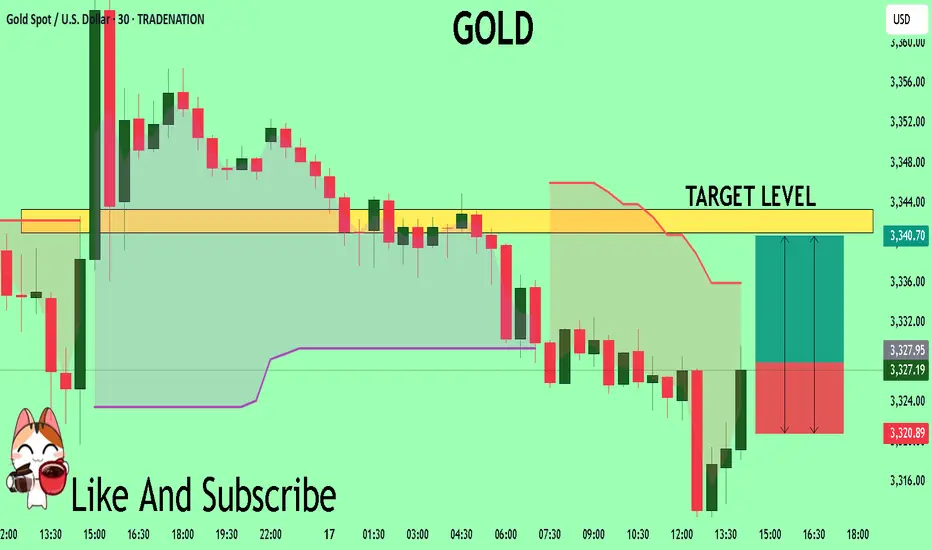
GOLD What Next? BUY!
My dear friends,
GOLD looks like it will make a good move, and here are the details:
The market is trading on 3328.1 pivot level.
Bias - Bullish
Technical Indicators: Supper Trend generates a clear long signal while Pivot Point HL is currently determining the overall Bullish trend of the market.
Goal - 3340.9
Recommended Stop Loss - 3320.8
About Used Indicators:
Pivot points are a great way to identify areas of support and resistance, but they work best when combined with other kinds of technical analysis
Disclosure: I am part of Trade Nation's Influencer program and receive a monthly fee for using their TradingView charts in my analysis.
———————————
WISH YOU ALL LUCK
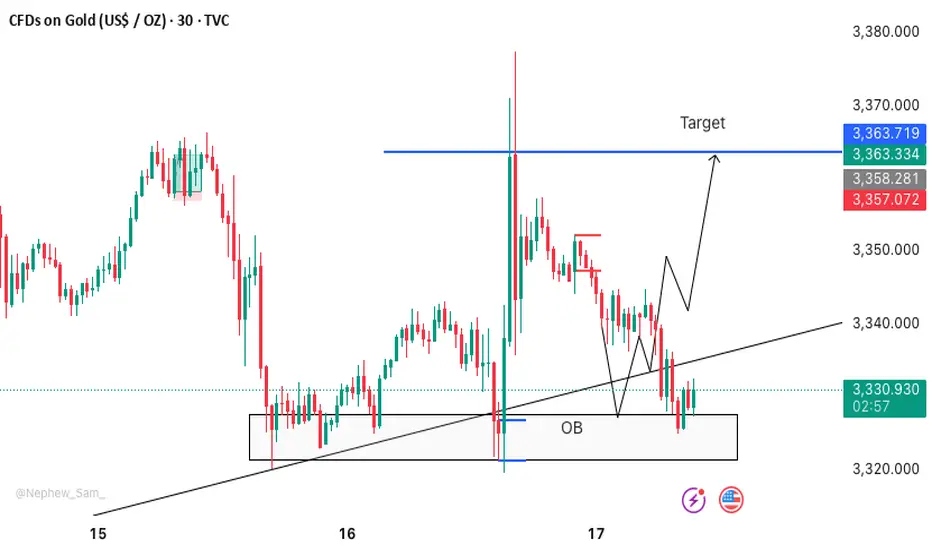
XAUUSD M30 BUY SETUP FOR TODAYScenario:
Best buy zone for Gold as of now: 3327–3323 💰
Strong Order Block zone + Double Bottom pattern 📉📈
Let’s ride the 🚀 from here — follow proper risk management! 🛡️📊
XAUUSD will end July negative.During and post CPI, we saw the price of gold spike up towards 3366 to create a sell order block and quickly reversed to 3310 indicating weakening in bullish momentum. With all the geopolitical tensions easing up, XAUUSD price will respect the technical view. Currently, price seems to be printing a bearish flag pattern. We can expect sharp declines from XAUUSD next week.

GOLD hits resistance – usd strikes back!XAUUSD is charging into the "danger zone" around 3,375 – a level where bulls have fallen before.
But this time, gold faces a heavyweight opponent:
– The US economy is revving up like a race car: consumer demand is surging, jobless claims are dropping.
– The Fed holds its hawkish stance like a loaded weapon: high interest rates aren’t going away.
– The US dollar is back in full force, and bond yields are shooting sky-high.
While gold buyers try to climb higher, pressure from the “USD fortress” is building fast.
Every uptick in XAUUSD now… might just be a setup before the fall.
If selling pressure returns near the previous highs, another sharp drop in gold could be just around the corner.

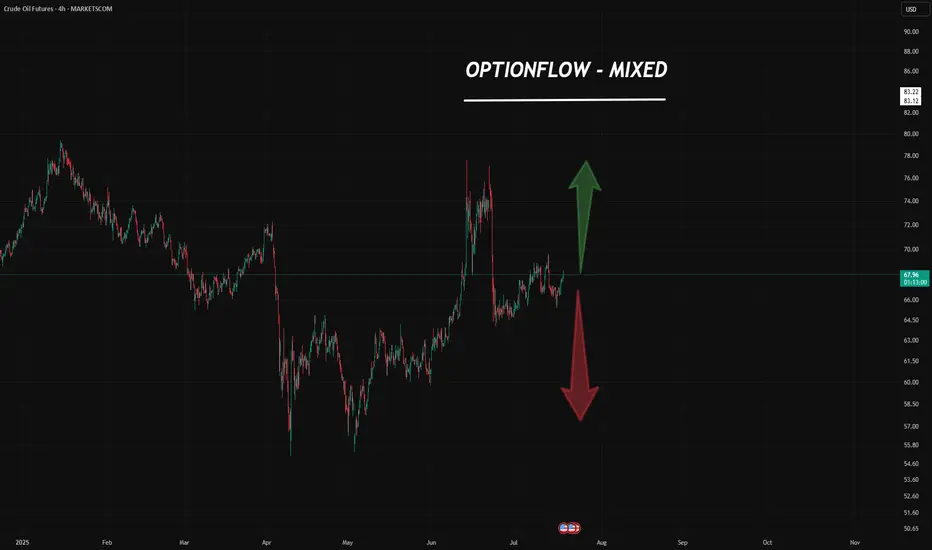
Crude Oil: Bulls vs. Bears — A Market at the Edge
Here’s what we’re seeing from the latest CME block trade data & CME report:
🐻 Confirmed & Detailed Bearish Sentiment
Big players are actively hedging and betting on a drop.
Block trades are targeting key downside levels:
$62.50 , $55.00 , and even as low as $45.00 .
This isn’t noise — it’s institutional conviction.
🐂 Strong Bullish Resistance
At the same time, there’s heavy buying in:
Long futures
Bullish call spreads (1,000+ contracts)
This tells us: there are serious buyers stepping in, targeting $67.50–$72.50 .
They don’t believe in the bear case — and they’re backing it with real money.
🧭 Market at a Bifurcation Point
The presence of massive, conflicting block trades is a clear sign:
The market is preparing for a big move — up or down.
“Smart money” isn’t betting on sideways action.
They’re positioning for breakout volatility .
📊 Final Forecast
Oil is under strong bearish pressure.
That makes a downward scenario more likely in the medium term .
BUT — there’s strong support from big buyers stepping in around $64–$65 .
So the most probable path?
A high-volatility phase , with attempts to test both:
Upper targets (bullish side)
Lower support zones (bearish side)
🔑 Key Battle Zone: $62 – $68
This range will be critical in the days ahead.
Break it — and we’ll know which side is in control.
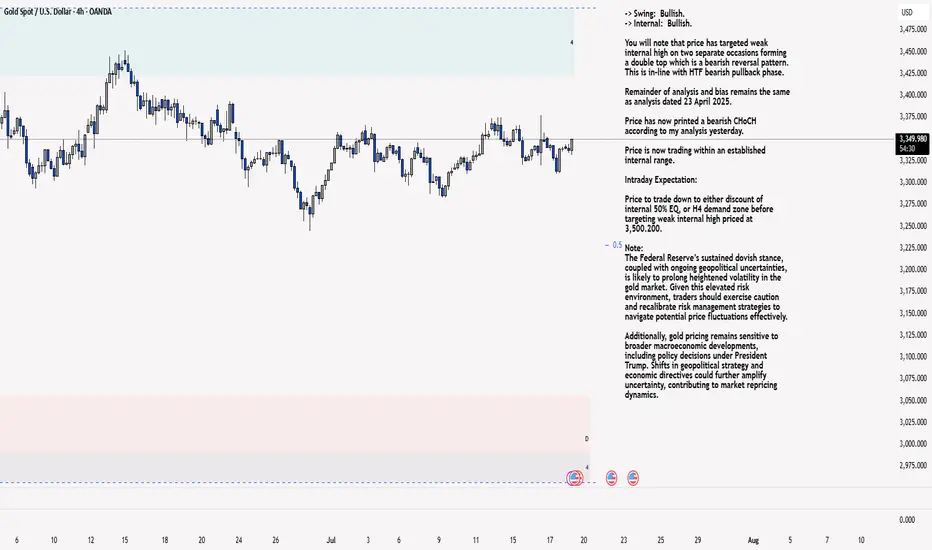
XAU/USD 18 July 2025 Intraday AnalysisH4 Analysis:
-> Swing: Bullish.
-> Internal: Bullish.
You will note that price has targeted weak internal high on two separate occasions forming a double top which is a bearish reversal pattern. This is in-line with HTF bearish pullback phase.
Remainder of analysis and bias remains the same as analysis dated 23 April 2025.
Price has now printed a bearish CHoCH according to my analysis yesterday.
Price is now trading within an established internal range.
Intraday Expectation:
Price to trade down to either discount of internal 50% EQ, or H4 demand zone before targeting weak internal high priced at 3,500.200.
Note:
The Federal Reserve’s sustained dovish stance, coupled with ongoing geopolitical uncertainties, is likely to prolong heightened volatility in the gold market. Given this elevated risk environment, traders should exercise caution and recalibrate risk management strategies to navigate potential price fluctuations effectively.
Additionally, gold pricing remains sensitive to broader macroeconomic developments, including policy decisions under President Trump. Shifts in geopolitical strategy and economic directives could further amplify uncertainty, contributing to market repricing dynamics.
H4 Chart:
M15 Analysis:
-> Swing: Bullish.
-> Internal: Bullish.
H4 Timeframe - Price has failed to target weak internal high, therefore, it would not be unrealistic if price printed a bearish iBOS.
The remainder of my analysis shall remain the same as analysis dated 13 June 2025, apart from target price.
As per my analysis dated 22 May 2025 whereby I mentioned price can be seen to be reacting at discount of 50% EQ on H4 timeframe, therefore, it is a viable alternative that price could potentially print a bullish iBOS on M15 timeframe despite internal structure being bearish.
Price has printed a bullish iBOS followed by a bearish CHoCH, which indicates, but does not confirm, bearish pullback phase initiation. I will however continue to monitor, with respect to depth of pullback.
Intraday Expectation:
Price to continue bearish, react at either M15 supply zone, or discount of 50% internal EQ before targeting weak internal high priced at 3,451.375.
Note:
Gold remains highly volatile amid the Federal Reserve's continued dovish stance, persistent and escalating geopolitical uncertainties. Traders should implement robust risk management strategies and remain vigilant, as price swings may become more pronounced in this elevated volatility environment.
Additionally, President Trump’s recent tariff announcements are expected to further amplify market turbulence, potentially triggering sharp price fluctuations and whipsaws.
M15 Chart:
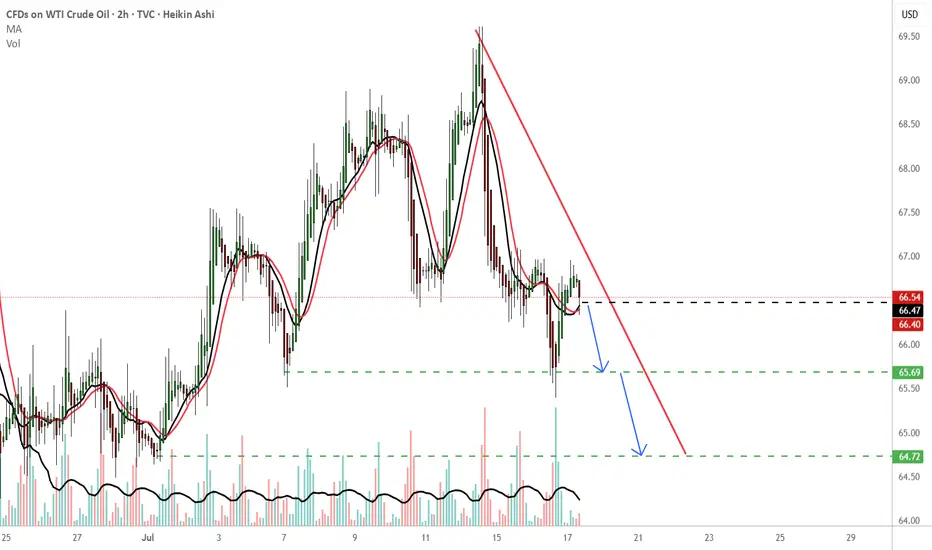
USOILShort short short !!!
-65.69 TP
-64.72 TP2
As long as it's bearish and doesn't close above the red line, assume bearish. The green dotted lines also can suggest demand zones which could suggest a change in direction (bullish soldiers) will enter the battlefield. Trade with focus and follow your trading plan.
THOUGHTS???????
Gold continues to be weak, but be careful about operations📣Gold prices fell 2% last Friday, hitting a near one-month low. Optimistic trade-related agreements boosted risk appetite and weakened the attractiveness of gold as a safe-haven asset. This week, the market will usher in a group meeting of major central bank governors around the world (Fed Chairman Powell, European Central Bank President Lagarde, Bank of England Governor Bailey, Bank of Japan Governor Kazuo Ueda, and Bank of Korea Governor Lee Chang-yong). The market will also usher in non-agricultural data. In addition, Powell's remarks on whether to resign may ignite the market this week. Gold prices may fluctuate more around the lower track of the Bollinger Band at $3,270/ounce this week.
Technical analysis:
Last Friday, the K-line had a lower shadow, and the Bollinger Band did not diverge. It is not easy to go short directly in operation, but wait for the rebound to confirm 3295 and the key resistance of ma5 to be short.
💰 Operation strategy: Rebound to 3280-3283 to go short, target 3270-3265, stop loss 3288-3290
If you are a beginner, I suggest you first understand what trading is.

XAUUSD: Market analysis and strategy for July 17.Gold technical analysis
Daily chart resistance: 3382, support below 3300
Four-hour chart resistance: 3375, support below 3320
One-hour chart resistance: 3352, support below 3320.
Trump's remarks in the NY market on Wednesday ignited the market. First, it was reported that Powell would be fired, and then it was reported that Trump denied the news. Gold quickly rose to 3375 and then quickly fell back. Under the impact of the news, the price fluctuated very quickly, jumping up and down quickly.
From the current market trend, the day before yesterday, it fell to 3319 and stopped falling and rebounded. Yesterday, it tested 3319 again and quickly pulled up. Yesterday, the price hit the high point of this week near 3375 again and fell back quickly. There is support below and resistance above. If it approaches the 3320 support for the third time today, it is likely to fall below, and then trigger a long stop loss, and it may fall rapidly at that time.
If it falls below 3319, it will look at the 3280~3300 range.
SELL:3319 SL:3324
SELL:3352 SL:3357

The 7.15 gold shock adjustment is not the top!7.15 Gold Operation Strategy Reference:
Short Order Strategy:
Strategy 1: When gold rebounds around 3370-3375, short (buy short) 20% of the position in batches, stop loss 10 points, target around 3350-3345, break to see 3340 line;
Long Order Strategy:
Strategy 2: When gold pulls back to around 3340-3345, long (buy long) 20% of the position in batches, stop loss 10 points, target around 3355-3365, break to see 3375 line;
I am a financial enthusiast. I may not have a 100% winning rate. If you are a novice or your account is about to be burned, you can ask me. I will give you free professional advice.
XAUUSD AND GOLD WAS GOES TO BEARISH
🔴 XAUUSD 15M Bearish Trading Idea – Smart Money Trap Unfolding 🩸
🕒 Timeframe: 15-Minute
📉 Bias: Bearish
📊 Strategy: Smart Money Concepts – CHoCH | FVG | LH | LL | BMS | Liquidity Trap
---
📌 Market Context & Structure:
1. Price Action Breakdown:
Market ne Lower High (LH) aur Lower Low (LL) ka consistent bearish structure maintain kiya hai.
A recent CHoCH upward hua, lekin yeh likely a liquidity trap hai — price ne key supply zone ko tap kar ke rejection diya hai.
2. Key FVG Zones:
Multiple bearish FVGs upar exist karti hain (visible in red), jahan price ne react kiya.
Price ne bullish FVG fill karke ab lower timeframe supply zone mein stall karna start kiya hai.
3. EMA Confirmation:
Despite temporary crossover, EMAs still flat or indecisive — suggesting reversal or fakeout.
Price EMA ke around struggle kar raha hai, jo weak bullish attempt ka sign hai.
4. Order Block & Rejection Area:
Current resistance zone (3342–3348) pe strong selling pressure hua hai — potential mitigation + sell-off zone.
---
🔻 Trade Plan – Bearish Continuation Setup:
🔸 Entry Zone:
3342 – 3346 (After rejection confirmation in this zone)
🔻 Stop Loss:
Above 3349 (Above recent LH / supply trap)
🎯 Take Profits:
TP1: 3333 (Recent support)
TP2: 3322 (Demand imbalance)
TP3: 3315 (Major liquidity pool)
📏 Risk:Reward: Targeting 1:2.5 to 1:3+ depending on entry accuracy
---
🧠 Why This Setup is Bearish?
✅ CHoCH bullish was likely a trap; no strong follow-through
✅ Price rejected from key FVG supply zone
✅ Bearish structure still intact — LHs and LLs dominate
✅ EMAs flattening near resistance shows weakness
✅ Liquidity above recent highs has likely been swept — sellers may now dominate

YM_US30_DOW JONES_RECAP-WEEKLY-FVG_TAPPED-BUYWednesday has created the low of the week tapping into the weekly FVG, tomorrow i expect a continuation to the upside. Taking out previous weeks high.

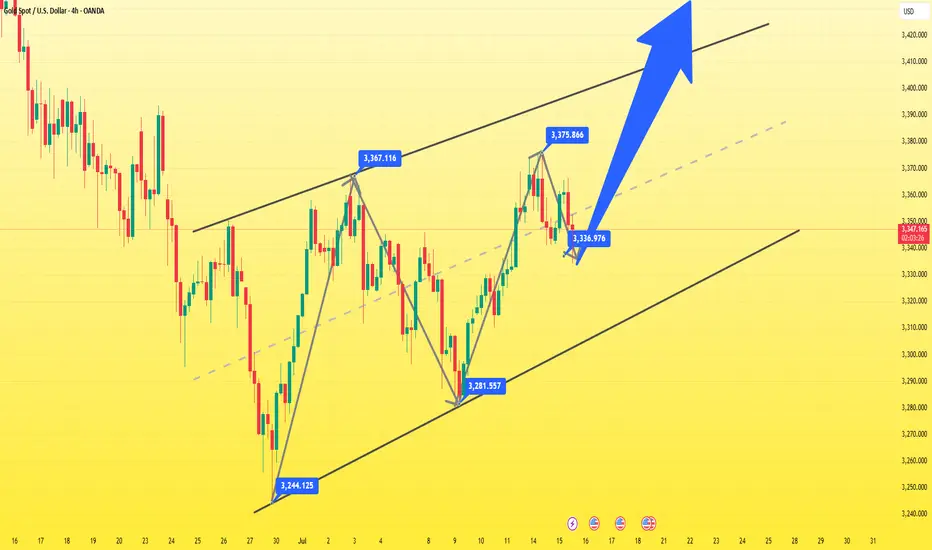
Patience Before Pump GOLD? | Setup of the Week?Gold (XAU/USD) | Liquidity Grab + Fib Zone
Price swept liquidity and respected ascending channel support.
If bulls hold above 3,330, next target = 3,377.
📊 Is this the reversal we’ve been waiting for?
Are you long or short on gold? Let’s talk below 👇

COPPER Top of 4-year Rising Wedge. Sell.Copper (HG1!) eventually followed the bearish break-out signal we gave on our last analysis (April 03, see chart below) and within 2 days it hit our 4.1250 Target:
Right now the price sits at the top of the 4-year Rising Wedge pattern and on the 1W time-frame it is a textbook technical sell signal.
With the 1W RSI also rejected on a Lower Highs trend-line, we are looking to aim for the 1W MA50 (blue trend-line) at least. Every Bearish Leg since the July 11 2022 Low, reached at least its 0.618 Fibonacci retracement level before rebounding again.
As a result, our Target is 4.700, which given a fair 3-month time-frame, should be at the time marginally below the 1W MA50, in line with all previous bottoms of the Rising Wedge.
-------------------------------------------------------------------------------
** Please LIKE 👍, FOLLOW ✅, SHARE 🙌 and COMMENT ✍ if you enjoy this idea! Also share your ideas and charts in the comments section below! This is best way to keep it relevant, support us, keep the content here free and allow the idea to reach as many people as possible. **
-------------------------------------------------------------------------------
💸💸💸💸💸💸
👇 👇 👇 👇 👇 👇

Momentum to the buy sideThe S&P 500 daily chart is exhibiting momentum to the buy side with a positive reaction to earnings and economic reports. The next challenge will be a close above 6360 per Friday.

XAUUSDWhat I see in gold is a lack of bullish momentum, and fundamental factors also support the idea that XAU/USD is likely to take a breather.
I’m expecting the price to touch the 3295 level, and I’m a seller at 3344.

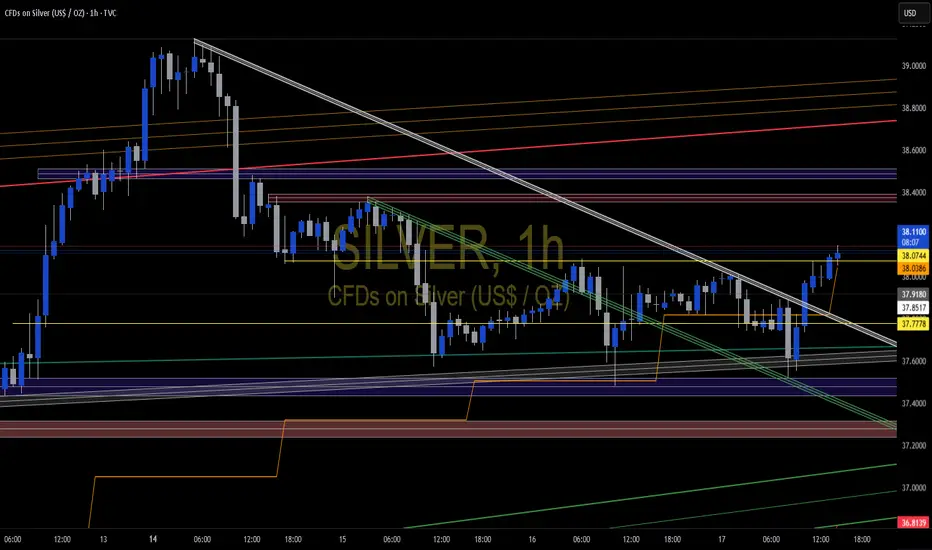
Silver (XAGUSD) – Watch for Bullish Reaction at Key Liquidity ZoDescription:
Silver is now approaching a key liquidity and structural support zone between 37.2805 and 36.8841 (marked by the bottom two blue lines on the chart). This area is likely to attract significant attention, with the potential for stop-losses of buyers below the prior structure to be triggered—a classic liquidity grab scenario.
Trading Idea:
Do NOT enter blindly at these levels.
Wait for price to dip into the 37.28–36.88 range, ideally triggering a liquidity sweep and a spike in volume.
Only consider a long entry after a clear bullish reaction in this zone—such as a strong reversal candle, a bullish engulfing, or a pronounced uptick in net volume.
For extra confirmation, look for a retest of the zone after the first reaction, to confirm that the level is holding as support.
Risk Management:
Stop-loss below the lower end of the entry zone (under 36.88) or the liquidity sweep low.
Target the next resistance levels: 37.88, 38.40, and 38.99–39.00.
Key Points:
The 37.28–36.88 area is a liquidity zone—expect increased volatility and potential for fake-outs.
Wait for confirmation and ideally a retest before considering entry.
Ignore the entry zone if price simply breaks through without a bullish reaction.
Summary:
Let price sweep liquidity and show its hand in the 37.28–36.88 zone. Only enter on clear bullish confirmation and a solid retest. Trade what you see, not what you hope for!

The AI Boom's Unsung HeroThe rise of artificial intelligence isn’t just shaking up tech companies it’s quietly transforming the global silver market in a big way. As major players like NVIDIA, Google and others ramp up their AI infrastructure silver is becoming more critical than ever. Why? Because silver, thanks to its unmatched electrical conductivity, plays a key role in powering the hardware behind AI.
Silver is the most conductive metal on Earth. That makes it perfect for high-performance computing something AI needs a lot of. It’s especially important in data centers and advanced semiconductors, where both electrical and thermal performance are mission-critical.
What’s really interesting is that AI servers tend to use two to three times more silver than traditional data center servers. That’s because AI workloads are more power-hungry, generate more heat and require more complex cooling and electrical systems. Simply put, more AI means more silver.
If there’s one company at the heart of this trend it’s NVIDIA. Analysts at Morgan Stanley expect NVIDIA to consume a staggering 77% of all silicon wafers used for AI accelerators in 2025 up from 51% in 2024. That adds up to around 535,000 300-mm wafers a year each of which contains silver in key components.
All of this AI growth is showing up in the numbers. Industrial silver demand hit an all-time high of 680.5 million ounces in 2024. The electronics industry alone uses around 250 million ounces per year and AI is now the fastest-growing part of that.
Despite all this demand, silver supply just isn’t keeping up. The market’s been in deficit for four straight years, with a total shortfall of 678 million ounces between 2021 and 2024. That’s roughly ten months of global mine output gone missing from the balance sheet.
It’s no surprise, then, that silver prices have been climbing fast. As of July 2025 silver’s up nearly 30% for the year. Looking further ahead I see room for silver to keep climbing:
In the short term (2025): $36–$42 per ounce seems realistic
By 2026: Potential for $50+ as more AI growth stays strong
AI isn’t just changing how we work, communicate, or compute—it’s literally reshaping the commodities that make this technology possible. Silver, once thought of mainly in the context of jewelry or coins, is now a backbone material for the AI revolution.

Gold 30 min ideaWe said by previous analysis gold down to 3312 ( see my previous chart). Now we booked that profits. So next will be 3296.

XAU / USD 1 Hour ChartHello traders. So we had a push down, and now if the retest is valid, I will look to possibly take the move down IF New York volume moves in that direction. We can easily push back up to take out people like me looking to or taking a short position. It's all about timing. Trade carefull, let's see how the next 15 minutes play out. Shout out to Big G.
